Grundläggande statistik
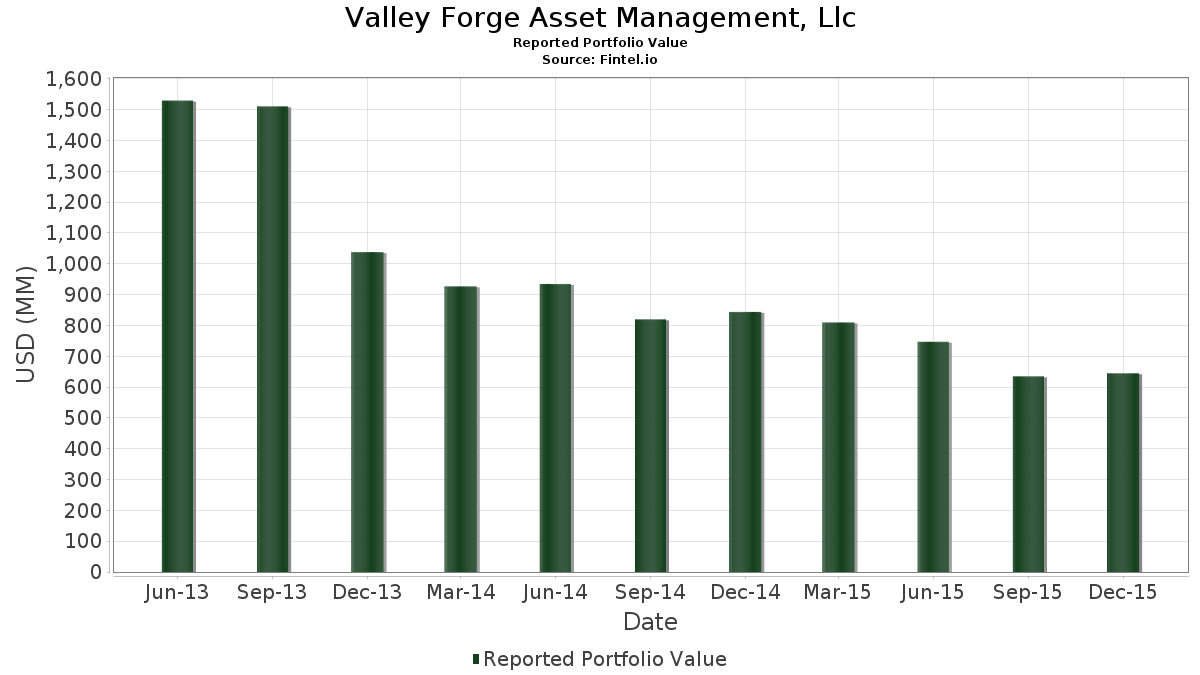
| Portföljvärde | $ 644 632 000 |
| Aktuella positioner | 98 |
Senaste innehav, resultat, förvaltat kapital (från 13F, 13D)
Valley Forge Asset Management, Llc har redovisat 98 totala innehav i sina senaste SEC-arkiveringar. Det senaste portföljvärdet beräknas vara $ 644 632 000 USD. Faktiskt förvaltade tillgångar (AUM) är detta värde plus likvida medel (som inte redovisas). Valley Forge Asset Management, Llcs största innehav är General Electric Company (US:GE) , Intel Corporation (US:INTC) , Pfizer Inc. (US:PFE) , Microsoft Corporation (US:MSFT) , and Johnson & Johnson (US:JNJ) . Valley Forge Asset Management, Llcs nya positioner inkluderar Infosys Limited - Depositary Receipt (Common Stock) (US:INFY) , AbbVie Inc. (US:ABBV) , Yum! Brands, Inc. (US:YUM) , Flagstar Financial, Inc. (US:NYCB) , and NIKE, Inc. (US:NKE) .
Största ökningarna detta kvartal
Vi använder förändringen i portföljallokeringen eftersom det är det mest meningsfulla måttet. Förändringar kan bero på transaktioner eller förändringar i aktiekurser.
| Värdepapper | Aktier (MM) |
Värde (MM$) |
Portfölj % av | ΔPortfölj % av |
|---|---|---|---|---|
| 0,30 | 10,45 | 1,6203 | 1,6203 | |
| 0,14 | 11,15 | 1,7298 | 1,4403 | |
| 0,51 | 8,50 | 1,3183 | 1,3183 | |
| 0,13 | 7,91 | 1,2272 | 1,2272 | |
| 0,10 | 7,18 | 1,1133 | 1,1133 | |
| 0,18 | 12,56 | 1,9492 | 1,0900 | |
| 0,05 | 6,34 | 0,9834 | 0,9834 | |
| 0,28 | 4,57 | 0,7094 | 0,7094 | |
| 0,73 | 22,83 | 3,5412 | 0,4832 | |
| 0,04 | 3,07 | 0,4769 | 0,4769 |
Största minskningarna detta kvartal
Vi använder förändringen i portföljallokeringen eftersom det är det mest meningsfulla måttet. Förändringar kan bero på transaktioner eller förändringar i aktiepriser.
| Värdepapper | Aktier (MM) |
Värde (MM$) |
Portfölj % av | ΔPortfölj % av |
|---|---|---|---|---|
| 0,01 | 0,95 | 0,1478 | −1,3744 | |
| 0,00 | 0,00 | −1,3699 | ||
| 0,00 | 0,27 | 0,0420 | −1,1921 | |
| 0,00 | 0,00 | −1,0485 | ||
| 0,00 | 0,00 | −0,9405 | ||
| 0,00 | 0,00 | −0,9173 | ||
| 0,58 | 7,68 | 1,1920 | −0,9114 | |
| 0,20 | 5,24 | 0,8130 | −0,8737 | |
| 0,11 | 6,93 | 1,0746 | −0,8322 | |
| 0,11 | 8,12 | 1,2590 | −0,7741 |
13F- och fond arkiveringar
Denna blankett lämnades in den 2016-02-09 för rapporteringsperioden 2015-12-31. Klicka på länksymbolen för att se hela transaktionshistoriken.
Uppgradera för att låsa upp premiumdata och exportera till Excel![]() .
.
| Värdepapper | Typ | Genomsnittligt aktiepris | Aktier (MM) |
ΔAktier (%) |
ΔAktier (%) |
Värde ($MM) |
Portfölj (%) |
ΔPortfölj (%) |
|
|---|---|---|---|---|---|---|---|---|---|
| GE / General Electric Company | 0,73 | −4,79 | 22,83 | 17,60 | 3,5412 | 0,4832 | |||
| INTC / Intel Corporation | 0,59 | −5,45 | 20,32 | 8,07 | 3,1516 | 0,1901 | |||
| PFE / Pfizer Inc. | 0,60 | −1,98 | 19,48 | 0,73 | 3,0213 | −0,0245 | |||
| MSFT / Microsoft Corporation | 0,34 | −4,66 | 18,98 | 19,52 | 2,9451 | 0,4427 | |||
| JNJ / Johnson & Johnson | 0,18 | −3,97 | 18,24 | 5,66 | 2,8289 | 0,1100 | |||
| BAC / Bank of America Corporation | 1,00 | −2,52 | 16,81 | 5,30 | 2,6083 | 0,0930 | |||
| VZ / Verizon Communications Inc. | 0,36 | 5,37 | 16,47 | 11,93 | 2,5554 | 0,2370 | |||
| MRK / Merck & Co., Inc. | 0,29 | 3,65 | 15,48 | 10,85 | 2,4017 | 0,2014 | |||
| PAYX / Paychex, Inc. | 0,28 | 6,03 | 15,00 | 17,74 | 2,3272 | 0,3199 | |||
| FITB / Fifth Third Bancorp | 0,74 | −3,28 | 14,78 | 2,81 | 2,2928 | 0,0281 | |||
| CSCO / Cisco Systems, Inc. | 0,53 | −1,04 | 14,31 | 2,37 | 2,2196 | 0,0177 | |||
| WFC / Wells Fargo & Company | 0,26 | 2,01 | 14,29 | 7,99 | 2,2163 | 0,1321 | |||
| XOM / Exxon Mobil Corporation | 0,18 | 3,58 | 14,04 | 8,60 | 2,1781 | 0,1414 | |||
| T / AT&T Inc. | 0,40 | 1,15 | 13,79 | 6,82 | 2,1394 | 0,1056 | |||
| ORCL / Oracle Corporation | 0,36 | −10,39 | 13,09 | −9,37 | 2,0305 | −0,2446 | |||
| WM / Waste Management, Inc. | 0,24 | −4,92 | 12,64 | 1,88 | 1,9613 | 0,0063 | |||
| SLB / Schlumberger Limited | 0,18 | 127,82 | 12,56 | 130,38 | 1,9492 | 1,0900 | |||
| UPS / United Parcel Service, Inc. | 0,13 | −8,94 | 12,11 | −11,20 | 1,8784 | −0,2699 | |||
| WMT / Walmart Inc. | 0,19 | 11,64 | 11,94 | 5,54 | 1,8521 | 0,0700 | |||
| PEP / PepsiCo, Inc. | 0,12 | 14,24 | 11,50 | 21,04 | 1,7841 | 0,2872 | |||
| VOD / Vodafone Group Public Limited Company - Depositary Receipt (Common Stock) | 0,35 | 14,31 | 11,42 | 16,19 | 1,7717 | 0,2232 | |||
| ABT / Abbott Laboratories | 0,25 | −4,94 | 11,36 | 6,15 | 1,7629 | 0,0763 | |||
| BA / The Boeing Company | 0,08 | −5,54 | 11,21 | 4,29 | 1,7382 | 0,0457 | |||
| PG / The Procter & Gamble Company | 0,14 | 449,41 | 11,15 | 506,69 | 1,7298 | 1,4403 | |||
| KMB / Kimberly-Clark Corporation | 0,09 | −4,60 | 11,01 | 11,37 | 1,7081 | 0,1506 | |||
| GOOG / Alphabet Inc. | 0,01 | −4,23 | 10,86 | 19,45 | 1,6853 | 0,2525 | |||
| TRI / Thomson Reuters Corporation | 0,28 | −3,94 | 10,74 | −9,69 | 1,6662 | −0,2073 | |||
| AAPL / Apple Inc. | 0,10 | −6,40 | 10,57 | −10,67 | 1,6392 | −0,2242 | |||
| M / Macy's, Inc. | 0,30 | 37,71 | 10,45 | −18,75 | 1,6203 | 1,6203 | |||
| MS / Morgan Stanley | 0,33 | −20,13 | 10,37 | −19,34 | 1,6087 | −0,4167 | |||
| SYY / Sysco Corporation | 0,24 | 7,29 | 9,93 | 12,88 | 1,5403 | 0,1546 | |||
| CME / CME Group Inc. | 0,11 | −1,23 | 9,84 | −3,51 | 1,5261 | −0,0801 | |||
| CSX / CSX Corporation | 0,38 | −19,78 | 9,80 | −22,62 | 1,5201 | −0,4748 | |||
| NLY / Annaly Capital Management, Inc. | 1,01 | −20,91 | 9,52 | −24,84 | 1,4760 | −0,5182 | |||
| PYPL / PayPal Holdings, Inc. | 0,25 | −2,44 | 8,90 | 13,79 | 1,3814 | 0,1485 | |||
| FAST / Fastenal Company | 0,22 | 5,99 | 8,90 | 18,18 | 1,3805 | 0,1942 | |||
| COST / Costco Wholesale Corporation | 0,05 | −6,81 | 8,84 | 4,11 | 1,3715 | 0,0337 | |||
| INFY / Infosys Limited - Depositary Receipt (Common Stock) | 0,51 | 8,50 | 1,3183 | 1,3183 | |||||
| TGT / Target Corporation | 0,11 | −31,88 | 8,12 | −37,11 | 1,2590 | −0,7741 | |||
| ABBV / AbbVie Inc. | 0,13 | 7,91 | 1,2272 | 1,2272 | |||||
| KEY / KeyCorp | 0,58 | −43,24 | 7,68 | −42,45 | 1,1920 | −0,9114 | |||
| TRV / The Travelers Companies, Inc. | 0,07 | −6,26 | 7,67 | 6,30 | 1,1891 | 0,0531 | |||
| F / Ford Motor Company | 0,54 | −7,41 | 7,63 | −3,87 | 1,1841 | −0,0667 | |||
| CLB / Core Laboratories Inc. | 0,07 | 1,50 | 7,55 | 10,55 | 1,1715 | 0,0954 | |||
| ETN / Eaton Corporation plc | 0,14 | 4,20 | 7,53 | 5,71 | 1,1687 | 0,0460 | |||
| YUM / Yum! Brands, Inc. | 0,10 | 7,18 | 1,1133 | 1,1133 | |||||
| VFC / V.F. Corporation | 0,11 | −37,29 | 6,93 | −42,77 | 1,0746 | −0,8322 | |||
| BBBY / Bed Bath & Beyond, Inc. | 0,14 | 41,42 | 6,81 | 19,68 | 1,0567 | 0,1600 | |||
| IHRMF / iShares Public Limited Company - iShares MSCI Japan UCITS ETF USD (Dist) | 0,55 | −4,78 | 6,71 | 0,98 | 1,0403 | −0,0059 | |||
| IBM / International Business Machines Corporation | 0,05 | 6,34 | 0,9834 | 0,9834 | |||||
| 847560109 / Spectra Energy Corp. | 0,24 | 9,69 | 5,75 | −0,03 | 0,8920 | −0,0142 | |||
| VWO / Vanguard International Equity Index Funds - Vanguard FTSE Emerging Markets ETF | 0,17 | −32,57 | 5,63 | −33,35 | 0,8729 | −0,4570 | |||
| Market Vectors Biotech ETF / (57060U183) | 0,04 | −9,81 | 5,45 | 0,15 | 0,0000 | ||||
| EMC / Global X Funds - Global X Emerging Markets Great Consumer ETF | 0,20 | −53,95 | 5,24 | −51,05 | 0,8130 | −0,8737 | |||
| IP / International Paper Company | 0,13 | −48,20 | 4,74 | −48,32 | 0,7353 | −0,7096 | |||
| NYCB / Flagstar Financial, Inc. | 0,28 | 4,57 | 0,7094 | 0,7094 | |||||
| DVY / iShares Trust - iShares Select Dividend ETF | 0,05 | 32,87 | 4,07 | 37,23 | 0,6307 | 0,1640 | |||
| RSP / Invesco Exchange-Traded Fund Trust - Invesco S&P 500 Equal Weight ETF | 0,04 | 1,15 | 3,07 | 5,38 | 0,4769 | 0,4769 | |||
| EEM / iShares, Inc. - iShares MSCI Emerging Markets ETF | 0,08 | 518,60 | 2,73 | 508,02 | 0,4235 | 0,3528 | |||
| HDV / iShares Trust - iShares Core High Dividend ETF | 0,03 | 19,56 | 2,54 | 26,15 | 0,3943 | 0,0769 | |||
| 153501101 / Central Fund of Canada Ltd. | 0,24 | −10,98 | 2,44 | −16,06 | 0,3787 | −0,0794 | |||
| SPY / SPDR S&P 500 ETF | 0,01 | −4,55 | 2,23 | 1,54 | 0,3467 | −0,0000 | |||
| VFINX / Vanguard Index Funds - Vanguard Index Trust 500 Index Fund | 0,01 | −10,45 | 1,66 | −4,75 | 0,2580 | 0,2580 | |||
| KO / The Coca-Cola Company | 0,03 | 26,95 | 1,40 | 35,95 | 0,2176 | 0,0551 | |||
| USB / U.S. Bancorp | 0,02 | 7,59 | 1,03 | 11,98 | 0,1595 | 0,0149 | |||
| DOW / Dow Inc. | 0,01 | −92,86 | 0,95 | −90,14 | 0,1478 | −1,3744 | |||
| SBAC / SBA Communications Corporation | 0,01 | 0,00 | 0,88 | 0,23 | 0,1367 | −0,0018 | |||
| EMR / Emerson Electric Co. | 0,02 | 0,00 | 0,77 | 0,1199 | 0,1199 | ||||
| MMM / 3M Company | 0,00 | −0,91 | 0,74 | 5,28 | 0,1145 | 0,0041 | |||
| MO / Altria Group, Inc. | 0,01 | 54,44 | 0,63 | 65,09 | 0,0976 | 0,0376 | |||
| QQQ / Invesco QQQ Trust, Series 1 | 0,01 | 3,03 | 0,61 | 13,41 | 0,0945 | 0,0945 | |||
| CL / Colgate-Palmolive Company | 0,01 | 19,41 | 0,53 | 25,54 | 0,0816 | 0,0156 | |||
| GSK / GSK plc - Depositary Receipt (Common Stock) | 0,01 | 4,75 | 0,51 | 10,11 | 0,0794 | 0,0062 | |||
| MCD / McDonald's Corporation | 0,00 | 0,00 | 0,48 | 19,85 | 0,0740 | 0,0113 | |||
| VEU / Vanguard International Equity Index Funds - Vanguard FTSE All-World ex-US ETF | 0,01 | 2,94 | 0,46 | 4,76 | 0,0717 | 0,0022 | |||
| RDS.B / Shell Plc - ADR | 0,01 | −21,82 | 0,46 | −24,17 | 0,0710 | −0,0241 | |||
| MKC / McCormick & Company, Incorporated | 0,01 | 6,06 | 0,45 | 10,32 | 0,0697 | 0,0055 | |||
| GLD / SPDR Gold Trust | 0,00 | −0,90 | 0,44 | −5,93 | 0,0689 | −0,0055 | |||
| 904784709 / Unilever N.V. | 0,01 | −2,06 | 0,41 | 5,37 | 0,0639 | 0,0023 | |||
| HD / The Home Depot, Inc. | 0,00 | 0,00 | 0,33 | 14,53 | 0,0513 | 0,0058 | |||
| MDY / SPDR S&P MidCap 400 ETF Trust | 0,00 | 0,00 | 0,29 | 2,10 | 0,0453 | 0,0002 | |||
| TMO / Thermo Fisher Scientific Inc. | 0,00 | 0,00 | 0,28 | 15,92 | 0,0441 | 0,0055 | |||
| PM / Philip Morris International Inc. | 0,00 | 0,00 | 0,27 | 0,0420 | 0,0420 | ||||
| DIS / The Walt Disney Company | 0,00 | −96,63 | 0,27 | −96,54 | 0,0420 | −1,1921 | |||
| JOF / Japan Smaller Capitalization Fund, Inc. | 0,03 | −3,89 | 0,26 | −3,36 | 0,0402 | −0,0020 | |||
| STZ / Constellation Brands, Inc. | 0,00 | −5,26 | 0,26 | 7,56 | 0,0397 | 0,0022 | |||
| IAU / iShares Gold Trust | 0,02 | 1,86 | 0,25 | −3,49 | 0,0386 | −0,0020 | |||
| NKE / NIKE, Inc. | 0,00 | 0,24 | 0,0379 | 0,0379 | |||||
| AZO / AutoZone, Inc. | 0,00 | 0,00 | 0,22 | 2,76 | 0,0346 | 0,0004 | |||
| RDS.A / Shell Plc - ADR (Representing Ordinary Shares - Class A) | 0,00 | −4,08 | 0,21 | −7,33 | 0,0334 | −0,0032 | |||
| XLK / The Select Sector SPDR Trust - The Technology Select Sector SPDR Fund | 0,00 | 0,20 | 0,0312 | 0,0312 | |||||
| EMF / Templeton Emerging Markets Fund | 0,02 | 7,98 | 0,16 | −2,41 | 0,0251 | −0,0010 | |||
| JEQ / Abrdn Japan Equity Fund Inc | 0,02 | −25,97 | 0,13 | −16,46 | 0,0205 | −0,0044 | |||
| PHYS / Sprott Physical Gold Trust | 0,01 | 0,00 | 0,13 | −5,07 | 0,0203 | −0,0014 | |||
| TRST / TrustCo Bank Corp NY | 0,02 | −36,36 | 0,11 | −33,54 | 0,0166 | −0,0088 | |||
| 300487105 / EVINE Live Inc. | 0,01 | 0,02 | 0,0029 | 0,0029 | |||||
| DML / Denison Mines Corp. | 0,01 | 0,00 | 0,01 | 16,67 | 0,0011 | 0,0001 | |||
| 23437P208 / Daleco Resources Corp. | 0,12 | 0,00 | 0,00 | −20,00 | 0,0006 | −0,0002 | |||
| DKS / DICK'S Sporting Goods, Inc. | 0,00 | −100,00 | 0,00 | −100,00 | −1,0485 | ||||
| CEF Invesco Value Fund / (EGB32P104) | 0,09 | 0,00 | 0,00 | 0,0000 | |||||
| CMCSA / Comcast Corporation | 0,00 | −100,00 | 0,00 | −100,00 | −1,3699 | ||||
| DOW / Dow Inc. | 0,00 | −100,00 | 0,00 | −100,00 | 0,0000 | 0,0000 | |||
| GG / Goldcorp, Inc. | 0,00 | −100,00 | 0,00 | −100,00 | −0,0203 | ||||
| SEAOF / SeaCo Ltd. | 0,05 | 0,00 | 0,00 | 0,0000 | 0,0000 | ||||
| AUY / Yamana Gold Inc. | 0,00 | −100,00 | 0,00 | −100,00 | −0,0035 | ||||
| COP / ConocoPhillips | 0,00 | −100,00 | 0,00 | −100,00 | −0,7478 | ||||
| STJ / St. Jude Medical, Inc. | 0,00 | −100,00 | 0,00 | −100,00 | −0,9173 | ||||
| LNC / Lincoln National Corporation | 0,00 | −100,00 | 0,00 | −100,00 | −0,9405 | ||||
| Advanta Corp. / (007942105) | 0,01 | 0,00 | 0,00 | 0,0000 |