Grundläggande statistik
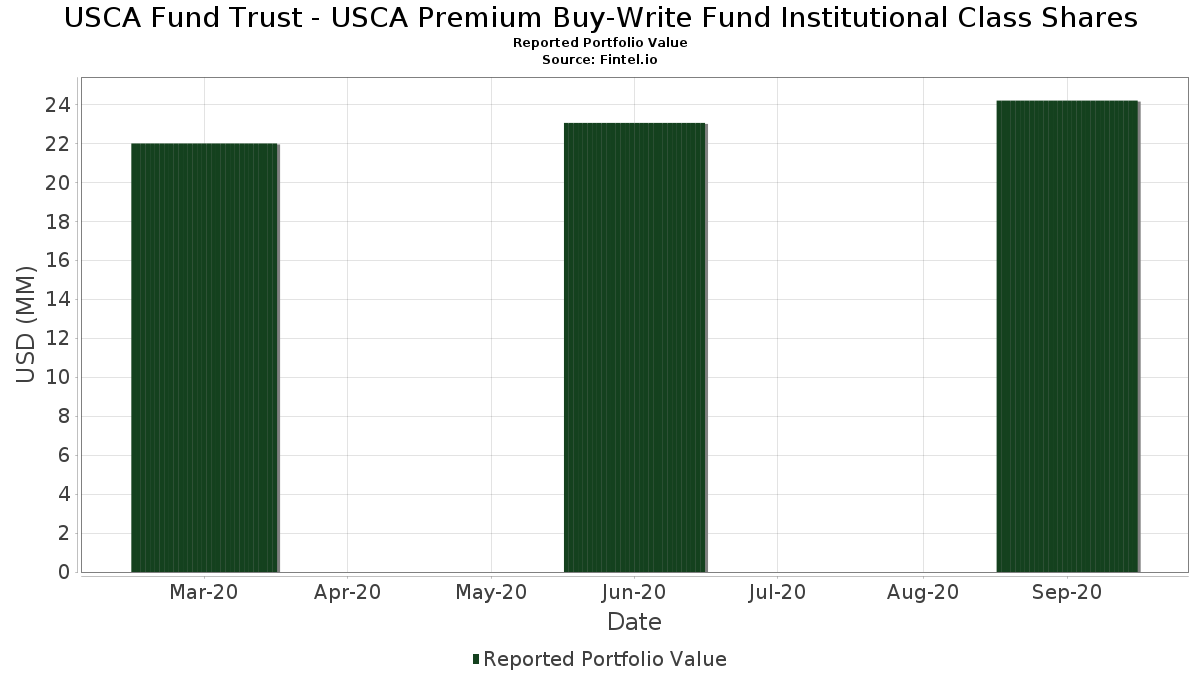
| Portföljvärde | $ 24 192 290 |
| Aktuella positioner | 166 |
Senaste innehav, resultat, förvaltat kapital (från 13F, 13D)
USCA Fund Trust - USCA Premium Buy-Write Fund Institutional Class Shares har redovisat 166 totala innehav i sina senaste SEC-arkiveringar. Det senaste portföljvärdet beräknas vara $ 24 192 290 USD. Faktiskt förvaltade tillgångar (AUM) är detta värde plus likvida medel (som inte redovisas). USCA Fund Trust - USCA Premium Buy-Write Fund Institutional Class Sharess största innehav är First American Funds Inc - First American Treasury Obligations Fund Class X (US:FXFXX) , Verizon Communications Inc. (US:VZ) , SPDR Gold Trust (US:GLD) , Microsoft Corporation (US:MSFT) , and Newmont Corporation (US:NEM) . USCA Fund Trust - USCA Premium Buy-Write Fund Institutional Class Sharess nya positioner inkluderar Crown Castle Inc. (US:CCI) , UnitedHealth Group Incorporated (US:UNH) , Digital Realty Trust, Inc. (US:DLR) , Prologis, Inc. (US:PLD) , and D.R. Horton, Inc. (US:DHI) .
Största ökningarna detta kvartal
Vi använder förändringen i portföljallokeringen eftersom det är det mest meningsfulla måttet. Förändringar kan bero på transaktioner eller förändringar i aktiekurser.
| Värdepapper | Aktier (MM) |
Värde (MM$) |
Portfölj % av | ΔPortfölj % av |
|---|---|---|---|---|
| 3,13 | 3,13 | 13,0080 | 2,4528 | |
| 0,00 | 0,38 | 1,5897 | 1,5897 | |
| 0,00 | 0,37 | 1,5530 | 1,5530 | |
| 0,00 | 0,37 | 1,5230 | 1,5230 | |
| 0,00 | 0,35 | 1,4619 | 1,4619 | |
| 0,00 | 0,45 | 1,8574 | 1,3075 | |
| 0,00 | 0,61 | 2,5348 | 0,9688 | |
| 0,00 | 0,23 | 0,9418 | 0,9418 | |
| 0,00 | 0,61 | 2,5362 | 0,9027 | |
| 0,00 | 0,36 | 1,5013 | 0,5927 |
Största minskningarna detta kvartal
Vi använder förändringen i portföljallokeringen eftersom det är det mest meningsfulla måttet. Förändringar kan bero på transaktioner eller förändringar i aktiepriser.
| Värdepapper | Aktier (MM) |
Värde (MM$) |
Portfölj % av | ΔPortfölj % av |
|---|---|---|---|---|
| 0,00 | 0,00 | −1,7310 | ||
| 0,00 | 0,00 | −1,4115 | ||
| 0,00 | 0,24 | 1,0011 | −1,2993 | |
| 0,00 | 0,21 | 0,8654 | −1,2136 | |
| 0,00 | 0,20 | 0,8485 | −1,1285 | |
| 0,00 | 0,25 | 1,0330 | −0,9839 | |
| 0,00 | 0,00 | −0,9763 | ||
| 0,00 | 0,17 | 0,7103 | −0,8634 | |
| 0,00 | 0,00 | −0,7972 | ||
| 0,00 | 0,13 | 0,5220 | −0,6970 |
13F- och fond arkiveringar
Denna blankett lämnades in den 2020-11-24 för rapporteringsperioden 2020-09-30. Klicka på länksymbolen för att se hela transaktionshistoriken.
Uppgradera för att låsa upp premiumdata och exportera till Excel![]() .
.
| Värdepapper | Typ | Genomsnittligt aktiepris | Aktier (MM) |
ΔAktier (%) |
ΔAktier (%) |
Värde ($MM) |
Portfölj (%) |
ΔPortfölj (%) |
|
|---|---|---|---|---|---|---|---|---|---|
| FXFXX / First American Funds Inc - First American Treasury Obligations Fund Class X | 3,13 | 29,05 | 3,13 | 29,04 | 13,0080 | 2,4528 | |||
| VZ / Verizon Communications Inc. | 0,01 | 0,00 | 0,71 | 7,87 | 2,9634 | 0,0876 | |||
| GLD / SPDR Gold Trust | 0,00 | −11,11 | 0,71 | −5,98 | 2,9410 | −0,3330 | |||
| MSFT / Microsoft Corporation | 0,00 | −5,71 | 0,69 | −2,53 | 2,8812 | −0,2150 | |||
| NEM / Newmont Corporation | 0,01 | 0,00 | 0,63 | 2,76 | 2,6339 | −0,0499 | |||
| WMT / Walmart Inc. | 0,00 | −10,00 | 0,63 | 5,18 | 2,6135 | 0,0101 | |||
| FNV / Franco-Nevada Corporation | 0,00 | 0,00 | 0,63 | 0,00 | 2,6074 | −0,1242 | |||
| HD / The Home Depot, Inc. | 0,00 | 46,67 | 0,61 | 62,67 | 2,5362 | 0,9027 | |||
| NEE / NextEra Energy, Inc. | 0,00 | 46,67 | 0,61 | 69,44 | 2,5348 | 0,9688 | |||
| JNJ / Johnson & Johnson | 0,00 | 0,00 | 0,60 | 5,87 | 2,4721 | 0,0268 | |||
| TLT / iShares Trust - iShares 20+ Year Treasury Bond ETF | 0,00 | −12,50 | 0,57 | −12,82 | 2,3720 | −0,4784 | |||
| CMCSA / Comcast Corporation | 0,01 | −14,29 | 0,56 | 1,83 | 2,3044 | −0,0679 | |||
| COST / Costco Wholesale Corporation | 0,00 | 0,00 | 0,53 | 17,18 | 2,2105 | 0,2334 | |||
| DUK / Duke Energy Corporation | 0,01 | 0,00 | 0,53 | 10,86 | 2,2057 | 0,1221 | |||
| INTC / Intel Corporation | 0,01 | 0,00 | 0,52 | −13,55 | 2,1494 | −0,4513 | |||
| CSCO / Cisco Systems, Inc. | 0,01 | 0,00 | 0,51 | −15,51 | 2,1257 | −0,5100 | |||
| AMGN / Amgen Inc. | 0,00 | 0,00 | 0,51 | 7,86 | 2,1101 | 0,0595 | |||
| B / Barrick Mining Corporation | 0,02 | 5,88 | 0,51 | 10,50 | 2,1004 | 0,1096 | |||
| TGT / Target Corporation | 0,00 | −20,00 | 0,50 | 5,01 | 2,0911 | 0,0058 | |||
| V / Visa Inc. | 0,00 | 0,00 | 0,50 | 3,53 | 2,0752 | −0,0240 | |||
| TSM / Taiwan Semiconductor Manufacturing Company Limited - Depositary Receipt (Common Stock) | 0,01 | 0,00 | 0,49 | 42,94 | 2,0192 | 0,5385 | |||
| CAT / Caterpillar Inc. | 0,00 | 200,00 | 0,45 | 254,76 | 1,8574 | 1,3075 | |||
| PEP / PepsiCo, Inc. | 0,00 | 20,00 | 0,42 | 25,76 | 1,7260 | 0,2887 | |||
| PRU / Prudential Financial, Inc. | 0,01 | 30,00 | 0,41 | 35,53 | 1,7139 | 0,3903 | |||
| CCI / Crown Castle Inc. | 0,00 | 0,38 | 1,5897 | 1,5897 | |||||
| UNH / UnitedHealth Group Incorporated | 0,00 | 0,37 | 1,5530 | 1,5530 | |||||
| TXN / Texas Instruments Incorporated | 0,00 | −13,33 | 0,37 | −2,37 | 1,5411 | −0,1147 | |||
| DLR / Digital Realty Trust, Inc. | 0,00 | 0,37 | 1,5230 | 1,5230 | |||||
| ATVI / Activision Blizzard Inc | 0,00 | 12,50 | 0,36 | 20,13 | 1,5121 | 0,1924 | |||
| KSU / Kansas City Southern | 0,00 | 42,86 | 0,36 | 72,73 | 1,5013 | 0,5927 | |||
| EMR / Emerson Electric Co. | 0,01 | 37,50 | 0,36 | 45,16 | 1,4970 | 0,4185 | |||
| KDP / Keurig Dr Pepper Inc. | 0,01 | 62,50 | 0,36 | 57,71 | 1,4894 | 0,5018 | |||
| ORCL / Oracle Corporation | 0,01 | −25,00 | 0,36 | −19,00 | 1,4869 | −0,4351 | |||
| PLD / Prologis, Inc. | 0,00 | 0,35 | 1,4619 | 1,4619 | |||||
| NKE / NIKE, Inc. | 0,00 | −28,57 | 0,31 | −8,75 | 1,3028 | −0,1889 | |||
| BAC / Bank of America Corporation | 0,01 | −15,38 | 0,26 | −14,29 | 1,1000 | −0,2421 | |||
| NVS / Novartis AG - Depositary Receipt (Common Stock) | 0,00 | −25,00 | 0,26 | −25,50 | 1,0829 | −0,4357 | |||
| WBA / Walgreens Boots Alliance, Inc. | 0,01 | 0,00 | 0,25 | −15,20 | 1,0438 | −0,2461 | |||
| MRK / Merck & Co., Inc. | 0,00 | −50,00 | 0,25 | −46,44 | 1,0330 | −0,9839 | |||
| DIS / The Walt Disney Company | 0,00 | 0,00 | 0,25 | 11,21 | 1,0301 | 0,0607 | |||
| BMY / Bristol-Myers Squibb Company | 0,00 | −55,56 | 0,24 | −54,44 | 1,0011 | −1,2993 | |||
| AMAT / Applied Materials, Inc. | 0,00 | −11,11 | 0,24 | −12,87 | 0,9871 | −0,1953 | |||
| C / Citigroup Inc. | 0,01 | 22,22 | 0,24 | 3,49 | 0,9842 | −0,0153 | |||
| CL / Colgate-Palmolive Company | 0,00 | −40,00 | 0,23 | −36,89 | 0,9608 | −0,6315 | |||
| RTX / RTX Corporation | 0,00 | −20,00 | 0,23 | −25,32 | 0,9554 | −0,3839 | |||
| DHI / D.R. Horton, Inc. | 0,00 | 0,23 | 0,9418 | 0,9418 | |||||
| KMB / Kimberly-Clark Corporation | 0,00 | −40,00 | 0,22 | −37,39 | 0,9194 | −0,6167 | |||
| EOG / EOG Resources, Inc. | 0,01 | 20,00 | 0,22 | −15,02 | 0,8951 | −0,2059 | |||
| PG / The Procter & Gamble Company | 0,00 | −62,50 | 0,21 | −56,49 | 0,8654 | −1,2136 | |||
| CVS / CVS Health Corporation | 0,00 | −50,00 | 0,20 | −55,07 | 0,8485 | −1,1285 | |||
| JPM / JPMorgan Chase & Co. | 0,00 | −42,86 | 0,19 | −41,64 | 0,7993 | −0,6318 | |||
| KMI / Kinder Morgan, Inc. | 0,01 | 0,00 | 0,18 | −18,94 | 0,7677 | −0,2214 | |||
| HRL / Hormel Foods Corporation | 0,00 | −53,33 | 0,17 | −52,76 | 0,7103 | −0,8634 | |||
| CTXS / Citrix Systems, Inc. | 0,00 | 0,14 | 0,5716 | 0,5716 | |||||
| LHX / L3Harris Technologies, Inc. | 0,00 | 0,00 | 0,14 | 0,00 | 0,5640 | −0,0260 | |||
| FDX / FedEx Corporation | 0,00 | −75,00 | 0,13 | −55,36 | 0,5220 | −0,6970 | |||
| ALB / Albemarle Corporation | 0,00 | 0,12 | 0,5189 | 0,5189 | |||||
| FCX / Freeport-McMoRan Inc. | 0,01 | 0,11 | 0,4545 | 0,4545 | |||||
| CVX / Chevron Corporation | 0,00 | 0,10 | 0,4184 | 0,4184 | |||||
| RDS.A / Shell Plc - ADR (Representing Ordinary Shares - Class A) | 0,00 | 0,00 | 0,06 | −22,54 | 0,2299 | −0,0828 | |||
| WY / Weyerhaeuser Company | 0,00 | −100,00 | 0,00 | −100,00 | −0,9763 | ||||
| D / Dominion Energy, Inc. | 0,00 | −100,00 | 0,00 | −100,00 | −1,4115 | ||||
| AEP / American Electric Power Company, Inc. | 0,00 | −100,00 | 0,00 | −100,00 | −1,7310 | ||||
| MDT / Medtronic plc | 0,00 | −100,00 | 0,00 | −100,00 | −0,7972 | ||||
| EOG Resources Inc / DE (N/A) | −0,00 | −0,0003 | −0,0003 | ||||||
| SPDR Gold Shares / DE (N/A) | −0,00 | −0,0003 | −0,0003 | ||||||
| Newmont Corp / DE (N/A) | −0,00 | −0,0006 | −0,0006 | ||||||
| Royal Dutch Shell PLC / DE (N/A) | −0,00 | −0,0009 | −0,0009 | ||||||
| SPDR Gold Shares / DE (N/A) | −0,00 | −0,0017 | −0,0017 | ||||||
| SPDR Gold Shares / DE (N/A) | −0,00 | −0,0017 | −0,0017 | ||||||
| JPMorgan Chase & Co / DE (N/A) | −0,00 | −0,0025 | −0,0025 | ||||||
| JPMorgan Chase & Co / DE (N/A) | −0,00 | −0,0025 | −0,0025 | ||||||
| Bank of America Corp / DE (N/A) | −0,00 | −0,0027 | −0,0027 | ||||||
| Bank of America Corp / DE (N/A) | −0,00 | −0,0027 | −0,0027 | ||||||
| Kinder Morgan Inc / DE (N/A) | −0,00 | −0,0034 | −0,0034 | ||||||
| Chevron Corp / DE (N/A) | −0,00 | −0,0036 | −0,0036 | ||||||
| Taiwan Semiconductor Manufacturing Co Ltd / DE (N/A) | −0,00 | −0,0044 | −0,0044 | ||||||
| Novartis AG / DE (N/A) | −0,00 | −0,0047 | −0,0047 | ||||||
| Barrick Gold Corp / DE (N/A) | −0,00 | −0,0047 | −0,0047 | ||||||
| Citrix Systems Inc / DE (N/A) | −0,00 | −0,0048 | −0,0048 | ||||||
| L3Harris Technologies Inc / DE (N/A) | −0,00 | −0,0049 | −0,0049 | ||||||
| EOG Resources Inc / DE (N/A) | −0,00 | −0,0052 | −0,0052 | ||||||
| EOG Resources Inc / DE (N/A) | −0,00 | −0,0052 | −0,0052 | ||||||
| Activision Blizzard Inc / DE (N/A) | −0,00 | −0,0060 | −0,0060 | ||||||
| Activision Blizzard Inc / DE (N/A) | −0,00 | −0,0060 | −0,0060 | ||||||
| Hormel Foods Corp / DE (N/A) | −0,00 | −0,0065 | −0,0065 | ||||||
| Walt Disney Co/The / DE (N/A) | −0,00 | −0,0073 | −0,0073 | ||||||
| Caterpillar Inc / DE (N/A) | −0,00 | −0,0076 | −0,0076 | ||||||
| Caterpillar Inc / DE (N/A) | −0,00 | −0,0076 | −0,0076 | ||||||
| Keurig Dr Pepper Inc / DE (N/A) | −0,00 | −0,0079 | −0,0079 | ||||||
| Keurig Dr Pepper Inc / DE (N/A) | −0,00 | −0,0079 | −0,0079 | ||||||
| Emerson Electric Co / DE (N/A) | −0,00 | −0,0082 | −0,0082 | ||||||
| Emerson Electric Co / DE (N/A) | −0,00 | −0,0086 | −0,0086 | ||||||
| Emerson Electric Co / DE (N/A) | −0,00 | −0,0086 | −0,0086 | ||||||
| Kimberly-Clark Corp / DE (N/A) | −0,00 | −0,0093 | −0,0093 | ||||||
| Cisco Systems Inc / DE (N/A) | −0,00 | −0,0101 | −0,0101 | ||||||
| Cisco Systems Inc / DE (N/A) | −0,00 | −0,0101 | −0,0101 | ||||||
| UnitedHealth Group Inc / DE (N/A) | −0,00 | −0,0104 | −0,0104 | ||||||
| UnitedHealth Group Inc / DE (N/A) | −0,00 | −0,0104 | −0,0104 | ||||||
| Verizon Communications Inc / DE (N/A) | −0,00 | −0,0108 | −0,0108 | ||||||
| Verizon Communications Inc / DE (N/A) | −0,00 | −0,0108 | −0,0108 | ||||||
| iShares 20+ Year Treasury Bond ETF / DE (N/A) | −0,00 | −0,0108 | −0,0108 | ||||||
| iShares 20+ Year Treasury Bond ETF / DE (N/A) | −0,00 | −0,0108 | −0,0108 | ||||||
| Prologis Inc / DE (N/A) | −0,00 | −0,0113 | −0,0113 | ||||||
| Prologis Inc / DE (N/A) | −0,00 | −0,0113 | −0,0113 | ||||||
| Crown Castle International Corp / DE (N/A) | −0,00 | −0,0118 | −0,0118 | ||||||
| Crown Castle International Corp / DE (N/A) | −0,00 | −0,0118 | −0,0118 | ||||||
| NextEra Energy Inc / DE (N/A) | −0,00 | −0,0133 | −0,0133 | ||||||
| NextEra Energy Inc / DE (N/A) | −0,00 | −0,0133 | −0,0133 | ||||||
| Freeport-McMoRan Inc / DE (N/A) | −0,00 | −0,0137 | −0,0137 | ||||||
| Intel Corp / DE (N/A) | −0,00 | −0,0150 | −0,0150 | ||||||
| Caterpillar Inc / DE (N/A) | −0,00 | −0,0153 | −0,0153 | ||||||
| Taiwan Semiconductor Manufacturing Co Ltd / DE (N/A) | −0,00 | −0,0157 | −0,0157 | ||||||
| Taiwan Semiconductor Manufacturing Co Ltd / DE (N/A) | −0,00 | −0,0157 | −0,0157 | ||||||
| Walmart Inc / DE (N/A) | −0,00 | −0,0158 | −0,0158 | ||||||
| Prudential Financial Inc / DE (N/A) | −0,00 | −0,0163 | −0,0163 | ||||||
| Raytheon Technologies Corp / DE (N/A) | −0,00 | −0,0165 | −0,0165 | ||||||
| CVS Health Corp / DE (N/A) | −0,00 | −0,0166 | −0,0166 | ||||||
| Kansas City Southern / DE (N/A) | −0,00 | −0,0171 | −0,0171 | ||||||
| Kansas City Southern / DE (N/A) | −0,00 | −0,0171 | −0,0171 | ||||||
| Bristol-Myers Squibb Co / DE (N/A) | −0,00 | −0,0187 | −0,0187 | ||||||
| Bristol-Myers Squibb Co / DE (N/A) | −0,00 | −0,0187 | −0,0187 | ||||||
| Newmont Corp / DE (N/A) | −0,00 | −0,0197 | −0,0197 | ||||||
| Newmont Corp / DE (N/A) | −0,00 | −0,0197 | −0,0197 | ||||||
| Crown Castle International Corp / DE (N/A) | −0,00 | −0,0199 | −0,0199 | ||||||
| Cisco Systems Inc / DE (N/A) | −0,00 | −0,0202 | −0,0202 | ||||||
| Intel Corp / DE (N/A) | −0,00 | −0,0204 | −0,0204 | ||||||
| Intel Corp / DE (N/A) | −0,00 | −0,0204 | −0,0204 | ||||||
| Merck & Co Inc / DE (N/A) | −0,01 | −0,0214 | −0,0214 | ||||||
| Walgreens Boots Alliance Inc / DE (N/A) | −0,01 | −0,0228 | −0,0228 | ||||||
| Prudential Financial Inc / DE (N/A) | −0,01 | −0,0235 | −0,0235 | ||||||
| Prudential Financial Inc / DE (N/A) | −0,01 | −0,0235 | −0,0235 | ||||||
| Digital Realty Trust Inc / DE (N/A) | −0,01 | −0,0240 | −0,0240 | ||||||
| Digital Realty Trust Inc / DE (N/A) | −0,01 | −0,0240 | −0,0240 | ||||||
| Franco-Nevada Corp / DE (N/A) | −0,01 | −0,0241 | −0,0241 | ||||||
| Franco-Nevada Corp / DE (N/A) | −0,01 | −0,0241 | −0,0241 | ||||||
| Citigroup Inc / DE (N/A) | −0,01 | −0,0249 | −0,0249 | ||||||
| Procter & Gamble Co/The / DE (N/A) | −0,01 | −0,0265 | −0,0265 | ||||||
| Visa Inc / DE (N/A) | −0,01 | −0,0281 | −0,0281 | ||||||
| Visa Inc / DE (N/A) | −0,01 | −0,0281 | −0,0281 | ||||||
| Microsoft Corp / DE (N/A) | −0,01 | −0,0296 | −0,0296 | ||||||
| Microsoft Corp / DE (N/A) | −0,01 | −0,0296 | −0,0296 | ||||||
| Colgate-Palmolive Co / DE (N/A) | −0,01 | −0,0305 | −0,0305 | ||||||
| Duke Energy Corp / DE (N/A) | −0,01 | −0,0311 | −0,0311 | ||||||
| Duke Energy Corp / DE (N/A) | −0,01 | −0,0311 | −0,0311 | ||||||
| Albemarle Corp / DE (N/A) | −0,01 | −0,0317 | −0,0317 | ||||||
| Home Depot Inc/The / DE (N/A) | −0,01 | −0,0325 | −0,0325 | ||||||
| Home Depot Inc/The / DE (N/A) | −0,01 | −0,0325 | −0,0325 | ||||||
| NextEra Energy Inc / DE (N/A) | −0,01 | −0,0329 | −0,0329 | ||||||
| Amgen Inc / DE (N/A) | −0,01 | −0,0339 | −0,0339 | ||||||
| Amgen Inc / DE (N/A) | −0,01 | −0,0339 | −0,0339 | ||||||
| Oracle Corp / DE (N/A) | −0,01 | −0,0346 | −0,0346 | ||||||
| Home Depot Inc/The / DE (N/A) | −0,01 | −0,0363 | −0,0363 | ||||||
| Barrick Gold Corp / DE (N/A) | −0,01 | −0,0368 | −0,0368 | ||||||
| Barrick Gold Corp / DE (N/A) | −0,01 | −0,0368 | −0,0368 | ||||||
| Comcast Corp / DE (N/A) | −0,01 | −0,0443 | −0,0443 | ||||||
| Comcast Corp / DE (N/A) | −0,01 | −0,0443 | −0,0443 | ||||||
| Walmart Inc / DE (N/A) | −0,01 | −0,0509 | −0,0509 | ||||||
| Walmart Inc / DE (N/A) | −0,01 | −0,0509 | −0,0509 | ||||||
| DR Horton Inc / DE (N/A) | −0,01 | −0,0554 | −0,0554 | ||||||
| Texas Instruments Inc / DE (N/A) | −0,01 | −0,0556 | −0,0556 | ||||||
| PepsiCo Inc / DE (N/A) | −0,01 | −0,0564 | −0,0564 | ||||||
| Johnson & Johnson / DE (N/A) | −0,02 | −0,0797 | −0,0797 | ||||||
| NIKE Inc / DE (N/A) | −0,02 | −0,0811 | −0,0811 | ||||||
| NIKE Inc / DE (N/A) | −0,02 | −0,0811 | −0,0811 | ||||||
| Target Corp / DE (N/A) | −0,02 | −0,0847 | −0,0847 | ||||||
| Target Corp / DE (N/A) | −0,02 | −0,0847 | −0,0847 | ||||||
| Applied Materials Inc / DE (N/A) | −0,02 | −0,0851 | −0,0851 | ||||||
| Costco Wholesale Corp / DE (N/A) | −0,03 | −0,1048 | −0,1048 | ||||||
| FedEx Corp / DE (N/A) | −0,03 | −0,1060 | −0,1060 |