Grundläggande statistik
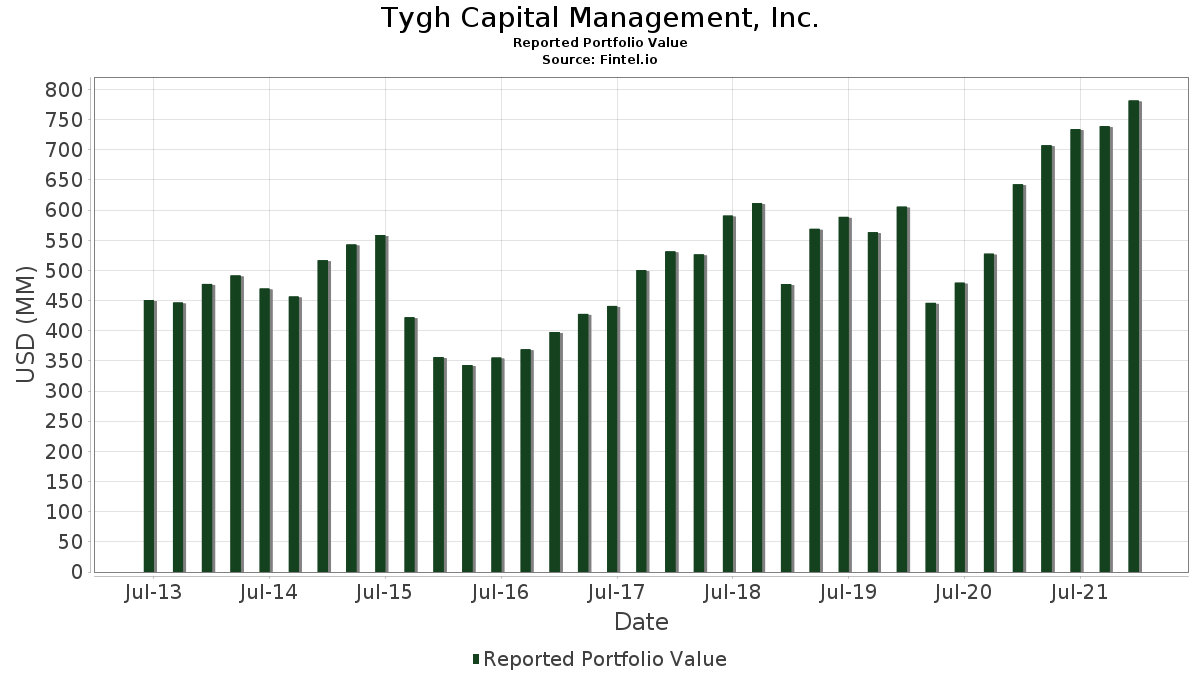
| Portföljvärde | $ 781 588 000 |
| Aktuella positioner | 87 |
Senaste innehav, resultat, förvaltat kapital (från 13F, 13D)
Tygh Capital Management, Inc. har redovisat 87 totala innehav i sina senaste SEC-arkiveringar. Det senaste portföljvärdet beräknas vara $ 781 588 000 USD. Faktiskt förvaltade tillgångar (AUM) är detta värde plus likvida medel (som inte redovisas). Tygh Capital Management, Inc.s största innehav är WillScot Holdings Corporation (US:WSC) , ASGN Incorporated (US:ASGN) , Onto Innovation Inc. (US:ONTO) , Champion Homes, Inc. (US:SKY) , and Cavco Industries, Inc. (US:CVCO) . Tygh Capital Management, Inc.s nya positioner inkluderar HA Sustainable Infrastructure Capital, Inc. (US:HASI) , Kontoor Brands, Inc. (US:KTB) , Shake Shack Inc. (US:SHAK) , Axonics, Inc. (US:AXNX) , and Crocs, Inc. (US:CROX) .
Största ökningarna detta kvartal
Vi använder förändringen i portföljallokeringen eftersom det är det mest meningsfulla måttet. Förändringar kan bero på transaktioner eller förändringar i aktiekurser.
| Värdepapper | Aktier (MM) |
Värde (MM$) |
Portfölj % av | ΔPortfölj % av |
|---|---|---|---|---|
| 0,27 | 12,06 | 1,5437 | 1,5437 | |
| 0,20 | 10,67 | 1,3653 | 1,3653 | |
| 0,18 | 9,12 | 1,1675 | 1,1675 | |
| 0,33 | 12,74 | 1,6307 | 0,9044 | |
| 0,14 | 16,61 | 2,1248 | 0,8670 | |
| 0,42 | 6,58 | 0,8415 | 0,8415 | |
| 0,09 | 12,22 | 1,5634 | 0,8013 | |
| 0,10 | 6,16 | 0,7887 | 0,7887 | |
| 0,08 | 6,00 | 0,7678 | 0,7678 | |
| 0,11 | 5,90 | 0,7554 | 0,7554 |
Största minskningarna detta kvartal
Vi använder förändringen i portföljallokeringen eftersom det är det mest meningsfulla måttet. Förändringar kan bero på transaktioner eller förändringar i aktiepriser.
| Värdepapper | Aktier (MM) |
Värde (MM$) |
Portfölj % av | ΔPortfölj % av |
|---|---|---|---|---|
| 0,00 | 0,00 | −1,4742 | ||
| 0,01 | 0,59 | 0,0752 | −1,1877 | |
| 0,00 | 0,00 | −1,0422 | ||
| 0,00 | 0,00 | −1,0268 | ||
| 0,00 | 0,00 | −1,0129 | ||
| 0,00 | 0,00 | −0,9142 | ||
| 0,07 | 5,95 | 0,7614 | −0,9038 | |
| 0,01 | 0,88 | 0,1126 | −0,8893 | |
| 0,13 | 14,37 | 1,8389 | −0,8755 | |
| 0,07 | 6,08 | 0,7784 | −0,8673 |
13F- och fond arkiveringar
Denna blankett lämnades in den 2022-02-10 för rapporteringsperioden 2021-12-31. Klicka på länksymbolen för att se hela transaktionshistoriken.
Uppgradera för att låsa upp premiumdata och exportera till Excel![]() .
.
| Värdepapper | Typ | Genomsnittligt aktiepris | Aktier (MM) |
ΔAktier (%) |
ΔAktier (%) |
Värde ($MM) |
Portfölj (%) |
ΔPortfölj (%) |
|
|---|---|---|---|---|---|---|---|---|---|
| WSC / WillScot Holdings Corporation | 0,63 | 4,78 | 25,70 | 34,91 | 3,2878 | 0,7106 | |||
| ASGN / ASGN Incorporated | 0,18 | 0,47 | 21,65 | 9,59 | 2,7705 | 0,0970 | |||
| ONTO / Onto Innovation Inc. | 0,21 | −7,46 | 21,00 | 29,66 | 2,6875 | 0,4956 | |||
| SKY / Champion Homes, Inc. | 0,25 | 0,89 | 20,09 | 32,67 | 2,5702 | 0,5216 | |||
| CVCO / Cavco Industries, Inc. | 0,06 | 0,91 | 19,89 | 35,41 | 2,5452 | 0,5575 | |||
| PLNT / Planet Fitness, Inc. | 0,21 | 28,62 | 18,86 | 48,32 | 2,4130 | 0,6925 | |||
| ICLR / ICON Public Limited Company | 0,06 | −30,70 | 18,84 | −18,10 | 2,4106 | −0,7019 | |||
| FOCS / Focus Financial Partners Inc - Class A | 0,29 | 26,47 | 17,19 | 44,22 | 2,1994 | 0,5867 | |||
| FN / Fabrinet | 0,14 | 54,58 | 16,61 | 78,65 | 2,1248 | 0,8670 | |||
| G / Genpact Limited | 0,31 | 46,61 | 16,48 | 63,80 | 2,1092 | 0,7475 | |||
| RPD / Rapid7, Inc. | 0,14 | 0,88 | 16,11 | 5,05 | 2,0605 | −0,0138 | |||
| TSEM / Tower Semiconductor Ltd. | 0,40 | 10,94 | 15,78 | 47,22 | 2,0192 | 0,5688 | |||
| LFUS / Littelfuse, Inc. | 0,05 | 39,01 | 15,68 | 60,08 | 2,0059 | 0,6808 | |||
| TFII / TFI International Inc. | 0,14 | 29,55 | 15,15 | 42,14 | 1,9385 | 0,4963 | |||
| GTLS / Chart Industries, Inc. | 0,09 | 33,51 | 14,43 | 11,42 | 1,8460 | 0,0940 | |||
| WAL / Western Alliance Bancorporation | 0,13 | −27,58 | 14,37 | −28,36 | 1,8389 | −0,8755 | |||
| SHYF / The Shyft Group, Inc. | 0,28 | 0,69 | 13,56 | 30,15 | 1,7348 | 0,3252 | |||
| CLH / Clean Harbors, Inc. | 0,13 | 0,99 | 13,30 | −3,00 | 1,7012 | −0,1534 | |||
| COHU / Cohu, Inc. | 0,33 | 99,09 | 12,74 | 137,43 | 1,6307 | 0,9044 | |||
| EXLS / ExlService Holdings, Inc. | 0,09 | 0,67 | 12,55 | 18,37 | 1,6061 | 0,1712 | |||
| CMCO / Columbus McKinnon Corporation | 0,27 | 12,99 | 12,29 | 8,11 | 1,5724 | 0,0343 | |||
| VIAV / Viavi Solutions Inc. | 0,69 | 0,67 | 12,24 | 12,69 | 1,5664 | 0,0965 | |||
| LHCG / LHC Group Inc | 0,09 | 148,06 | 12,22 | 116,96 | 1,5634 | 0,8013 | |||
| GOOS / Canada Goose Holdings Inc. | 0,33 | 27,69 | 12,13 | 32,66 | 1,5522 | 0,3149 | |||
| CACI / CACI International Inc | 0,05 | 49,68 | 12,13 | 53,75 | 1,5517 | 0,4845 | |||
| HEES / H&E Equipment Services, Inc. | 0,27 | 12,06 | 1,5437 | 1,5437 | |||||
| THRM / Gentherm Incorporated | 0,14 | 89,09 | 12,04 | 103,05 | 1,5406 | 0,7382 | |||
| SPR / Spirit AeroSystems Holdings, Inc. | 0,26 | 15,98 | 11,39 | 13,09 | 1,4568 | 0,0946 | |||
| PCRX / Pacira BioSciences, Inc. | 0,18 | 17,23 | 10,89 | 25,96 | 1,3938 | 0,2236 | |||
| ESI / Element Solutions Inc | 0,44 | 23,09 | 10,68 | 37,85 | 1,3658 | 0,3180 | |||
| HASI / HA Sustainable Infrastructure Capital, Inc. | 0,20 | 10,67 | 1,3653 | 1,3653 | |||||
| WNS / WNS (Holdings) Limited | 0,12 | 0,69 | 10,52 | 8,59 | 1,3456 | 0,0352 | |||
| INDI / indie Semiconductor, Inc. | 0,86 | 89,87 | 10,35 | 84,95 | 1,3240 | 0,5670 | |||
| KNSL / Kinsale Capital Group, Inc. | 0,04 | 0,69 | 9,93 | 48,13 | 1,2704 | 0,3634 | |||
| LQDT / Liquidity Services, Inc. | 0,45 | −6,53 | 9,92 | −4,50 | 1,2688 | −0,1361 | |||
| ASPN / Aspen Aerogels, Inc. | 0,20 | −20,18 | 9,87 | −13,63 | 1,2628 | −0,2833 | |||
| NTRA / Natera, Inc. | 0,11 | 6,91 | 9,85 | −10,40 | 1,2599 | −0,2271 | |||
| PGNY / Progyny, Inc. | 0,19 | 24,64 | 9,72 | 12,06 | 1,2439 | 0,0700 | |||
| KTB / Kontoor Brands, Inc. | 0,18 | 9,12 | 1,1675 | 1,1675 | |||||
| TECH / Bio-Techne Corporation | 0,02 | 18,22 | 9,06 | 26,22 | 1,1597 | 0,1881 | |||
| XBI / SPDR Series Trust - SPDR S&P Biotech ETF | 0,08 | 0,41 | 8,96 | −10,57 | 1,1464 | −0,2092 | |||
| KLIC / Kulicke and Soffa Industries, Inc. | 0,14 | −18,89 | 8,77 | −15,75 | 1,1226 | −0,2864 | |||
| SITM / SiTime Corporation | 0,03 | −47,11 | 8,69 | −24,22 | 1,1121 | −0,4398 | |||
| MMS / Maximus, Inc. | 0,11 | 23,67 | 8,65 | 18,42 | 1,1065 | 0,1184 | |||
| DIOD / Diodes Incorporated | 0,08 | −30,28 | 8,34 | −15,48 | 1,0676 | −0,2681 | |||
| PWR / Quanta Services, Inc. | 0,07 | 0,68 | 8,24 | 1,43 | 1,0544 | −0,0449 | |||
| MKSI / MKS Inc. | 0,04 | 0,69 | 7,73 | 16,21 | 0,9895 | 0,0891 | |||
| TXRH / Texas Roadhouse, Inc. | 0,08 | −0,22 | 7,54 | −2,46 | 0,9644 | −0,0812 | |||
| OOMA / Ooma, Inc. | 0,37 | −14,79 | 7,51 | −6,41 | 0,9606 | −0,1248 | |||
| BL / BlackLine, Inc. | 0,07 | −32,85 | 7,05 | −41,11 | 0,9021 | −0,7180 | |||
| STRL / Sterling Infrastructure, Inc. | 0,25 | −31,13 | 6,66 | −20,09 | 0,8522 | −0,2756 | |||
| LIND / Lindblad Expeditions Holdings, Inc. | 0,42 | 6,58 | 0,8415 | 0,8415 | |||||
| MODV / ModivCare Inc. | 0,04 | 5,00 | 6,57 | −14,28 | 0,8410 | −0,1965 | |||
| TREX / Trex Company, Inc. | 0,05 | −25,28 | 6,55 | −1,01 | 0,8375 | −0,0572 | |||
| LMAT / LeMaitre Vascular, Inc. | 0,13 | 0,68 | 6,33 | −4,75 | 0,8104 | −0,0894 | |||
| IOSP / Innospec Inc. | 0,07 | −44,64 | 6,25 | −40,61 | 0,8000 | −0,6246 | |||
| KEX / Kirby Corporation | 0,10 | 6,16 | 0,7887 | 0,7887 | |||||
| UIHC / American Coastal Insurance Corp | 0,07 | −33,68 | 6,08 | −49,98 | 0,7784 | −0,8673 | |||
| SHAK / Shake Shack Inc. | 0,08 | 6,00 | 0,7678 | 0,7678 | |||||
| CWST / Casella Waste Systems, Inc. | 0,07 | −57,01 | 5,95 | −51,65 | 0,7614 | −0,9038 | |||
| AXNX / Axonics, Inc. | 0,11 | 5,90 | 0,7554 | 0,7554 | |||||
| LSCC / Lattice Semiconductor Corporation | 0,08 | −34,06 | 5,87 | −21,41 | 0,7514 | −0,2597 | |||
| BALY / Bally's Corporation | 0,15 | −0,20 | 5,61 | −24,24 | 0,7173 | −0,2840 | |||
| CYBR / CyberArk Software Ltd. | 0,03 | 0,69 | 5,19 | 10,55 | 0,6638 | 0,0288 | |||
| ESTA / Establishment Labs Holdings Inc. | 0,07 | 0,69 | 4,90 | −4,93 | 0,6265 | −0,0704 | |||
| CROX / Crocs, Inc. | 0,04 | 4,56 | 0,5838 | 0,5838 | |||||
| RVLV / Revolve Group, Inc. | 0,08 | −20,50 | 4,48 | −27,86 | 0,5727 | −0,2669 | |||
| ARWR / Arrowhead Pharmaceuticals, Inc. | 0,06 | 0,61 | 4,28 | 6,87 | 0,5473 | 0,0057 | |||
| BHVN / Biohaven Ltd. | 0,03 | 0,56 | 4,05 | −0,25 | 0,5177 | −0,0311 | |||
| BPMC / Blueprint Medicines Corporation | 0,04 | −0,04 | 3,85 | 4,14 | 0,4923 | −0,0076 | |||
| NTLA / Intellia Therapeutics, Inc. | 0,03 | −0,20 | 3,73 | −12,03 | 0,4779 | −0,0966 | |||
| HALO / Halozyme Therapeutics, Inc. | 0,08 | 0,64 | 3,41 | −0,53 | 0,4362 | −0,0275 | |||
| COLM / Columbia Sportswear Company | 0,03 | −67,56 | 2,92 | −67,02 | 0,3740 | −0,8253 | |||
| FATE / Fate Therapeutics, Inc. | 0,05 | −0,20 | 2,85 | −1,49 | 0,3644 | −0,0268 | |||
| DNLI / Denali Therapeutics Inc. | 0,05 | −0,20 | 2,42 | −11,78 | 0,3094 | −0,0615 | |||
| ALKS / Alkermes plc | 0,10 | −0,20 | 2,28 | −24,72 | 0,2918 | −0,1181 | |||
| TWST / Twist Bioscience Corporation | 0,03 | −0,20 | 2,16 | −27,81 | 0,2764 | −0,1285 | |||
| PTCT / PTC Therapeutics, Inc. | 0,05 | −0,22 | 1,85 | 6,82 | 0,2363 | 0,0024 | |||
| BEAM / Beam Therapeutics Inc. | 0,02 | −0,19 | 1,82 | −8,57 | 0,2335 | −0,0366 | |||
| APLS / Apellis Pharmaceuticals, Inc. | 0,04 | −0,20 | 1,77 | 43,15 | 0,2271 | 0,0593 | |||
| TGTX / TG Therapeutics, Inc. | 0,08 | −0,20 | 1,48 | −43,03 | 0,1899 | −0,1626 | |||
| CDNA / CareDx, Inc | 0,03 | −15,91 | 1,18 | −39,65 | 0,1503 | −0,1131 | |||
| IWO / iShares Trust - iShares Russell 2000 Growth ETF | 0,00 | 0,90 | 0,1153 | 0,1153 | |||||
| KALU / Kaiser Aluminum Corporation | 0,01 | −86,22 | 0,88 | −88,12 | 0,1126 | −0,8893 | |||
| BBIO / BridgeBio Pharma, Inc. | 0,04 | −0,20 | 0,71 | −64,46 | 0,0915 | −0,1807 | |||
| HQY / HealthEquity, Inc. | 0,01 | −90,77 | 0,59 | −93,70 | 0,0752 | −1,1877 | |||
| IJT / iShares Trust - iShares S&P Small-Cap 600 Growth ETF | 0,00 | 0,24 | 0,0305 | 0,0305 | |||||
| NEO / NeoGenomics, Inc. | 0,00 | −100,00 | 0,00 | −100,00 | −1,0422 | ||||
| CRL / Charles River Laboratories International, Inc. | 0,00 | −100,00 | 0,00 | −100,00 | −0,9142 | ||||
| NCNO / nCino, Inc. | 0,00 | −100,00 | 0,00 | −100,00 | −0,8483 | ||||
| PNTG / The Pennant Group, Inc. | 0,00 | −100,00 | 0,00 | −100,00 | −1,0268 | ||||
| TLS / Telos Corporation | 0,00 | −100,00 | 0,00 | −100,00 | −0,6135 | ||||
| BYRN / Byrna Technologies Inc. | 0,00 | −100,00 | 0,00 | −100,00 | −0,6781 | ||||
| DMTK / DermTech, Inc. | 0,00 | −100,00 | 0,00 | −100,00 | −0,6766 | ||||
| KTOS / Kratos Defense & Security Solutions, Inc. | 0,00 | −100,00 | 0,00 | −100,00 | −1,0129 | ||||
| CVLT / Commvault Systems, Inc. | 0,00 | −100,00 | 0,00 | −100,00 | −1,4742 | ||||
| CDLX / Cardlytics, Inc. | 0,00 | −100,00 | 0,00 | −100,00 | −0,4706 |