Grundläggande statistik
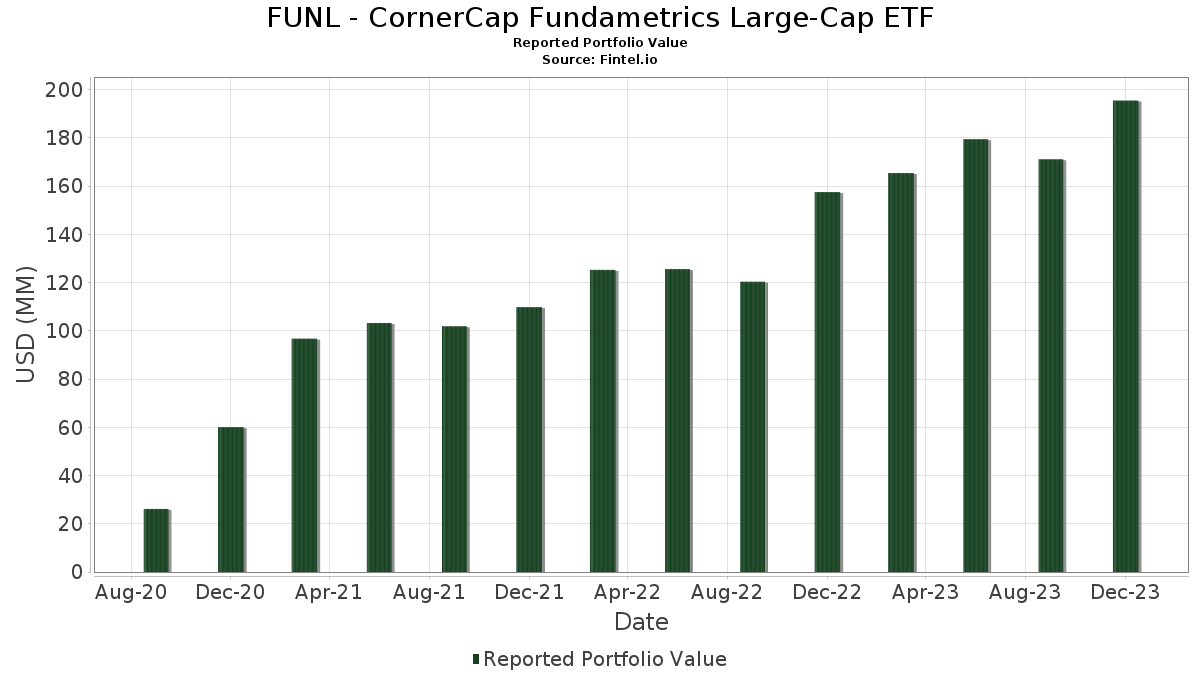
| Portföljvärde | $ 195 491 238 |
| Aktuella positioner | 152 |
Senaste innehav, resultat, förvaltat kapital (från 13F, 13D)
FUNL - CornerCap Fundametrics Large-Cap ETF har redovisat 152 totala innehav i sina senaste SEC-arkiveringar. Det senaste portföljvärdet beräknas vara $ 195 491 238 USD. Faktiskt förvaltade tillgångar (AUM) är detta värde plus likvida medel (som inte redovisas). FUNL - CornerCap Fundametrics Large-Cap ETFs största innehav är Johnson & Johnson (US:JNJ) , Chevron Corporation (US:CVX) , Meta Platforms, Inc. (US:META) , JPMorgan Chase & Co. (US:JPM) , and Cisco Systems, Inc. (US:CSCO) . FUNL - CornerCap Fundametrics Large-Cap ETFs nya positioner inkluderar Atlassian Corporation (US:TEAM) , Stanley Black & Decker, Inc. (US:SWK) , Mastercard Incorporated (US:MA) , Baker Hughes Company (US:BKR) , and Halliburton Company (US:HAL) .
Största ökningarna detta kvartal
Vi använder förändringen i portföljallokeringen eftersom det är det mest meningsfulla måttet. Förändringar kan bero på transaktioner eller förändringar i aktiekurser.
| Värdepapper | Aktier (MM) |
Värde (MM$) |
Portfölj % av | ΔPortfölj % av |
|---|---|---|---|---|
| 11,97 | 11,97 | 6,5172 | 6,1084 | |
| 0,02 | 3,32 | 1,8093 | 1,0536 | |
| 0,01 | 1,73 | 0,9412 | 0,9412 | |
| 0,00 | 1,48 | 0,8038 | 0,8038 | |
| 0,02 | 1,47 | 0,8024 | 0,8024 | |
| 0,03 | 1,42 | 0,7756 | 0,7756 | |
| 0,02 | 1,40 | 0,7640 | 0,7640 | |
| 0,00 | 1,38 | 0,7515 | 0,7515 | |
| 0,04 | 1,36 | 0,7392 | 0,7392 | |
| 0,04 | 1,31 | 0,7134 | 0,7134 |
Största minskningarna detta kvartal
Vi använder förändringen i portföljallokeringen eftersom det är det mest meningsfulla måttet. Förändringar kan bero på transaktioner eller förändringar i aktiepriser.
| Värdepapper | Aktier (MM) |
Värde (MM$) |
Portfölj % av | ΔPortfölj % av |
|---|---|---|---|---|
| 0,00 | 0,00 | −1,0134 | ||
| 0,00 | 0,05 | 0,0283 | −0,8489 | |
| 0,00 | 0,00 | −0,8139 | ||
| 0,00 | 0,00 | −0,7670 | ||
| 0,00 | 0,00 | −0,7271 | ||
| 0,00 | 0,01 | 0,0038 | −0,6392 | |
| 1,12 | 1,12 | 0,6073 | −0,6254 | |
| 0,00 | 0,62 | 0,3395 | −0,4955 | |
| 0,01 | 0,74 | 0,4017 | −0,4687 | |
| 0,00 | 0,00 | −0,4313 |
13F- och fond arkiveringar
Denna blankett lämnades in den 2024-02-29 för rapporteringsperioden 2023-12-31. Klicka på länksymbolen för att se hela transaktionshistoriken.
Uppgradera för att låsa upp premiumdata och exportera till Excel![]() .
.
| Värdepapper | Typ | Genomsnittligt aktiepris | Aktier (MM) |
ΔAktier (%) |
ΔAktier (%) |
Värde ($MM) |
Portfölj (%) |
ΔPortfölj (%) |
|
|---|---|---|---|---|---|---|---|---|---|
| Mount Vernon Liquid Assets Portfolio, LLC / STIV (N/A) | 11,97 | 361 413,83 | 11,97 | 1 708,61 | 6,5172 | 6,1084 | |||
| JNJ / Johnson & Johnson | 0,02 | 3,67 | 3,58 | 4,35 | 1,9473 | −0,1696 | |||
| CVX / Chevron Corporation | 0,02 | 207,00 | 3,32 | 171,57 | 1,8093 | 1,0536 | |||
| META / Meta Platforms, Inc. | 0,01 | 2,69 | 3,19 | 21,08 | 1,7355 | 0,1098 | |||
| JPM / JPMorgan Chase & Co. | 0,02 | 3,25 | 3,06 | 21,11 | 1,6647 | 0,1057 | |||
| CSCO / Cisco Systems, Inc. | 0,06 | 3,49 | 2,84 | −2,74 | 1,5454 | −0,2569 | |||
| BMY / Bristol-Myers Squibb Company | 0,04 | 24,74 | 2,23 | 10,28 | 1,2146 | −0,0347 | |||
| C / Citigroup Inc. | 0,04 | 3,55 | 1,96 | 29,50 | 1,0681 | 0,1327 | |||
| INTC / Intel Corporation | 0,04 | 2,70 | 1,94 | 45,18 | 1,0568 | 0,2312 | |||
| ALGN / Align Technology, Inc. | 0,01 | 125,02 | 1,83 | 160,77 | 0,9954 | 0,4370 | |||
| NEE.PRN / NextEra Energy Capital Holdings, Inc. - Corporate Bond/Note | 0,03 | 4,08 | 1,79 | 10,37 | 0,9734 | −0,0271 | |||
| CRM / Salesforce, Inc. | 0,01 | 2,75 | 1,75 | 33,28 | 0,9509 | 0,1421 | |||
| EXPE / Expedia Group, Inc. | 0,01 | −3,33 | 1,74 | 42,40 | 0,9492 | 0,1930 | |||
| TEAM / Atlassian Corporation | 0,01 | 1,73 | 0,9412 | 0,9412 | |||||
| ADSK / Autodesk, Inc. | 0,01 | 2,86 | 1,69 | 21,05 | 0,9208 | 0,0580 | |||
| CAT / Caterpillar Inc. | 0,01 | 3,19 | 1,64 | 11,76 | 0,8901 | −0,0132 | |||
| AXP / American Express Company | 0,01 | 108,46 | 1,62 | 161,75 | 0,8794 | 0,4984 | |||
| FNF / Fidelity National Financial, Inc. | 0,03 | 3,16 | 1,60 | 27,45 | 0,8696 | 0,0957 | |||
| SWKS / Skyworks Solutions, Inc. | 0,01 | 3,15 | 1,60 | 17,63 | 0,8685 | 0,0311 | |||
| ULTA / Ulta Beauty, Inc. | 0,00 | 121,48 | 1,59 | 172,04 | 0,8636 | 0,5031 | |||
| BKNG / Booking Holdings Inc. | 0,00 | 2,77 | 1,58 | 18,20 | 0,8592 | 0,0348 | |||
| ADBE / Adobe Inc. | 0,00 | 2,74 | 1,57 | 20,26 | 0,8531 | 0,0482 | |||
| V / Visa Inc. | 0,01 | 2,88 | 1,56 | 16,46 | 0,8514 | 0,0221 | |||
| PANW / Palo Alto Networks, Inc. | 0,01 | −7,28 | 1,55 | 16,62 | 0,8447 | 0,0232 | |||
| APTV / Aptiv PLC | 0,02 | 47,74 | 1,54 | 34,44 | 0,8398 | 0,1314 | |||
| HIG / The Hartford Insurance Group, Inc. | 0,02 | 3,10 | 1,54 | 16,83 | 0,8391 | 0,0248 | |||
| TXT / Textron Inc. | 0,02 | 3,20 | 1,54 | 6,21 | 0,8380 | −0,0569 | |||
| TGT / Target Corporation | 0,01 | 3,14 | 1,54 | 32,90 | 0,8378 | 0,1225 | |||
| FITB / Fifth Third Bancorp | 0,04 | −4,30 | 1,52 | 30,31 | 0,8286 | 0,1074 | |||
| CB / Chubb Limited | 0,01 | 3,06 | 1,52 | 11,89 | 0,8250 | −0,0114 | |||
| HD / The Home Depot, Inc. | 0,00 | 3,07 | 1,51 | 18,22 | 0,8234 | 0,0334 | |||
| USB / U.S. Bancorp | 0,03 | 3,28 | 1,51 | 35,24 | 0,8231 | 0,1327 | |||
| MSCI / MSCI Inc. | 0,00 | 3,25 | 1,51 | 13,80 | 0,8217 | 0,0030 | |||
| PH / Parker-Hannifin Corporation | 0,00 | 3,28 | 1,51 | 22,12 | 0,8207 | 0,0587 | |||
| CVS / CVS Health Corporation | 0,02 | −22,54 | 1,51 | −12,40 | 0,8192 | −0,2415 | |||
| EA / Electronic Arts Inc. | 0,01 | 3,00 | 1,50 | 17,07 | 0,8176 | 0,0253 | |||
| PAYC / Paycom Software, Inc. | 0,01 | 61,61 | 1,49 | 28,79 | 0,8137 | 0,0975 | |||
| DAL / Delta Air Lines, Inc. | 0,04 | 3,14 | 1,49 | 12,18 | 0,8122 | −0,0092 | |||
| LHX / L3Harris Technologies, Inc. | 0,01 | 3,27 | 1,49 | 24,92 | 0,8106 | 0,0746 | |||
| GD / General Dynamics Corporation | 0,01 | 3,23 | 1,49 | 21,31 | 0,8089 | 0,0526 | |||
| CNC / Centene Corporation | 0,02 | 3,17 | 1,48 | 11,20 | 0,8051 | −0,0164 | |||
| ZM / Zoom Communications Inc. | 0,02 | 116,10 | 1,48 | 122,44 | 0,8042 | 0,3937 | |||
| DOV / Dover Corporation | 0,01 | 3,37 | 1,48 | 13,97 | 0,8040 | 0,0038 | |||
| AVGO / Broadcom Inc. | 0,00 | 1,48 | 0,8038 | 0,8038 | |||||
| SWK / Stanley Black & Decker, Inc. | 0,02 | 1,47 | 0,8024 | 0,8024 | |||||
| MMM / 3M Company | 0,01 | 17,75 | 1,47 | 37,48 | 0,8010 | 0,1403 | |||
| ECL / Ecolab Inc. | 0,01 | 3,23 | 1,47 | 20,91 | 0,7999 | 0,0493 | |||
| PSX / Phillips 66 | 0,01 | −3,86 | 1,46 | 6,55 | 0,7964 | −0,0515 | |||
| MTB / M&T Bank Corporation | 0,01 | 3,30 | 1,45 | 12,03 | 0,7911 | −0,0101 | |||
| TMUS / T-Mobile US, Inc. | 0,01 | 3,26 | 1,45 | 18,24 | 0,7904 | 0,0321 | |||
| BAC / Bank of America Corporation | 0,04 | 3,49 | 1,45 | 27,30 | 0,7893 | 0,0859 | |||
| KHC / The Kraft Heinz Company | 0,04 | 3,29 | 1,45 | 13,49 | 0,7881 | 0,0009 | |||
| FDX / FedEx Corporation | 0,01 | 3,06 | 1,43 | −1,58 | 0,7796 | −0,1189 | |||
| TRV / The Travelers Companies, Inc. | 0,01 | 86,39 | 1,43 | 117,53 | 0,7769 | 0,3716 | |||
| KR / The Kroger Co. | 0,03 | 1,42 | 0,7756 | 0,7756 | |||||
| MRK / Merck & Co., Inc. | 0,01 | 3,44 | 1,42 | 9,49 | 0,7728 | −0,0274 | |||
| NTAP / NetApp, Inc. | 0,02 | 3,25 | 1,42 | 19,97 | 0,7723 | 0,0421 | |||
| GOOGL / Alphabet Inc. | 0,01 | 3,51 | 1,41 | 10,50 | 0,7676 | −0,0203 | |||
| MSFT / Microsoft Corporation | 0,00 | −3,93 | 1,41 | 55,19 | 0,7653 | 0,0129 | |||
| PPG / PPG Industries, Inc. | 0,01 | 3,41 | 1,40 | 19,19 | 0,7645 | 0,0368 | |||
| JCI / Johnson Controls International plc | 0,02 | 1,40 | 0,7640 | 0,7640 | |||||
| HCA / HCA Healthcare, Inc. | 0,01 | 3,57 | 1,39 | 14,02 | 0,7573 | 0,0036 | |||
| MA / Mastercard Incorporated | 0,00 | 1,38 | 0,7515 | 0,7515 | |||||
| CSX / CSX Corporation | 0,04 | 3,59 | 1,38 | 16,79 | 0,7496 | 0,0216 | |||
| MET / MetLife, Inc. | 0,02 | 3,49 | 1,38 | 8,77 | 0,7493 | −0,0319 | |||
| NEM / Newmont Corporation | 0,03 | 3,70 | 1,37 | 16,19 | 0,7466 | 0,0176 | |||
| UHS / Universal Health Services, Inc. | 0,01 | 3,67 | 1,37 | 25,69 | 0,7432 | 0,0726 | |||
| EBAY / eBay Inc. | 0,03 | 13,42 | 1,36 | 12,26 | 0,7425 | −0,0080 | |||
| LDOS / Leidos Holdings, Inc. | 0,01 | −17,11 | 1,36 | −2,65 | 0,7403 | −0,1221 | |||
| BKR / Baker Hughes Company | 0,04 | 1,36 | 0,7392 | 0,7392 | |||||
| VRSN / VeriSign, Inc. | 0,01 | 3,30 | 1,35 | 5,06 | 0,7343 | −0,0585 | |||
| LYB / LyondellBasell Industries N.V. | 0,01 | 34,97 | 1,35 | 70,60 | 0,7330 | 0,0773 | |||
| CI / The Cigna Group | 0,00 | 3,64 | 1,35 | 8,47 | 0,7325 | −0,0333 | |||
| RF / Regions Financial Corporation | 0,07 | 3,87 | 1,34 | 17,07 | 0,7319 | 0,0226 | |||
| RPRX / Royalty Pharma plc | 0,05 | 121,84 | 1,34 | 129,67 | 0,7289 | 0,3689 | |||
| STT / State Street Corporation | 0,02 | 3,65 | 1,33 | 19,87 | 0,7227 | 0,0391 | |||
| UNH / UnitedHealth Group Incorporated | 0,00 | −3,97 | 1,32 | 0,30 | 0,7207 | −0,0945 | |||
| GILD / Gilead Sciences, Inc. | 0,02 | 3,69 | 1,31 | 12,02 | 0,7156 | −0,0085 | |||
| HAL / Halliburton Company | 0,04 | 1,31 | 0,7134 | 0,7134 | |||||
| EMR / Emerson Electric Co. | 0,01 | 3,89 | 1,30 | 4,74 | 0,7095 | −0,0590 | |||
| CMI / Cummins Inc. | 0,01 | 3,69 | 1,29 | 8,74 | 0,7044 | −0,0304 | |||
| KMB / Kimberly-Clark Corporation | 0,01 | 3,66 | 1,29 | 4,19 | 0,7043 | −0,0621 | |||
| MOH / Molina Healthcare, Inc. | 0,00 | −11,92 | 1,28 | −2,95 | 0,6987 | −0,1178 | |||
| FTV / Fortive Corporation | 0,02 | 3,92 | 1,28 | 3,22 | 0,6981 | −0,0693 | |||
| HOLX / Hologic, Inc. | 0,02 | 3,78 | 1,28 | 6,85 | 0,6964 | −0,0429 | |||
| WTW / Willis Towers Watson Public Limited Company | 0,01 | −12,19 | 1,28 | 1,35 | 0,6959 | −0,0828 | |||
| GPN / Global Payments Inc. | 0,01 | −10,83 | 1,26 | −1,87 | 0,6867 | −0,1069 | |||
| DVN / Devon Energy Corporation | 0,03 | 3,88 | 1,26 | −1,33 | 0,6857 | −0,1026 | |||
| ANTM / Anthem Inc | 0,00 | 3,73 | 1,26 | 12,42 | 0,6848 | −0,0066 | |||
| MO / Altria Group, Inc. | 0,03 | 3,69 | 1,25 | −0,56 | 0,6786 | −0,0951 | |||
| DTE / DTE Energy Company | 0,01 | 3,80 | 1,25 | 15,26 | 0,6784 | 0,0110 | |||
| COG / Cabot Oil & Gas Corp. | 0,05 | 3,96 | 1,24 | −1,98 | 0,6744 | −0,1055 | |||
| PM / Philip Morris International Inc. | 0,01 | 3,99 | 1,20 | 5,75 | 0,6510 | −0,0477 | |||
| HSY / The Hershey Company | 0,01 | 3,90 | 1,19 | −3,17 | 0,6490 | −0,1113 | |||
| T / AT&T Inc. | 0,07 | −24,75 | 1,15 | −15,90 | 0,6250 | −0,2182 | |||
| FGXXX / First American Funds Inc - First American Government Obligations Fund Class X | 1,12 | −44,12 | 1,12 | −44,14 | 0,6073 | −0,6254 | |||
| SQ / Block, Inc. | 0,01 | 2,29 | 1,10 | 78,70 | 0,5986 | 0,2188 | |||
| PYPL / PayPal Holdings, Inc. | 0,02 | −16,58 | 1,05 | −12,38 | 0,5700 | −0,1678 | |||
| NOW / ServiceNow, Inc. | 0,00 | −4,58 | 0,97 | 20,62 | 0,5288 | 0,0315 | |||
| WDAY / Workday, Inc. | 0,00 | 0,83 | 0,4503 | 0,4503 | |||||
| IBM / International Business Machines Corporation | 0,00 | 2,90 | 0,81 | 19,91 | 0,4396 | 0,0239 | |||
| HST / Host Hotels & Resorts, Inc. | 0,04 | 3,36 | 0,80 | 25,31 | 0,4369 | 0,0412 | |||
| NXPI / NXP Semiconductors N.V. | 0,00 | 3,11 | 0,78 | 18,43 | 0,4269 | 0,0182 | |||
| MAS / Masco Corporation | 0,01 | 3,10 | 0,78 | 29,21 | 0,4263 | 0,0521 | |||
| NNN / NNN REIT, Inc. | 0,02 | 3,52 | 0,76 | 26,21 | 0,4117 | 0,0419 | |||
| VEEV / Veeva Systems Inc. | 0,00 | 0,75 | 0,4104 | 0,4104 | |||||
| MDT / Medtronic plc | 0,01 | 0,75 | 0,4068 | 0,4068 | |||||
| BR / Broadridge Financial Solutions, Inc. | 0,00 | 0,74 | 0,4045 | 0,4045 | |||||
| O / Realty Income Corporation | 0,01 | 140,31 | 0,74 | 176,49 | 0,4038 | 0,2380 | |||
| INCY / Incyte Corporation | 0,01 | 9,90 | 0,74 | −17,91 | 0,4017 | −0,4687 | |||
| DFS / Discover Financial Services | 0,01 | 3,50 | 0,73 | 34,43 | 0,3997 | 0,0621 | |||
| STAG / STAG Industrial, Inc. | 0,02 | 3,73 | 0,73 | 18,04 | 0,3991 | 0,0155 | |||
| PINS / Pinterest, Inc. | 0,02 | −65,49 | 0,72 | −29,59 | 0,3925 | −0,4224 | |||
| GM / General Motors Company | 0,02 | 3,56 | 0,72 | 12,89 | 0,3911 | −0,0021 | |||
| GLPI / Gaming and Leisure Properties, Inc. | 0,01 | 123,45 | 0,72 | 141,89 | 0,3901 | 0,2074 | |||
| SBAC / SBA Communications Corporation | 0,00 | 3,44 | 0,72 | 31,14 | 0,3901 | 0,0526 | |||
| J / Jacobs Solutions Inc. | 0,01 | 0,71 | 0,3858 | 0,3858 | |||||
| HUM / Humana Inc. | 0,00 | 3,09 | 0,70 | −3,03 | 0,3830 | −0,0648 | |||
| DT / Dynatrace, Inc. | 0,01 | 3,31 | 0,70 | 21,03 | 0,3821 | 0,0237 | |||
| LAMR / Lamar Advertising Company | 0,01 | 3,53 | 0,70 | 31,77 | 0,3819 | 0,0533 | |||
| DASH / DoorDash, Inc. | 0,01 | 0,70 | 0,3815 | 0,3815 | |||||
| CNP / CenterPoint Energy, Inc. | 0,02 | 3,32 | 0,70 | 10,08 | 0,3805 | −0,0120 | |||
| PEG / Public Service Enterprise Group Incorporated | 0,01 | 3,34 | 0,69 | 10,99 | 0,3742 | −0,0080 | |||
| CPB / The Campbell's Company | 0,02 | 42,72 | 0,69 | 50,22 | 0,3730 | 0,0913 | |||
| AMCR / Amcor plc | 0,07 | 3,48 | 0,68 | 8,93 | 0,3722 | −0,0154 | |||
| BBY / Best Buy Co., Inc. | 0,01 | 3,62 | 0,68 | 16,75 | 0,3720 | 0,0106 | |||
| ETR / Entergy Corporation | 0,01 | 0,68 | 0,3697 | 0,3697 | |||||
| IPG / The Interpublic Group of Companies, Inc. | 0,02 | 3,57 | 0,68 | 17,98 | 0,3684 | 0,0141 | |||
| ELS / Equity LifeStyle Properties, Inc. | 0,01 | 112,86 | 0,68 | 124,58 | 0,3680 | 0,1802 | |||
| WRB / W. R. Berkley Corporation | 0,01 | −13,26 | 0,67 | −3,48 | 0,3630 | −0,0631 | |||
| EIX / Edison International | 0,01 | 3,72 | 0,66 | 17,17 | 0,3604 | 0,0115 | |||
| MAA / Mid-America Apartment Communities, Inc. | 0,00 | 4,07 | 0,66 | 8,79 | 0,3572 | −0,0153 | |||
| CLX / The Clorox Company | 0,00 | −51,12 | 0,66 | −46,83 | 0,3568 | −0,4042 | |||
| LPLA / LPL Financial Holdings Inc. | 0,00 | 3,57 | 0,65 | −0,77 | 0,3522 | −0,0505 | |||
| INVH / Invitation Homes Inc. | 0,02 | 4,03 | 0,64 | 12,06 | 0,3492 | −0,0045 | |||
| BAX / Baxter International Inc. | 0,02 | 3,87 | 0,64 | 6,31 | 0,3488 | −0,0230 | |||
| FR / First Industrial Realty Trust, Inc. | 0,01 | 4,22 | 0,64 | 15,25 | 0,3460 | 0,0058 | |||
| EG / Everest Group, Ltd. | 0,00 | −51,53 | 0,62 | −53,92 | 0,3395 | −0,4955 | |||
| UAL / United Airlines Holdings, Inc. | 0,01 | 3,84 | 0,62 | 1,31 | 0,3364 | −0,0403 | |||
| EXC / Exelon Corporation | 0,02 | 0,61 | 0,3342 | 0,3342 | |||||
| FOXA / Fox Corporation | 0,02 | 3,96 | 0,60 | −1,15 | 0,3271 | −0,0482 | |||
| NI / NiSource Inc. | 0,02 | 4,00 | 0,60 | 11,78 | 0,3259 | −0,0045 | |||
| GIS / General Mills, Inc. | 0,01 | 4,02 | 0,58 | 5,82 | 0,3173 | −0,0226 | |||
| FTNT / Fortinet, Inc. | 0,01 | −12,58 | 0,56 | −12,70 | 0,3032 | −0,0912 | |||
| CUBE / CubeSmart | 0,01 | 3,60 | 0,39 | 26,21 | 0,2125 | 0,0211 | |||
| ESS / Essex Property Trust, Inc. | 0,00 | 3,30 | 0,37 | 20,78 | 0,2030 | 0,0123 | |||
| KIM / Kimco Realty Corporation | 0,02 | 3,69 | 0,36 | 25,70 | 0,1944 | 0,0189 | |||
| AMH / American Homes 4 Rent | 0,01 | 3,79 | 0,33 | 10,96 | 0,1821 | −0,0043 | |||
| EQR / Equity Residential | 0,01 | 3,94 | 0,33 | 8,14 | 0,1810 | −0,0086 | |||
| ADC / Agree Realty Corporation | 0,00 | 4,30 | 0,31 | 18,77 | 0,1689 | 0,0077 | |||
| CME / CME Group Inc. | 0,00 | −96,52 | 0,05 | −96,34 | 0,0283 | −0,8489 | |||
| AEE / Ameren Corporation | 0,00 | −99,31 | 0,01 | −99,42 | 0,0038 | −0,6392 | |||
| AWK / American Water Works Company, Inc. | 0,00 | −100,00 | 0,00 | −100,00 | −0,3286 | ||||
| KMI / Kinder Morgan, Inc. | 0,00 | −100,00 | 0,00 | −100,00 | −0,7271 | ||||
| CCI / Crown Castle Inc. | 0,00 | −100,00 | 0,00 | −100,00 | −0,2112 | ||||
| DIS / The Walt Disney Company | 0,00 | −100,00 | 0,00 | −100,00 | −1,0134 | ||||
| PTC / PTC Inc. | 0,00 | −100,00 | 0,00 | −100,00 | −0,4313 | ||||
| FIS / Fidelity National Information Services, Inc. | 0,00 | −100,00 | 0,00 | −100,00 | −0,7670 | ||||
| WMT / Walmart Inc. | 0,00 | −100,00 | 0,00 | −100,00 | −0,8139 |