Grundläggande statistik
| Portföljvärde | $ 2 352 507 382 |
| Aktuella positioner | 90 |
Senaste innehav, resultat, förvaltat kapital (från 13F, 13D)
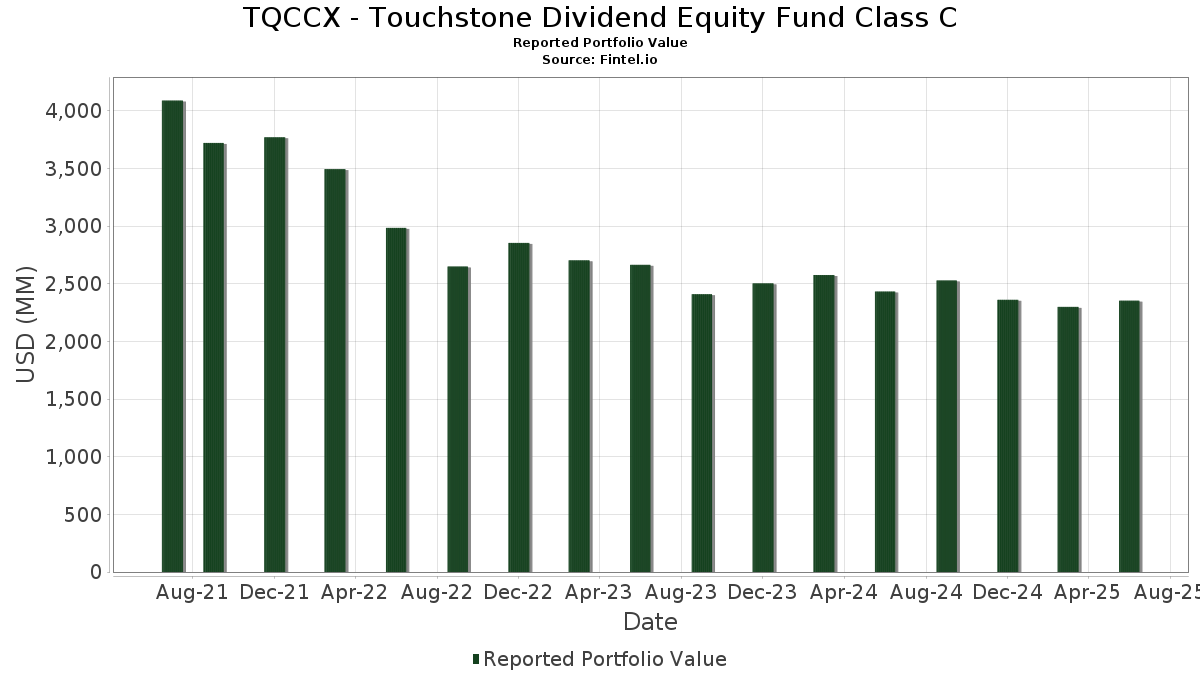
TQCCX - Touchstone Dividend Equity Fund Class C har redovisat 90 totala innehav i sina senaste SEC-arkiveringar. Det senaste portföljvärdet beräknas vara $ 2 352 507 382 USD. Faktiskt förvaltade tillgångar (AUM) är detta värde plus likvida medel (som inte redovisas). TQCCX - Touchstone Dividend Equity Fund Class Cs största innehav är Microsoft Corporation (US:MSFT) , Broadcom Inc. (US:AVGO) , Apple Inc. (US:AAPL) , Oracle Corporation (US:ORCL) , and Johnson & Johnson (US:JNJ) . TQCCX - Touchstone Dividend Equity Fund Class Cs nya positioner inkluderar Eli Lilly and Company (US:LLY) , .
Största ökningarna detta kvartal
Vi använder förändringen i portföljallokeringen eftersom det är det mest meningsfulla måttet. Förändringar kan bero på transaktioner eller förändringar i aktiekurser.
| Värdepapper | Aktier (MM) |
Värde (MM$) |
Portfölj % av | ΔPortfölj % av |
|---|---|---|---|---|
| 0,30 | 82,66 | 3,5131 | 1,3289 | |
| 0,21 | 106,53 | 4,5275 | 1,0301 | |
| 0,24 | 30,26 | 1,2859 | 0,7049 | |
| 0,02 | 12,32 | 0,5237 | 0,5237 | |
| 0,19 | 40,63 | 1,7270 | 0,5034 | |
| 0,26 | 22,14 | 0,9409 | 0,4070 | |
| 0,05 | 38,92 | 1,6542 | 0,3320 | |
| 0,06 | 39,39 | 1,6739 | 0,3016 | |
| 0,29 | 20,20 | 0,8585 | 0,2540 | |
| 0,13 | 38,23 | 1,6248 | 0,2219 |
Största minskningarna detta kvartal
Vi använder förändringen i portföljallokeringen eftersom det är det mest meningsfulla måttet. Förändringar kan bero på transaktioner eller förändringar i aktiepriser.
| Värdepapper | Aktier (MM) |
Värde (MM$) |
Portfölj % av | ΔPortfölj % av |
|---|---|---|---|---|
| 0,07 | 21,73 | 0,9236 | −0,6635 | |
| 0,21 | 37,53 | 1,5950 | −0,3647 | |
| 27,21 | 27,21 | 1,1563 | −0,3514 | |
| 0,13 | 22,52 | 0,9571 | −0,3457 | |
| 0,19 | 27,67 | 1,1762 | −0,2943 | |
| 0,33 | 18,35 | 0,7800 | −0,2623 | |
| 0,66 | 28,54 | 1,2130 | −0,2570 | |
| 0,37 | 17,30 | 0,7354 | −0,2564 | |
| 0,21 | 24,26 | 1,0310 | −0,2508 | |
| 0,21 | 29,80 | 1,2666 | −0,2481 |
13F- och fond arkiveringar
Denna blankett lämnades in den 2025-08-27 för rapporteringsperioden 2025-06-30. Klicka på länksymbolen för att se hela transaktionshistoriken.
Uppgradera för att låsa upp premiumdata och exportera till Excel![]() .
.
| Värdepapper | Typ | Genomsnittligt aktiepris | Aktier (MM) |
ΔAktier (%) |
ΔAktier (%) |
Värde ($MM) |
Portfölj (%) |
ΔPortfölj (%) |
|
|---|---|---|---|---|---|---|---|---|---|
| MSFT / Microsoft Corporation | 0,21 | 0,00 | 106,53 | 32,51 | 4,5275 | 1,0301 | |||
| AVGO / Broadcom Inc. | 0,30 | 0,00 | 82,66 | 64,64 | 3,5131 | 1,3289 | |||
| AAPL / Apple Inc. | 0,21 | 0,00 | 43,23 | −7,64 | 1,8374 | −0,1988 | |||
| ORCL / Oracle Corporation | 0,19 | −7,62 | 40,63 | 44,47 | 1,7270 | 0,5034 | |||
| JNJ / Johnson & Johnson | 0,27 | 0,00 | 40,50 | −7,89 | 1,7212 | −0,1916 | |||
| GS / The Goldman Sachs Group, Inc. | 0,06 | −3,63 | 39,39 | 24,85 | 1,6739 | 0,3016 | |||
| BAC / Bank of America Corporation | 0,82 | −3,09 | 39,00 | 9,89 | 1,6578 | 0,1137 | |||
| META / Meta Platforms, Inc. | 0,05 | 0,00 | 38,92 | 28,06 | 1,6542 | 0,3320 | |||
| IBM / International Business Machines Corporation | 0,13 | 0,00 | 38,23 | 18,55 | 1,6248 | 0,2219 | |||
| TXN / Texas Instruments Incorporated | 0,18 | 0,00 | 38,07 | 15,54 | 1,6179 | 0,1846 | |||
| HD / The Home Depot, Inc. | 0,10 | 0,00 | 37,98 | 0,04 | 1,6143 | −0,0374 | |||
| WFC / Wells Fargo & Company | 0,47 | −17,02 | 37,70 | −7,38 | 1,6023 | −0,1686 | |||
| PM / Philip Morris International Inc. | 0,21 | −27,39 | 37,53 | −16,69 | 1,5950 | −0,3647 | |||
| CSCO / Cisco Systems, Inc. | 0,53 | 0,00 | 36,91 | 12,43 | 1,5687 | 0,1405 | |||
| KLAC / KLA Corporation | 0,04 | −8,92 | 34,85 | 20,01 | 1,4812 | 0,2179 | |||
| V / Visa Inc. | 0,10 | 0,00 | 34,44 | 1,31 | 1,4636 | −0,0151 | |||
| MDT / Medtronic plc | 0,39 | −9,77 | 34,08 | −12,47 | 1,4483 | −0,2453 | |||
| AMT / American Tower Corporation | 0,15 | 0,00 | 34,05 | 1,57 | 1,4470 | −0,0112 | |||
| BLK / BlackRock, Inc. | 0,03 | −5,26 | 33,78 | 5,02 | 1,4356 | 0,0365 | |||
| XOM / Exxon Mobil Corporation | 0,30 | 0,00 | 32,57 | −9,36 | 1,3843 | −0,1789 | |||
| SCHW / The Charles Schwab Corporation | 0,35 | −9,33 | 31,85 | 5,68 | 1,3536 | 0,0426 | |||
| ADI / Analog Devices, Inc. | 0,13 | 0,00 | 31,23 | 18,02 | 1,3275 | 0,1762 | |||
| CAT / Caterpillar Inc. | 0,08 | −6,03 | 30,78 | 10,62 | 1,3083 | 0,0977 | |||
| T / AT&T Inc. | 1,05 | −15,49 | 30,33 | −13,52 | 1,2889 | −0,2367 | |||
| DIS / The Walt Disney Company | 0,24 | 80,31 | 30,26 | 126,56 | 1,2859 | 0,7049 | |||
| CVX / Chevron Corporation | 0,21 | 0,00 | 29,80 | −14,40 | 1,2666 | −0,2481 | |||
| USB / U.S. Bancorp | 0,65 | 0,00 | 29,38 | 7,18 | 1,2488 | 0,0562 | |||
| VZ / Verizon Communications Inc. | 0,66 | −11,46 | 28,54 | −15,54 | 1,2130 | −0,2570 | |||
| CMCSA / Comcast Corporation | 0,79 | 0,00 | 28,16 | −3,28 | 1,1967 | −0,0697 | |||
| BKNG / Booking Holdings Inc. | 0,00 | 0,00 | 27,97 | 25,67 | 1,1887 | 0,2205 | |||
| RTX / RTX Corporation | 0,19 | −25,73 | 27,67 | −18,13 | 1,1762 | −0,2943 | |||
| QCOM / QUALCOMM Incorporated | 0,17 | 0,00 | 27,66 | 3,68 | 1,1755 | 0,0150 | |||
| DGCXX / Dreyfus Government Cash Management Funds - Dreyfus Government Cash Management Fund Institutional Shares | 27,21 | −21,50 | 27,21 | −21,50 | 1,1563 | −0,3514 | |||
| JPM / JPMorgan Chase & Co. | 0,09 | 0,00 | 26,65 | 18,19 | 1,1326 | 0,1517 | |||
| MCD / McDonald's Corporation | 0,09 | 0,00 | 26,30 | −6,47 | 1,1178 | −0,1055 | |||
| KMI / Kinder Morgan, Inc. | 0,88 | 0,00 | 25,97 | 3,05 | 1,1036 | 0,0074 | |||
| SO / The Southern Company | 0,27 | −13,63 | 25,19 | −13,75 | 1,0706 | −0,1999 | |||
| SWK / Stanley Black & Decker, Inc. | 0,36 | 5,15 | 24,65 | −7,34 | 1,0476 | −0,1096 | |||
| SBUX / Starbucks Corporation | 0,27 | 0,00 | 24,53 | −6,58 | 1,0425 | −0,0998 | |||
| MMM / 3M Company | 0,16 | 0,00 | 24,44 | 3,67 | 1,0386 | 0,0131 | |||
| DUK / Duke Energy Corporation | 0,21 | −14,90 | 24,26 | −17,67 | 1,0310 | −0,2508 | |||
| LMT / Lockheed Martin Corporation | 0,05 | −10,18 | 23,83 | −6,88 | 1,0127 | −0,1005 | |||
| PEP / PepsiCo, Inc. | 0,18 | 0,00 | 23,42 | −11,94 | 0,9954 | −0,1616 | |||
| DD / DuPont de Nemours, Inc. | 0,34 | 39,56 | 23,42 | 28,19 | 0,9952 | 0,2005 | |||
| SYY / Sysco Corporation | 0,31 | −9,04 | 23,39 | −8,19 | 0,9941 | −0,1142 | |||
| NEE / NextEra Energy, Inc. | 0,33 | 0,00 | 22,99 | −2,07 | 0,9771 | −0,0442 | |||
| TFC / Truist Financial Corporation | 0,53 | 0,00 | 22,84 | 4,47 | 0,9709 | 0,0196 | |||
| BDX / Becton, Dickinson and Company | 0,13 | 0,00 | 22,52 | −24,80 | 0,9571 | −0,3457 | |||
| AJG / Arthur J. Gallagher & Co. | 0,07 | 0,00 | 22,27 | −7,27 | 0,9465 | −0,0983 | |||
| C / Citigroup Inc. | 0,26 | 50,44 | 22,14 | 80,38 | 0,9409 | 0,4070 | |||
| CVS / CVS Health Corporation | 0,32 | −7,77 | 22,11 | −6,10 | 0,9395 | −0,0846 | |||
| ADP / Automatic Data Processing, Inc. | 0,07 | 0,00 | 22,08 | 0,94 | 0,9384 | −0,0132 | |||
| YUM / Yum! Brands, Inc. | 0,15 | 0,00 | 22,04 | −5,83 | 0,9366 | −0,0815 | |||
| MU / Micron Technology, Inc. | 0,18 | −26,61 | 21,99 | 4,09 | 0,9346 | 0,0156 | |||
| UNP / Union Pacific Corporation | 0,10 | 25,48 | 21,97 | 22,20 | 0,9339 | 0,1517 | |||
| PAYX / Paychex, Inc. | 0,15 | −11,69 | 21,78 | −16,74 | 0,9257 | −0,2123 | |||
| UNH / UnitedHealth Group Incorporated | 0,07 | 0,00 | 21,73 | −40,44 | 0,9236 | −0,6635 | |||
| LIN / Linde plc | 0,04 | 0,00 | 21,08 | 0,76 | 0,8959 | −0,0142 | |||
| ETR / Entergy Corporation | 0,25 | −12,25 | 21,01 | −14,69 | 0,8931 | −0,1784 | |||
| PG / The Procter & Gamble Company | 0,13 | 20,01 | 20,55 | 12,19 | 0,8732 | 0,0766 | |||
| IFF / International Flavors & Fragrances Inc. | 0,28 | 0,00 | 20,53 | −5,23 | 0,8727 | −0,0699 | |||
| ACN / Accenture plc | 0,07 | 0,00 | 20,24 | −4,21 | 0,8600 | −0,0590 | |||
| MCHP / Microchip Technology Incorporated | 0,29 | 0,00 | 20,20 | 45,36 | 0,8585 | 0,2540 | |||
| LVS / Las Vegas Sands Corp. | 0,46 | 0,00 | 19,93 | 12,63 | 0,8473 | 0,0773 | |||
| MS / Morgan Stanley | 0,14 | 0,00 | 19,56 | 20,73 | 0,8314 | 0,1265 | |||
| CRM / Salesforce, Inc. | 0,07 | 0,00 | 19,42 | 1,61 | 0,8254 | −0,0060 | |||
| DE / Deere & Company | 0,04 | 0,00 | 19,16 | 8,34 | 0,8141 | 0,0449 | |||
| MRK / Merck & Co., Inc. | 0,24 | 0,00 | 19,12 | −11,81 | 0,8125 | −0,1305 | |||
| PFE / Pfizer Inc. | 0,79 | 0,00 | 19,09 | −4,34 | 0,8115 | −0,0568 | |||
| GOOG / Alphabet Inc. | 0,10 | 0,00 | 18,49 | 13,55 | 0,7859 | 0,0774 | |||
| FOXA / Fox Corporation | 0,33 | −22,64 | 18,35 | −23,40 | 0,7800 | −0,2623 | |||
| STZ / Constellation Brands, Inc. | 0,11 | 0,00 | 18,32 | −11,35 | 0,7788 | −0,1205 | |||
| LUV / Southwest Airlines Co. | 0,56 | 0,00 | 18,29 | −3,40 | 0,7774 | −0,0463 | |||
| APD / Air Products and Chemicals, Inc. | 0,06 | 0,00 | 18,09 | −4,36 | 0,7687 | −0,0540 | |||
| BMY / Bristol-Myers Squibb Company | 0,37 | 0,00 | 17,30 | −24,11 | 0,7354 | −0,2564 | |||
| ARE / Alexandria Real Estate Equities, Inc. | 0,24 | 0,00 | 17,19 | −21,49 | 0,7306 | −0,2219 | |||
| DG / Dollar General Corporation | 0,15 | 0,00 | 16,79 | 30,08 | 0,7138 | 0,1521 | |||
| ABBV / AbbVie Inc. | 0,09 | 0,00 | 16,60 | −11,41 | 0,7054 | −0,1096 | |||
| TGT / Target Corporation | 0,16 | 0,00 | 15,89 | −5,47 | 0,6755 | −0,0559 | |||
| NKE / NIKE, Inc. | 0,22 | 22,48 | 15,58 | 37,08 | 0,6622 | 0,1677 | |||
| OMC / Omnicom Group Inc. | 0,19 | 0,00 | 13,92 | −13,23 | 0,5916 | −0,1063 | |||
| PSX / Phillips 66 | 0,11 | 0,00 | 13,27 | −3,39 | 0,5640 | −0,0335 | |||
| TROW / T. Rowe Price Group, Inc. | 0,14 | 0,00 | 13,21 | 5,03 | 0,5613 | 0,0143 | |||
| SPG / Simon Property Group, Inc. | 0,08 | 0,00 | 13,20 | −3,20 | 0,5610 | −0,0322 | |||
| LLY / Eli Lilly and Company | 0,02 | 12,32 | 0,5237 | 0,5237 | |||||
| VLO / Valero Energy Corporation | 0,09 | 0,00 | 11,56 | 1,78 | 0,4913 | −0,0028 | |||
| PFG / Principal Financial Group, Inc. | 0,14 | 0,00 | 11,41 | −5,85 | 0,4847 | −0,0423 | |||
| AMGN / Amgen Inc. | 0,04 | 0,00 | 11,23 | −10,38 | 0,4774 | −0,0679 | |||
| INTC / Intel Corporation | 0,48 | 0,00 | 10,71 | −1,36 | 0,4554 | −0,0172 | |||
| VFC / V.F. Corporation | 0,56 | 0,00 | 6,53 | −24,29 | 0,2774 | −0,0976 |