Grundläggande statistik
| Portföljvärde | $ 688 838 507 |
| Aktuella positioner | 99 |
Senaste innehav, resultat, förvaltat kapital (från 13F, 13D)
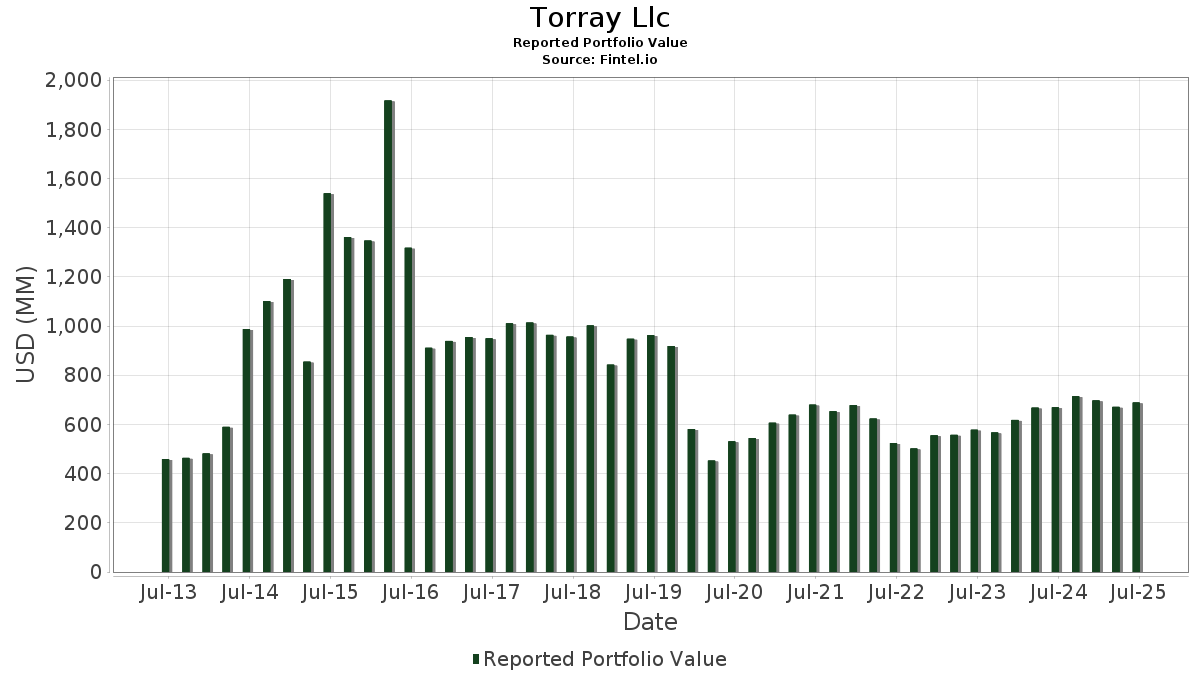
Torray Llc har redovisat 99 totala innehav i sina senaste SEC-arkiveringar. Det senaste portföljvärdet beräknas vara $ 688 838 507 USD. Faktiskt förvaltade tillgångar (AUM) är detta värde plus likvida medel (som inte redovisas). Torray Llcs största innehav är Broadcom Inc. (US:AVGO) , Texas Instruments Incorporated (US:TXN) , Royalty Pharma plc (US:RPRX) , Phillips 66 (US:PSX) , and The Home Depot, Inc. (US:HD) . Torray Llcs nya positioner inkluderar Taiwan Semiconductor Manufacturing Company Limited - Depositary Receipt (Common Stock) (US:TSM) , Krystal Biotech, Inc. (US:KRYS) , Vanguard Index Funds - Vanguard Total Stock Market ETF (US:VTI) , .
Största ökningarna detta kvartal
Vi använder förändringen i portföljallokeringen eftersom det är det mest meningsfulla måttet. Förändringar kan bero på transaktioner eller förändringar i aktiekurser.
| Värdepapper | Aktier (MM) |
Värde (MM$) |
Portfölj % av | ΔPortfölj % av |
|---|---|---|---|---|
| 0,15 | 40,98 | 5,9498 | 4,1665 | |
| 0,13 | 18,11 | 2,6284 | 2,6284 | |
| 0,13 | 19,99 | 2,9021 | 2,2005 | |
| 0,42 | 19,68 | 2,8567 | 2,1211 | |
| 0,65 | 15,78 | 2,2905 | 1,7879 | |
| 0,10 | 17,64 | 2,5611 | 1,7543 | |
| 0,14 | 14,66 | 2,1288 | 1,4004 | |
| 0,13 | 27,36 | 3,9723 | 1,2660 | |
| 0,20 | 24,19 | 3,5115 | 1,0309 | |
| 0,03 | 6,53 | 0,9473 | 0,9473 |
Största minskningarna detta kvartal
Vi använder förändringen i portföljallokeringen eftersom det är det mest meningsfulla måttet. Förändringar kan bero på transaktioner eller förändringar i aktiepriser.
| Värdepapper | Aktier (MM) |
Värde (MM$) |
Portfölj % av | ΔPortfölj % av |
|---|---|---|---|---|
| 0,05 | 8,01 | 1,1624 | −2,7566 | |
| 0,00 | 0,64 | 0,0936 | −2,6515 | |
| 0,05 | 9,29 | 1,3480 | −1,8699 | |
| 0,00 | 0,64 | 0,0932 | −1,4731 | |
| 0,09 | 6,45 | 0,9366 | −1,3965 | |
| 0,04 | 18,11 | 2,6286 | −0,6913 | |
| 0,04 | 10,99 | 1,5951 | −0,6804 | |
| 0,01 | 0,60 | 0,0875 | −0,5356 | |
| 0,00 | 0,27 | 0,0397 | −0,5207 | |
| 0,69 | 24,82 | 3,6027 | −0,3948 |
13F- och fond arkiveringar
Denna blankett lämnades in den 2025-08-05 för rapporteringsperioden 2025-06-30. Klicka på länksymbolen för att se hela transaktionshistoriken.
Uppgradera för att låsa upp premiumdata och exportera till Excel![]() .
.
| Värdepapper | Typ | Genomsnittligt aktiepris | Aktier (MM) |
ΔAktier (%) |
ΔAktier (%) |
Värde ($MM) |
Portfölj (%) |
ΔPortfölj (%) |
|
|---|---|---|---|---|---|---|---|---|---|
| AVGO / Broadcom Inc. | 0,15 | 107,95 | 40,98 | 242,36 | 5,9498 | 4,1665 | |||
| TXN / Texas Instruments Incorporated | 0,13 | 30,36 | 27,36 | 50,61 | 3,9723 | 1,2660 | |||
| RPRX / Royalty Pharma plc | 0,69 | −20,10 | 24,82 | −7,52 | 3,6027 | −0,3948 | |||
| PSX / Phillips 66 | 0,20 | 50,35 | 24,19 | 45,26 | 3,5115 | 1,0309 | |||
| HD / The Home Depot, Inc. | 0,06 | −1,29 | 20,61 | −1,25 | 2,9915 | −0,1172 | |||
| BX / Blackstone Inc. | 0,13 | 296,61 | 19,99 | 324,42 | 2,9021 | 2,2005 | |||
| CNA / CNA Financial Corporation | 0,42 | 335,00 | 19,68 | 298,58 | 2,8567 | 2,1211 | |||
| AMGN / Amgen Inc. | 0,07 | 21,88 | 19,51 | 9,23 | 2,8316 | 0,1713 | |||
| AXP / American Express Company | 0,06 | −1,09 | 18,39 | 17,26 | 2,6696 | 0,3335 | |||
| MSFT / Microsoft Corporation | 0,04 | −4,62 | 18,25 | 26,39 | 2,6487 | 0,4982 | |||
| BRK.B / Berkshire Hathaway Inc. | 0,04 | −10,92 | 18,11 | −18,75 | 2,6286 | −0,6913 | |||
| CVX / Chevron Corporation | 0,13 | 18,11 | 2,6284 | 2,6284 | |||||
| ABBV / AbbVie Inc. | 0,10 | 267,71 | 17,64 | 225,78 | 2,5611 | 1,7543 | |||
| EOG / EOG Resources, Inc. | 0,14 | −4,13 | 17,28 | −10,59 | 2,5087 | −0,3703 | |||
| AMZN / Amazon.com, Inc. | 0,08 | −4,18 | 17,10 | 10,49 | 2,4831 | 0,1770 | |||
| PFE / Pfizer Inc. | 0,65 | 388,86 | 15,78 | 367,74 | 2,2905 | 1,7879 | |||
| JPM / JPMorgan Chase & Co. | 0,05 | −14,00 | 15,48 | 1,64 | 2,2476 | −0,0215 | |||
| UNH / UnitedHealth Group Incorporated | 0,05 | 126,34 | 15,39 | 34,82 | 2,2344 | 0,5337 | |||
| MMC / Marsh & McLennan Companies, Inc. | 0,07 | −1,13 | 15,31 | −11,41 | 2,2223 | −0,3520 | |||
| PLD / Prologis, Inc. | 0,14 | 218,93 | 14,66 | 199,94 | 2,1288 | 1,4004 | |||
| ETN / Eaton Corporation plc | 0,04 | −1,11 | 14,51 | 29,87 | 2,1059 | 0,4419 | |||
| LENB / Lennar Corp. - Class B | 0,13 | 33,95 | 13,66 | 29,26 | 1,9824 | 0,4086 | |||
| AAPL / Apple Inc. | 0,06 | −6,40 | 11,40 | −13,55 | 1,6555 | −0,3094 | |||
| GD / General Dynamics Corporation | 0,04 | −32,77 | 10,99 | −28,07 | 1,5951 | −0,6804 | |||
| APH / Amphenol Corporation | 0,10 | −6,97 | 9,51 | 40,08 | 1,3812 | 0,3693 | |||
| CASY / Casey's General Stores, Inc. | 0,02 | −4,95 | 9,43 | 11,75 | 1,3687 | 0,1118 | |||
| GOOGL / Alphabet Inc. | 0,05 | −62,28 | 9,29 | −57,02 | 1,3480 | −1,8699 | |||
| CNSWF / Constellation Software Inc. | 0,00 | −6,65 | 8,81 | 8,14 | 1,2787 | 0,0653 | |||
| NOW / ServiceNow, Inc. | 0,01 | 6,66 | 8,81 | 37,74 | 1,2786 | 0,3260 | |||
| SNPS / Synopsys, Inc. | 0,02 | −6,76 | 8,63 | 11,46 | 1,2528 | 0,0994 | |||
| FI / Fiserv, Inc. | 0,05 | −61,01 | 8,01 | −69,56 | 1,1624 | −2,7566 | |||
| VEEV / Veeva Systems Inc. | 0,03 | −5,69 | 7,74 | 17,25 | 1,1241 | 0,1403 | |||
| VRTX / Vertex Pharmaceuticals Incorporated | 0,02 | 7,37 | 7,51 | −1,40 | 1,0909 | −0,0445 | |||
| V / Visa Inc. | 0,02 | −6,21 | 7,38 | −4,98 | 1,0710 | −0,0856 | |||
| LZAGY / Lonza Group AG - Depositary Receipt (Common Stock) | 0,10 | −5,62 | 7,17 | 9,24 | 1,0415 | 0,0632 | |||
| CPRT / Copart, Inc. | 0,14 | 1,11 | 7,01 | −12,32 | 1,0169 | −0,1733 | |||
| FTXP / Foothills Exploration, Inc. | 0,01 | −5,78 | 6,62 | 24,16 | 0,9604 | 0,1666 | |||
| TSM / Taiwan Semiconductor Manufacturing Company Limited - Depositary Receipt (Common Stock) | 0,03 | 6,53 | 0,9473 | 0,9473 | |||||
| CEG / Constellation Energy Corporation | 0,02 | −24,80 | 6,50 | 20,37 | 0,9436 | 0,1392 | |||
| WRB / W. R. Berkley Corporation | 0,09 | −60,10 | 6,45 | −58,81 | 0,9366 | −1,3965 | |||
| ADBE / Adobe Inc. | 0,02 | −4,78 | 6,45 | −3,95 | 0,9363 | −0,0640 | |||
| ORLY / O'Reilly Automotive, Inc. | 0,07 | 1 305,40 | 6,29 | −11,58 | 0,9134 | −0,1466 | |||
| MS / Morgan Stanley | 0,04 | −2,74 | 6,21 | 17,42 | 0,9012 | 0,1137 | |||
| AJG / Arthur J. Gallagher & Co. | 0,02 | −6,61 | 6,10 | −13,40 | 0,8859 | −0,1639 | |||
| TYL / Tyler Technologies, Inc. | 0,01 | −5,90 | 5,94 | −4,04 | 0,8617 | −0,0598 | |||
| AMAT / Applied Materials, Inc. | 0,03 | −39,52 | 5,79 | −23,71 | 0,8404 | −0,2899 | |||
| VRSK / Verisk Analytics, Inc. | 0,02 | −20,95 | 5,63 | −17,26 | 0,8166 | −0,1962 | |||
| DLR / Digital Realty Trust, Inc. | 0,02 | −2,62 | 4,20 | 18,49 | 0,6095 | 0,0816 | |||
| SHW / The Sherwin-Williams Company | 0,01 | −3,85 | 4,20 | −5,45 | 0,6092 | −0,0520 | |||
| MO / Altria Group, Inc. | 0,07 | −2,74 | 3,98 | −5,01 | 0,5776 | −0,0463 | |||
| LMT / Lockheed Martin Corporation | 0,01 | −24,77 | 3,24 | −21,98 | 0,4704 | −0,1484 | |||
| RBC / RBC Bearings Incorporated | 0,01 | −0,27 | 3,24 | 19,29 | 0,4704 | 0,0657 | |||
| RYAN / Ryan Specialty Holdings, Inc. | 0,04 | −0,25 | 2,66 | −8,18 | 0,3861 | −0,0455 | |||
| DT / Dynatrace, Inc. | 0,05 | −0,12 | 2,61 | 16,97 | 0,3784 | 0,0464 | |||
| ANSS / ANSYS, Inc. | 0,01 | −0,28 | 2,54 | 10,65 | 0,3682 | 0,0267 | |||
| MPWR / Monolithic Power Systems, Inc. | 0,00 | 0,07 | 2,23 | 26,16 | 0,3243 | 0,0606 | |||
| TW / Tradeweb Markets Inc. | 0,01 | −19,40 | 2,19 | −20,52 | 0,3179 | −0,0925 | |||
| BWXT / BWX Technologies, Inc. | 0,02 | −0,31 | 2,18 | 45,65 | 0,3159 | 0,0932 | |||
| BPMC / Blueprint Medicines Corporation | 0,02 | −0,38 | 2,13 | 44,24 | 0,3092 | 0,0893 | |||
| HALO / Halozyme Therapeutics, Inc. | 0,04 | −27,69 | 2,08 | −41,06 | 0,3024 | −0,2240 | |||
| NTRA / Natera, Inc. | 0,01 | −0,25 | 1,92 | 19,23 | 0,2790 | 0,0388 | |||
| JKHY / Jack Henry & Associates, Inc. | 0,01 | −0,21 | 1,87 | −1,52 | 0,2720 | −0,0115 | |||
| AXSM / Axsome Therapeutics, Inc. | 0,02 | −0,30 | 1,78 | −10,77 | 0,2586 | −0,0388 | |||
| SBAC / SBA Communications Corporation | 0,01 | −25,85 | 1,70 | −20,83 | 0,2467 | −0,0731 | |||
| ENTG / Entegris, Inc. | 0,02 | 35,44 | 1,69 | 24,94 | 0,2458 | 0,0438 | |||
| BE / Bloom Energy Corporation | 0,07 | 50,80 | 1,66 | 83,61 | 0,2407 | 0,1061 | |||
| QLYS / Qualys, Inc. | 0,01 | −0,79 | 1,60 | 12,55 | 0,2317 | 0,0205 | |||
| KRYS / Krystal Biotech, Inc. | 0,01 | 1,59 | 0,2310 | 0,2310 | |||||
| MTD / Mettler-Toledo International Inc. | 0,00 | 0,00 | 1,59 | −0,50 | 0,2306 | −0,0073 | |||
| LNTH / Lantheus Holdings, Inc. | 0,02 | −0,20 | 1,56 | −16,31 | 0,2265 | −0,0512 | |||
| SPNS / Sapiens International Corporation N.V. | 0,05 | 0,06 | 1,48 | 8,03 | 0,2149 | 0,0108 | |||
| SPSC / SPS Commerce, Inc. | 0,01 | −0,18 | 1,46 | 2,31 | 0,2127 | −0,0005 | |||
| POOL / Pool Corporation | 0,01 | −1,78 | 1,46 | −10,10 | 0,2121 | −0,0299 | |||
| CCCS / CCC Intelligent Solutions Holdings Inc. | 0,14 | 9,56 | 1,33 | 14,11 | 0,1938 | 0,0196 | |||
| COO / The Cooper Companies, Inc. | 0,02 | −3,24 | 1,11 | −18,39 | 0,1618 | −0,0416 | |||
| GOOG / Alphabet Inc. | 0,01 | −0,07 | 1,09 | 13,42 | 0,1583 | 0,0151 | |||
| FCN / FTI Consulting, Inc. | 0,01 | 0,19 | 0,96 | −1,44 | 0,1394 | −0,0057 | |||
| RYCEY / Rolls-Royce Holdings plc - Depositary Receipt (Common Stock) | 0,05 | 0,67 | 0,0971 | 0,0971 | |||||
| JNJ / Johnson & Johnson | 0,00 | −96,20 | 0,64 | −96,51 | 0,0936 | −2,6515 | |||
| AMT / American Tower Corporation | 0,00 | −93,99 | 0,64 | −93,89 | 0,0932 | −1,4731 | |||
| COST / Costco Wholesale Corporation | 0,00 | −1,09 | 0,63 | 3,45 | 0,0914 | 0,0008 | |||
| EBGEF / Enbridge Inc. - Preferred Stock | 0,01 | −85,92 | 0,60 | −85,60 | 0,0875 | −0,5356 | |||
| URI / United Rentals, Inc. | 0,00 | 0,00 | 0,50 | 20,34 | 0,0722 | 0,0106 | |||
| IWF / iShares Trust - iShares Russell 1000 Growth ETF | 0,00 | 0,00 | 0,48 | 17,80 | 0,0701 | 0,0089 | |||
| NOC / Northrop Grumman Corporation | 0,00 | 0,00 | 0,44 | −2,42 | 0,0644 | −0,0033 | |||
| NVDA / NVIDIA Corporation | 0,00 | 0,38 | 0,0545 | 0,0545 | |||||
| DHR / Danaher Corporation | 0,00 | 0,00 | 0,37 | −3,66 | 0,0537 | −0,0035 | |||
| Rocket Lab USA / (773122106) | 0,01 | 0,32 | 0,0000 | ||||||
| LLY / Eli Lilly and Company | 0,00 | 0,00 | 0,31 | −5,49 | 0,0450 | −0,0039 | |||
| MMM / 3M Company | 0,00 | 0,00 | 0,30 | 3,75 | 0,0442 | 0,0004 | |||
| HON / Honeywell International Inc. | 0,00 | −9,12 | 0,29 | −0,34 | 0,0421 | −0,0011 | |||
| UNP / Union Pacific Corporation | 0,00 | −92,53 | 0,27 | −92,74 | 0,0397 | −0,5207 | |||
| RTX / RTX Corporation | 0,00 | 0,00 | 0,25 | 10,31 | 0,0358 | 0,0025 | |||
| ABT / Abbott Laboratories | 0,00 | 0,00 | 0,24 | 2,52 | 0,0355 | −0,0000 | |||
| CYBR / CyberArk Software Ltd. | 0,00 | 0,00 | 0,24 | 20,79 | 0,0354 | 0,0052 | |||
| WFC / Wells Fargo & Company | 0,00 | 0,00 | 0,24 | 11,63 | 0,0349 | 0,0028 | |||
| MSI / Motorola Solutions, Inc. | 0,00 | 0,00 | 0,24 | −4,05 | 0,0345 | −0,0024 | |||
| EW / Edwards Lifesciences Corporation | 0,00 | −9,93 | 0,23 | −2,50 | 0,0340 | −0,0019 | |||
| VTI / Vanguard Index Funds - Vanguard Total Stock Market ETF | 0,00 | 0,22 | 0,0325 | 0,0325 | |||||
| TMO / Thermo Fisher Scientific Inc. | 0,00 | −100,00 | 0,00 | 0,0000 | |||||
| MA / Mastercard Incorporated | 0,00 | −100,00 | 0,00 | 0,0000 | |||||
| ULTA / Ulta Beauty, Inc. | 0,00 | −100,00 | 0,00 | 0,0000 | |||||
| CB / Chubb Limited | 0,00 | −100,00 | 0,00 | 0,0000 | |||||
| SLB / Schlumberger Limited | 0,00 | −100,00 | 0,00 | 0,0000 | |||||
| KEYS / Keysight Technologies, Inc. | 0,00 | −100,00 | 0,00 | 0,0000 | |||||
| HPE / Hewlett Packard Enterprise Company | 0,00 | −100,00 | 0,00 | 0,0000 | |||||
| RCKT / Rocket Pharmaceuticals, Inc. | 0,00 | −100,00 | 0,00 | 0,0000 | |||||
| QCOM / QUALCOMM Incorporated | 0,00 | −100,00 | 0,00 | 0,0000 |