Grundläggande statistik
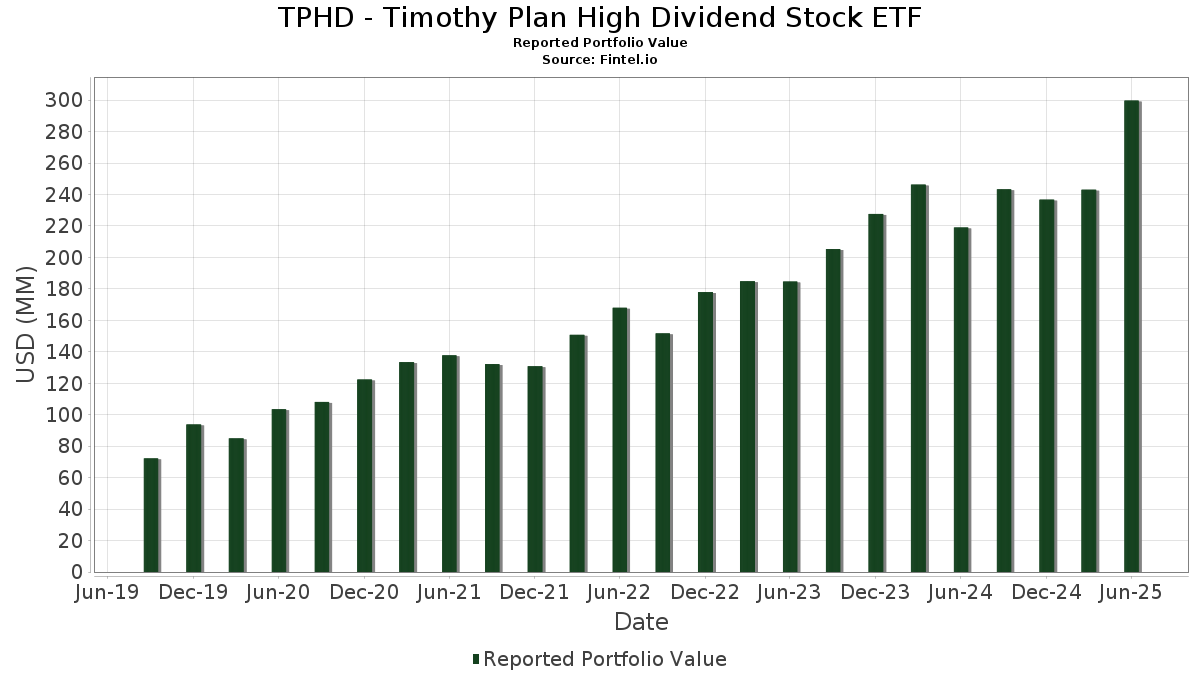
| Portföljvärde | $ 299 743 701 |
| Aktuella positioner | 101 |
Senaste innehav, resultat, förvaltat kapital (från 13F, 13D)
TPHD - Timothy Plan High Dividend Stock ETF har redovisat 101 totala innehav i sina senaste SEC-arkiveringar. Det senaste portföljvärdet beräknas vara $ 299 743 701 USD. Faktiskt förvaltade tillgångar (AUM) är detta värde plus likvida medel (som inte redovisas). TPHD - Timothy Plan High Dividend Stock ETFs största innehav är Evergy, Inc. (US:EVRG) , Atmos Energy Corporation (US:ATO) , Seagate Technology Holdings plc (US:STX) , CME Group Inc. (US:CME) , and NiSource Inc. (US:NI) . TPHD - Timothy Plan High Dividend Stock ETFs nya positioner inkluderar CME Group Inc. (US:CME) , Quest Diagnostics Incorporated (US:DGX) , Texas Roadhouse, Inc. (US:TXRH) , Texas Instruments Incorporated (US:TXN) , and The Progressive Corporation (US:PGR) .
Största ökningarna detta kvartal
Vi använder förändringen i portföljallokeringen eftersom det är det mest meningsfulla måttet. Förändringar kan bero på transaktioner eller förändringar i aktiekurser.
| Värdepapper | Aktier (MM) |
Värde (MM$) |
Portfölj % av | ΔPortfölj % av |
|---|---|---|---|---|
| 0,02 | 4,34 | 1,4416 | 1,4416 | |
| 0,02 | 3,52 | 1,1690 | 1,1690 | |
| 0,02 | 3,10 | 1,0307 | 1,0307 | |
| 0,01 | 3,00 | 0,9965 | 0,9965 | |
| 0,01 | 2,95 | 0,9810 | 0,9810 | |
| 0,02 | 2,95 | 0,9802 | 0,9802 | |
| 0,04 | 2,94 | 0,9765 | 0,9765 | |
| 0,02 | 2,87 | 0,9553 | 0,9553 | |
| 0,02 | 2,86 | 0,9523 | 0,9523 | |
| 0,03 | 4,38 | 1,4555 | 0,9032 |
Största minskningarna detta kvartal
Vi använder förändringen i portföljallokeringen eftersom det är det mest meningsfulla måttet. Förändringar kan bero på transaktioner eller förändringar i aktiepriser.
| Värdepapper | Aktier (MM) |
Värde (MM$) |
Portfölj % av | ΔPortfölj % av |
|---|---|---|---|---|
| 0,03 | 2,49 | 0,8289 | −0,8465 | |
| 0,01 | 2,48 | 0,8248 | −0,5716 | |
| 0,11 | 3,13 | 1,0391 | −0,5046 | |
| 0,05 | 3,01 | 0,9995 | −0,4630 | |
| 0,03 | 3,27 | 1,0884 | −0,3915 | |
| 0,03 | 2,61 | 0,8688 | −0,3242 | |
| 0,02 | 3,34 | 1,1119 | −0,3235 | |
| 0,11 | 4,28 | 1,4219 | −0,3019 | |
| 0,04 | 3,73 | 1,2395 | −0,3007 | |
| 0,05 | 2,58 | 0,8590 | −0,2954 |
13F- och fond arkiveringar
Denna blankett lämnades in den 2025-08-28 för rapporteringsperioden 2025-06-30. Klicka på länksymbolen för att se hela transaktionshistoriken.
Uppgradera för att låsa upp premiumdata och exportera till Excel![]() .
.
| Värdepapper | Typ | Genomsnittligt aktiepris | Aktier (MM) |
ΔAktier (%) |
ΔAktier (%) |
Värde ($MM) |
Portfölj (%) |
ΔPortfölj (%) |
|
|---|---|---|---|---|---|---|---|---|---|
| EVRG / Evergy, Inc. | 0,07 | 28,24 | 4,90 | 28,21 | 1,6274 | 0,0656 | |||
| ATO / Atmos Energy Corporation | 0,03 | 7,68 | 4,39 | 7,36 | 1,4595 | −0,2133 | |||
| STX / Seagate Technology Holdings plc | 0,03 | 90,86 | 4,38 | 224,30 | 1,4555 | 0,9032 | |||
| CME / CME Group Inc. | 0,02 | 4,34 | 1,4416 | 1,4416 | |||||
| NI / NiSource Inc. | 0,11 | 0,86 | 4,28 | 1,50 | 1,4219 | −0,3019 | |||
| DTE / DTE Energy Company | 0,03 | 33,96 | 4,18 | 28,32 | 1,3905 | 0,0573 | |||
| CMS / CMS Energy Corporation | 0,06 | 23,15 | 4,13 | 13,61 | 1,3714 | −0,1141 | |||
| ITW / Illinois Tool Works Inc. | 0,02 | 18,76 | 3,93 | 18,40 | 1,3068 | −0,0513 | |||
| WEC / WEC Energy Group, Inc. | 0,04 | 11,33 | 3,92 | 6,43 | 1,3047 | −0,2034 | |||
| LNT / Alliant Energy Corporation | 0,06 | 15,24 | 3,87 | 8,29 | 1,2861 | −0,1751 | |||
| SO / The Southern Company | 0,04 | 11,17 | 3,79 | 11,01 | 1,2601 | −0,1364 | |||
| OTIS / Otis Worldwide Corporation | 0,04 | 35,91 | 3,74 | 30,37 | 1,2432 | 0,0702 | |||
| AEE / Ameren Corporation | 0,04 | 3,51 | 3,73 | −0,98 | 1,2395 | −0,3007 | |||
| CTSH / Cognizant Technology Solutions Corporation | 0,05 | 27,32 | 3,62 | 29,84 | 1,2023 | 0,0632 | |||
| AEP / American Electric Power Company, Inc. | 0,03 | 13,13 | 3,60 | 7,43 | 1,1977 | −0,1741 | |||
| PPG / PPG Industries, Inc. | 0,03 | 37,25 | 3,60 | 42,78 | 1,1971 | 0,1654 | |||
| SYY / Sysco Corporation | 0,05 | 30,94 | 3,60 | 32,16 | 1,1955 | 0,0825 | |||
| MKC / McCormick & Company, Incorporated | 0,05 | 58,84 | 3,55 | 46,35 | 1,1798 | 0,1877 | |||
| DGX / Quest Diagnostics Incorporated | 0,02 | 3,52 | 1,1690 | 1,1690 | |||||
| KMB / Kimberly-Clark Corporation | 0,03 | 31,98 | 3,46 | 19,63 | 1,1510 | −0,0328 | |||
| GD / General Dynamics Corporation | 0,01 | 4,43 | 3,46 | 11,72 | 1,1501 | −0,1164 | |||
| UNP / Union Pacific Corporation | 0,02 | 15,15 | 3,45 | 12,15 | 1,1481 | −0,1115 | |||
| AVY / Avery Dennison Corporation | 0,02 | 41,32 | 3,45 | 39,33 | 1,1461 | 0,1340 | |||
| CINF / Cincinnati Financial Corporation | 0,02 | 17,04 | 3,39 | 17,97 | 1,1265 | −0,0482 | |||
| ES / Eversource Energy | 0,05 | 20,78 | 3,37 | 28,59 | 1,1201 | 0,0616 | |||
| AFL / Aflac Incorporated | 0,03 | 32,86 | 3,35 | 26,00 | 1,1135 | 0,0263 | |||
| PAYX / Paychex, Inc. | 0,02 | 1,09 | 3,34 | −4,70 | 1,1119 | −0,3235 | |||
| LYB / LyondellBasell Industries N.V. | 0,06 | 86,18 | 3,28 | 53,05 | 1,0915 | 0,2138 | |||
| ED / Consolidated Edison, Inc. | 0,03 | −0,27 | 3,27 | −9,51 | 1,0884 | −0,3915 | |||
| CSX / CSX Corporation | 0,10 | 15,82 | 3,27 | 28,44 | 1,0884 | 0,0455 | |||
| CNP / CenterPoint Energy, Inc. | 0,09 | −3,01 | 3,26 | −1,63 | 1,0840 | −0,2721 | |||
| FIS / Fidelity National Information Services, Inc. | 0,04 | 35,89 | 3,26 | 48,11 | 1,0829 | 0,1834 | |||
| CAT / Caterpillar Inc. | 0,01 | 58,01 | 3,24 | 56,89 | 1,0781 | 0,2331 | |||
| PFG / Principal Financial Group, Inc. | 0,04 | 28,12 | 3,22 | 20,64 | 1,0709 | −0,0216 | |||
| PEG / Public Service Enterprise Group Incorporated | 0,04 | 1,38 | 3,18 | 3,71 | 1,0582 | −0,1974 | |||
| RPM / RPM International Inc. | 0,03 | 48,92 | 3,16 | 41,41 | 1,0504 | 0,1364 | |||
| EOG / EOG Resources, Inc. | 0,03 | 37,33 | 3,14 | 28,09 | 1,0429 | 0,0411 | |||
| KMI / Kinder Morgan, Inc. | 0,11 | −19,63 | 3,13 | −17,20 | 1,0391 | −0,5046 | |||
| HRL / Hormel Foods Corporation | 0,10 | 69,79 | 3,11 | 66,03 | 1,0350 | 0,2678 | |||
| PKG / Packaging Corporation of America | 0,02 | 22,97 | 3,11 | 17,04 | 1,0323 | −0,0531 | |||
| EWBC / East West Bancorp, Inc. | 0,03 | 35,51 | 3,11 | 52,50 | 1,0322 | 0,1991 | |||
| TXRH / Texas Roadhouse, Inc. | 0,02 | 3,10 | 1,0307 | 1,0307 | |||||
| OXY / Occidental Petroleum Corporation | 0,07 | 50,74 | 3,03 | 28,27 | 1,0078 | 0,0412 | |||
| ROK / Rockwell Automation, Inc. | 0,01 | 55,41 | 3,02 | 99,87 | 1,0053 | 0,3862 | |||
| WMB / The Williams Companies, Inc. | 0,05 | −19,99 | 3,01 | −15,92 | 0,9995 | −0,4630 | |||
| TXN / Texas Instruments Incorporated | 0,01 | 3,00 | 0,9965 | 0,9965 | |||||
| PSX / Phillips 66 | 0,03 | 56,77 | 2,98 | 51,50 | 0,9916 | 0,1861 | |||
| MAS / Masco Corporation | 0,05 | 77,92 | 2,98 | 64,68 | 0,9904 | 0,2503 | |||
| PGR / The Progressive Corporation | 0,01 | 2,95 | 0,9810 | 0,9810 | |||||
| SNX / TD SYNNEX Corporation | 0,02 | 2,95 | 0,9802 | 0,9802 | |||||
| FAST / Fastenal Company | 0,07 | 115,00 | 2,95 | 16,44 | 0,9795 | −0,0555 | |||
| IFF / International Flavors & Fragrances Inc. | 0,04 | 2,94 | 0,9765 | 0,9765 | |||||
| SCI / Service Corporation International | 0,04 | −0,15 | 2,91 | 1,36 | 0,9668 | −0,2070 | |||
| AWK / American Water Works Company, Inc. | 0,02 | 5,58 | 2,90 | −0,45 | 0,9631 | −0,2272 | |||
| NSC / Norfolk Southern Corporation | 0,01 | 37,78 | 2,89 | 48,94 | 0,9592 | 0,1666 | |||
| CDW / CDW Corporation | 0,02 | 2,87 | 0,9553 | 0,9553 | |||||
| IEX / IDEX Corporation | 0,02 | 2,86 | 0,9523 | 0,9523 | |||||
| CF / CF Industries Holdings, Inc. | 0,03 | 35,48 | 2,82 | 59,54 | 0,9371 | 0,2142 | |||
| MCHP / Microchip Technology Incorporated | 0,04 | 115,33 | 2,80 | 212,95 | 0,9323 | 0,5658 | |||
| SNA / Snap-on Incorporated | 0,01 | 10,00 | 2,80 | 1,56 | 0,9312 | −0,1969 | |||
| RS / Reliance, Inc. | 0,01 | 25,75 | 2,75 | 36,75 | 0,9142 | 0,0913 | |||
| CRBG / Corebridge Financial, Inc. | 0,08 | 26,23 | 2,74 | 41,96 | 0,9099 | 0,1211 | |||
| NEE / NextEra Energy, Inc. | 0,04 | 51,89 | 2,74 | 48,75 | 0,9099 | 0,1572 | |||
| COP / ConocoPhillips | 0,03 | 25,42 | 2,73 | 7,17 | 0,9090 | −0,1346 | |||
| RGA / Reinsurance Group of America, Incorporated | 0,01 | 16,86 | 2,69 | 17,69 | 0,8958 | −0,0405 | |||
| EG / Everest Group, Ltd. | 0,01 | 27,77 | 2,69 | 19,48 | 0,8935 | −0,0264 | |||
| CTRA / Coterra Energy Inc. | 0,10 | 5,75 | 2,66 | −7,13 | 0,8830 | −0,2869 | |||
| ARES / Ares Management Corporation | 0,02 | −23,28 | 2,64 | 29,20 | 0,8767 | −0,1111 | |||
| OKE / ONEOK, Inc. | 0,03 | 8,92 | 2,61 | −10,39 | 0,8688 | −0,3242 | |||
| VLO / Valero Energy Corporation | 0,02 | 45,32 | 2,61 | 47,93 | 0,8682 | 0,1459 | |||
| ADI / Analog Devices, Inc. | 0,01 | 55,65 | 2,61 | 83,72 | 0,8669 | 0,2862 | |||
| EQH / Equitable Holdings, Inc. | 0,05 | −14,99 | 2,58 | −8,43 | 0,8590 | −0,2954 | |||
| LECO / Lincoln Electric Holdings, Inc. | 0,01 | 63,39 | 2,56 | 290,84 | 0,8512 | −0,0513 | |||
| TSCO / Tractor Supply Company | 0,05 | 26,47 | 2,55 | 21,12 | 0,8485 | −0,0135 | |||
| DVN / Devon Energy Corporation | 0,08 | 54,15 | 2,55 | 31,12 | 0,8475 | 0,0522 | |||
| CHRW / C.H. Robinson Worldwide, Inc. | 0,03 | 82,86 | 2,54 | 71,35 | 0,8433 | 0,2377 | |||
| PR / Permian Resources Corporation | 0,19 | 43,10 | 2,52 | 40,77 | 0,8391 | 0,1054 | |||
| NRG / NRG Energy, Inc. | 0,02 | −9,34 | 2,52 | 52,54 | 0,8389 | 0,1621 | |||
| ETR / Entergy Corporation | 0,03 | −37,39 | 2,49 | −39,14 | 0,8289 | −0,8465 | |||
| NTAP / NetApp, Inc. | 0,02 | 75,45 | 2,49 | 112,93 | 0,8268 | 0,3488 | |||
| HUBB / Hubbell Incorporated | 0,01 | −34,03 | 2,48 | −14,03 | 0,8248 | −0,5716 | |||
| JEF / Jefferies Financial Group Inc. | 0,04 | 27,71 | 2,46 | 30,40 | 0,8172 | 0,0460 | |||
| KVUE / Kenvue Inc. | 0,11 | 24,84 | 2,40 | 8,93 | 0,7990 | −0,1032 | |||
| SLB / Schlumberger Limited | 0,07 | 47,44 | 2,39 | 19,24 | 0,7953 | −0,0255 | |||
| FANG / Diamondback Energy, Inc. | 0,02 | 69,01 | 2,39 | 45,25 | 0,7930 | 0,1212 | |||
| LEN / Lennar Corporation | 0,02 | 2,35 | 0,7822 | 0,7822 | |||||
| BKR / Baker Hughes Company | 0,06 | 7,85 | 2,30 | −5,88 | 0,7656 | −0,2356 | |||
| IP / International Paper Company | 0,05 | 31,18 | 2,30 | 15,14 | 0,7638 | −0,0524 | |||
| CPB / The Campbell's Company | 0,07 | 32,23 | 2,24 | 1,54 | 0,7450 | −0,1579 | |||
| NXPI / NXP Semiconductors N.V. | 0,01 | 62,20 | 2,24 | 86,50 | 0,7442 | 0,2531 | |||
| OVV / Ovintiv Inc. | 0,06 | 31,02 | 2,24 | 16,46 | 0,7435 | −0,0419 | |||
| WLK / Westlake Corporation | 0,03 | 136,99 | 2,21 | 19,76 | 0,7354 | −0,0196 | |||
| HAL / Halliburton Company | 0,11 | 59,62 | 2,18 | 28,21 | 0,7239 | 0,0293 | |||
| POOL / Pool Corporation | 0,01 | 2,16 | 0,7177 | 0,7177 | |||||
| NEM / Newmont Corporation | 0,04 | 2,16 | 0,7169 | 0,7169 | |||||
| GPC / Genuine Parts Company | 0,02 | 5,61 | 2,15 | 7,52 | 0,7136 | −0,1029 | |||
| NUE / Nucor Corporation | 0,02 | 24,04 | 2,12 | 33,48 | 0,7040 | 0,0553 | |||
| WSO / Watsco, Inc. | 0,00 | 15,93 | 2,03 | 0,74 | 0,6751 | −0,1496 | |||
| OWL / Blue Owl Capital Inc. | 0,10 | 24,84 | 2,00 | 19,73 | 0,6659 | −0,0187 | |||
| DG / Dollar General Corporation | 0,02 | 16,54 | 1,81 | 51,59 | 0,6007 | 0,1131 | |||
| S P 500 EMINI FUTURE SEP25 / DE (N/A) | 0,02 | 0,0070 | 0,0070 |