Grundläggande statistik
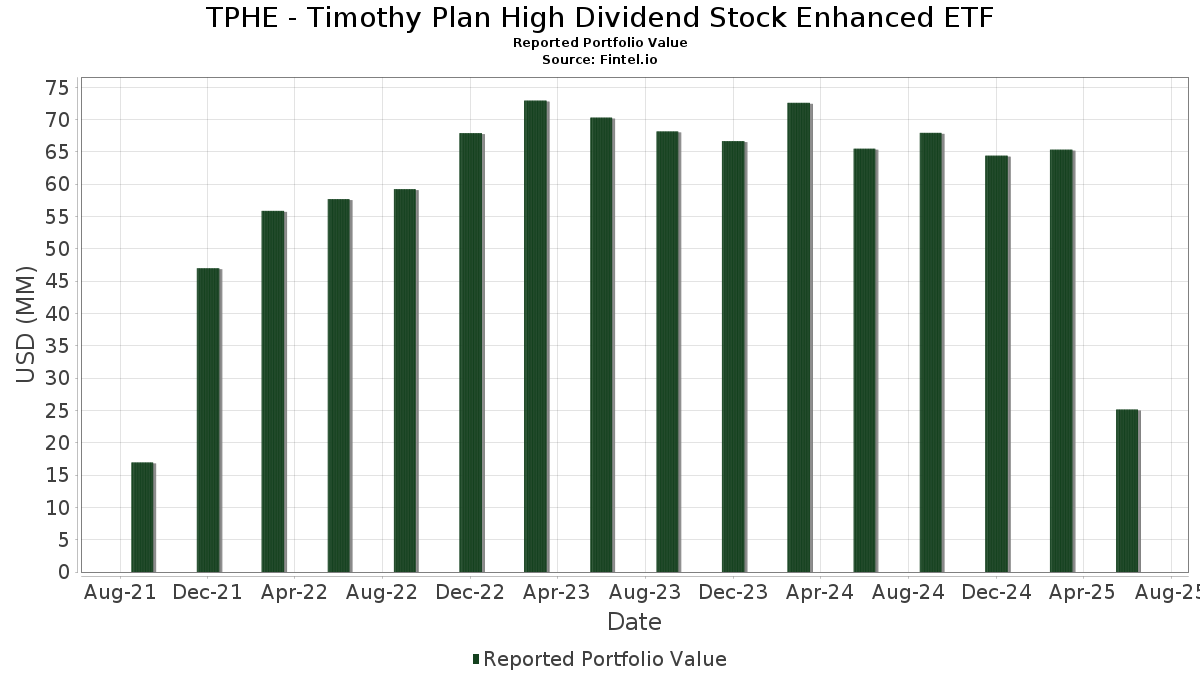
| Portföljvärde | $ 25 142 195 |
| Aktuella positioner | 101 |
Senaste innehav, resultat, förvaltat kapital (från 13F, 13D)
TPHE - Timothy Plan High Dividend Stock Enhanced ETF har redovisat 101 totala innehav i sina senaste SEC-arkiveringar. Det senaste portföljvärdet beräknas vara $ 25 142 195 USD. Faktiskt förvaltade tillgångar (AUM) är detta värde plus likvida medel (som inte redovisas). TPHE - Timothy Plan High Dividend Stock Enhanced ETFs största innehav är Evergy, Inc. (US:EVRG) , Atmos Energy Corporation (US:ATO) , Seagate Technology Holdings plc (US:STX) , CME Group Inc. (US:CME) , and NiSource Inc. (US:NI) . TPHE - Timothy Plan High Dividend Stock Enhanced ETFs nya positioner inkluderar CME Group Inc. (US:CME) , Quest Diagnostics Incorporated (US:DGX) , Texas Roadhouse, Inc. (US:TXRH) , Texas Instruments Incorporated (US:TXN) , and The Progressive Corporation (US:PGR) .
Största ökningarna detta kvartal
Vi använder förändringen i portföljallokeringen eftersom det är det mest meningsfulla måttet. Förändringar kan bero på transaktioner eller förändringar i aktiekurser.
| Värdepapper | Aktier (MM) |
Värde (MM$) |
Portfölj % av | ΔPortfölj % av |
|---|---|---|---|---|
| 0,00 | 0,36 | 1,4383 | 1,4383 | |
| 0,00 | 0,29 | 1,1673 | 1,1673 | |
| 0,00 | 0,26 | 1,0294 | 1,0294 | |
| 0,00 | 0,25 | 0,9951 | 0,9951 | |
| 0,00 | 0,25 | 0,9800 | 0,9800 | |
| 0,00 | 0,25 | 0,9783 | 0,9783 | |
| 0,00 | 0,25 | 0,9749 | 0,9749 | |
| 0,00 | 0,24 | 0,9540 | 0,9540 | |
| 0,00 | 0,24 | 0,9511 | 0,9511 | |
| 0,00 | 0,37 | 1,4530 | 0,9008 |
Största minskningarna detta kvartal
Vi använder förändringen i portföljallokeringen eftersom det är det mest meningsfulla måttet. Förändringar kan bero på transaktioner eller förändringar i aktiepriser.
| Värdepapper | Aktier (MM) |
Värde (MM$) |
Portfölj % av | ΔPortfölj % av |
|---|---|---|---|---|
| 0,00 | 0,21 | 0,8275 | −0,8583 | |
| 0,00 | 0,21 | 0,8246 | −0,5705 | |
| 0,01 | 0,26 | 1,0375 | −0,5159 | |
| 0,00 | 0,25 | 0,9980 | −0,4736 | |
| 0,00 | 0,27 | 1,0872 | −0,3923 | |
| 0,00 | 0,28 | 1,1100 | −0,3344 | |
| 0,00 | 0,22 | 0,8672 | −0,3257 | |
| 0,01 | 0,36 | 1,4195 | −0,3150 | |
| 0,00 | 0,31 | 1,2379 | −0,3119 | |
| 0,00 | 0,22 | 0,8577 | −0,2965 |
13F- och fond arkiveringar
Denna blankett lämnades in den 2025-08-28 för rapporteringsperioden 2025-06-30. Klicka på länksymbolen för att se hela transaktionshistoriken.
Uppgradera för att låsa upp premiumdata och exportera till Excel![]() .
.
| Värdepapper | Typ | Genomsnittligt aktiepris | Aktier (MM) |
ΔAktier (%) |
ΔAktier (%) |
Värde ($MM) |
Portfölj (%) |
ΔPortfölj (%) |
|
|---|---|---|---|---|---|---|---|---|---|
| EVRG / Evergy, Inc. | 0,01 | −60,23 | 0,41 | −60,31 | 1,6246 | 0,0529 | |||
| ATO / Atmos Energy Corporation | 0,00 | −66,59 | 0,37 | −66,73 | 1,4571 | −0,2257 | |||
| STX / Seagate Technology Holdings plc | 0,00 | −40,43 | 0,37 | 1,11 | 1,4530 | 0,9008 | |||
| CME / CME Group Inc. | 0,00 | 0,36 | 1,4383 | 1,4383 | |||||
| NI / NiSource Inc. | 0,01 | −68,71 | 0,36 | −68,52 | 1,4195 | −0,3150 | |||
| DTE / DTE Energy Company | 0,00 | −58,18 | 0,35 | −59,93 | 1,3882 | 0,0555 | |||
| CMS / CMS Energy Corporation | 0,00 | −61,81 | 0,34 | −64,79 | 1,3690 | −0,1258 | |||
| ITW / Illinois Tool Works Inc. | 0,00 | −63,12 | 0,33 | −63,27 | 1,3060 | −0,0605 | |||
| WEC / WEC Energy Group, Inc. | 0,00 | −65,46 | 0,33 | −67,04 | 1,3029 | −0,2146 | |||
| LNT / Alliant Energy Corporation | 0,01 | −64,24 | 0,32 | −66,39 | 1,2843 | −0,1860 | |||
| SO / The Southern Company | 0,00 | −65,51 | 0,32 | −65,61 | 1,2584 | −0,1469 | |||
| OTIS / Otis Worldwide Corporation | 0,00 | −57,58 | 0,31 | −59,32 | 1,2408 | 0,0681 | |||
| AEE / Ameren Corporation | 0,00 | −67,88 | 0,31 | −69,30 | 1,2379 | −0,3119 | |||
| CTSH / Cognizant Technology Solutions Corporation | 0,00 | −60,26 | 0,30 | −59,54 | 1,2002 | 0,0613 | |||
| AEP / American Electric Power Company, Inc. | 0,00 | −64,68 | 0,30 | −66,56 | 1,1959 | −0,1756 | |||
| PPG / PPG Industries, Inc. | 0,00 | −57,15 | 0,30 | −55,49 | 1,1953 | 0,1639 | |||
| SYY / Sysco Corporation | 0,00 | −59,12 | 0,30 | −58,73 | 1,1939 | 0,0809 | |||
| MKC / McCormick & Company, Incorporated | 0,00 | −50,39 | 0,30 | −54,32 | 1,1782 | 0,1864 | |||
| DGX / Quest Diagnostics Incorporated | 0,00 | 0,29 | 1,1673 | 1,1673 | |||||
| KMB / Kimberly-Clark Corporation | 0,00 | −58,79 | 0,29 | −62,66 | 1,1493 | −0,0342 | |||
| GD / General Dynamics Corporation | 0,00 | −67,63 | 0,29 | −65,43 | 1,1476 | −0,1267 | |||
| UNP / Union Pacific Corporation | 0,00 | −64,08 | 0,29 | −65,05 | 1,1458 | −0,1139 | |||
| AVY / Avery Dennison Corporation | 0,00 | −55,88 | 0,29 | −56,58 | 1,1444 | 0,1326 | |||
| CINF / Cincinnati Financial Corporation | 0,00 | −63,47 | 0,28 | −63,28 | 1,1245 | −0,0500 | |||
| ES / Eversource Energy | 0,00 | −65,68 | 0,28 | −63,51 | 1,1184 | 0,0592 | |||
| AFL / Aflac Incorporated | 0,00 | −58,53 | 0,28 | −60,76 | 1,1116 | 0,0245 | |||
| PAYX / Paychex, Inc. | 0,00 | −68,65 | 0,28 | −70,44 | 1,1100 | −0,3344 | |||
| LYB / LyondellBasell Industries N.V. | 0,00 | −41,87 | 0,27 | −52,18 | 1,0898 | 0,2123 | |||
| ED / Consolidated Edison, Inc. | 0,00 | −68,85 | 0,27 | −71,77 | 1,0872 | −0,3923 | |||
| CSX / CSX Corporation | 0,01 | −64,08 | 0,27 | −60,20 | 1,0866 | 0,0372 | |||
| CNP / CenterPoint Energy, Inc. | 0,01 | −69,72 | 0,27 | −69,30 | 1,0823 | −0,2736 | |||
| FIS / Fidelity National Information Services, Inc. | 0,00 | −57,57 | 0,27 | −53,74 | 1,0813 | 0,1820 | |||
| CAT / Caterpillar Inc. | 0,00 | −52,55 | 0,27 | −52,96 | 1,0754 | 0,2310 | |||
| PFG / Principal Financial Group, Inc. | 0,00 | −59,99 | 0,27 | −62,32 | 1,0695 | −0,0227 | |||
| PEG / Public Service Enterprise Group Incorporated | 0,00 | −68,55 | 0,27 | −67,92 | 1,0566 | −0,2068 | |||
| RPM / RPM International Inc. | 0,00 | −53,50 | 0,26 | −55,95 | 1,0490 | 0,1351 | |||
| EOG / EOG Resources, Inc. | 0,00 | −57,13 | 0,26 | −60,15 | 1,0411 | 0,0394 | |||
| KMI / Kinder Morgan, Inc. | 0,01 | −75,07 | 0,26 | −74,31 | 1,0375 | −0,5159 | |||
| HRL / Hormel Foods Corporation | 0,01 | −46,99 | 0,26 | −48,30 | 1,0333 | 0,2664 | |||
| EWBC / East West Bancorp, Inc. | 0,00 | −57,68 | 0,26 | −52,39 | 1,0310 | 0,1981 | |||
| PKG / Packaging Corporation of America | 0,00 | −61,62 | 0,26 | −63,47 | 1,0306 | −0,0547 | |||
| TXRH / Texas Roadhouse, Inc. | 0,00 | 0,26 | 1,0294 | 1,0294 | |||||
| OXY / Occidental Petroleum Corporation | 0,01 | −52,94 | 0,25 | −59,97 | 1,0063 | 0,0399 | |||
| ROK / Rockwell Automation, Inc. | 0,00 | −51,47 | 0,25 | −37,62 | 1,0033 | 0,3848 | |||
| WMB / The Williams Companies, Inc. | 0,00 | −75,18 | 0,25 | −73,91 | 0,9980 | −0,4736 | |||
| TXN / Texas Instruments Incorporated | 0,00 | 0,25 | 0,9951 | 0,9951 | |||||
| PSX / Phillips 66 | 0,00 | −51,03 | 0,25 | −52,66 | 0,9905 | 0,1852 | |||
| MAS / Masco Corporation | 0,00 | −44,45 | 0,25 | −48,76 | 0,9891 | 0,2491 | |||
| PGR / The Progressive Corporation | 0,00 | 0,25 | 0,9800 | 0,9800 | |||||
| SNX / TD SYNNEX Corporation | 0,00 | 0,25 | 0,9783 | 0,9783 | |||||
| FAST / Fastenal Company | 0,01 | −32,88 | 0,25 | −63,61 | 0,9780 | −0,0569 | |||
| IFF / International Flavors & Fragrances Inc. | 0,00 | 0,25 | 0,9749 | 0,9749 | |||||
| SCI / Service Corporation International | 0,00 | −68,82 | 0,24 | −68,45 | 0,9654 | −0,2081 | |||
| AWK / American Water Works Company, Inc. | 0,00 | −67,05 | 0,24 | −69,02 | 0,9615 | −0,2289 | |||
| NSC / Norfolk Southern Corporation | 0,00 | −56,99 | 0,24 | −53,67 | 0,9573 | 0,1650 | |||
| CDW / CDW Corporation | 0,00 | 0,24 | 0,9540 | 0,9540 | |||||
| IEX / IDEX Corporation | 0,00 | 0,24 | 0,9511 | 0,9511 | |||||
| CF / CF Industries Holdings, Inc. | 0,00 | −57,70 | 0,24 | −50,21 | 0,9357 | 0,2130 | |||
| MCHP / Microchip Technology Incorporated | 0,00 | −32,76 | 0,23 | −2,09 | 0,9311 | 0,5646 | |||
| SNA / Snap-on Incorporated | 0,00 | −65,69 | 0,23 | −68,39 | 0,9288 | −0,1990 | |||
| RS / Reliance, Inc. | 0,00 | −60,76 | 0,23 | −57,36 | 0,9120 | 0,0896 | |||
| CRBG / Corebridge Financial, Inc. | 0,01 | −60,59 | 0,23 | −55,73 | 0,9085 | 0,1199 | |||
| NEE / NextEra Energy, Inc. | 0,00 | −52,59 | 0,23 | −53,66 | 0,9083 | 0,1557 | |||
| COP / ConocoPhillips | 0,00 | −60,85 | 0,23 | −66,57 | 0,9077 | −0,1359 | |||
| RGA / Reinsurance Group of America, Incorporated | 0,00 | −63,54 | 0,22 | −63,40 | 0,8940 | −0,0422 | |||
| EG / Everest Group, Ltd. | 0,00 | −60,17 | 0,22 | −62,79 | 0,8915 | −0,0289 | |||
| CTRA / Coterra Energy Inc. | 0,01 | −66,98 | 0,22 | −71,11 | 0,8817 | −0,2880 | |||
| ARES / Ares Management Corporation | 0,00 | −80,58 | 0,22 | −67,31 | 0,8749 | −0,1116 | |||
| OKE / ONEOK, Inc. | 0,00 | −66,01 | 0,22 | −72,05 | 0,8672 | −0,3257 | |||
| VLO / Valero Energy Corporation | 0,00 | −54,63 | 0,22 | −53,81 | 0,8671 | 0,1448 | |||
| ADI / Analog Devices, Inc. | 0,00 | −51,46 | 0,22 | −42,74 | 0,8646 | 0,2841 | |||
| EQH / Equitable Holdings, Inc. | 0,00 | −73,46 | 0,22 | −71,49 | 0,8577 | −0,2965 | |||
| LECO / Lincoln Electric Holdings, Inc. | 0,00 | 0,21 | 0,8487 | 0,8487 | |||||
| TSCO / Tractor Supply Company | 0,00 | −60,51 | 0,21 | −62,17 | 0,8471 | −0,0146 | |||
| DVN / Devon Energy Corporation | 0,01 | −51,88 | 0,21 | −59,23 | 0,8460 | 0,0509 | |||
| CHRW / C.H. Robinson Worldwide, Inc. | 0,00 | −42,88 | 0,21 | −46,58 | 0,8424 | 0,2370 | |||
| PR / Permian Resources Corporation | 0,02 | −55,32 | 0,21 | −56,16 | 0,8378 | 0,1043 | |||
| NRG / NRG Energy, Inc. | 0,00 | −71,70 | 0,21 | −52,49 | 0,8373 | 0,1608 | |||
| ETR / Entergy Corporation | 0,00 | −80,58 | 0,21 | −81,13 | 0,8275 | −0,8583 | |||
| NTAP / NetApp, Inc. | 0,00 | −45,21 | 0,21 | −33,65 | 0,8258 | 0,3478 | |||
| HUBB / Hubbell Incorporated | 0,00 | −83,28 | 0,21 | −78,26 | 0,8246 | −0,5705 | |||
| JEF / Jefferies Financial Group Inc. | 0,00 | −60,13 | 0,21 | −59,33 | 0,8158 | 0,0449 | |||
| KVUE / Kenvue Inc. | 0,01 | −61,03 | 0,20 | −66,10 | 0,7977 | −0,1044 | |||
| SLB / Schlumberger Limited | 0,01 | −53,97 | 0,20 | −62,87 | 0,7941 | −0,0266 | |||
| FANG / Diamondback Energy, Inc. | 0,00 | −47,23 | 0,20 | −54,67 | 0,7918 | 0,1201 | |||
| LEN / Lennar Corporation | 0,00 | 0,20 | 0,7807 | 0,7807 | |||||
| BKR / Baker Hughes Company | 0,01 | −66,33 | 0,19 | −70,64 | 0,7643 | −0,2367 | |||
| IP / International Paper Company | 0,00 | −59,05 | 0,19 | −64,17 | 0,7625 | −0,0536 | |||
| CPB / The Campbell's Company | 0,01 | −58,72 | 0,19 | −68,31 | 0,7439 | −0,1589 | |||
| OVV / Ovintiv Inc. | 0,00 | −59,09 | 0,19 | −63,74 | 0,7425 | −0,0428 | |||
| NXPI / NXP Semiconductors N.V. | 0,00 | −49,41 | 0,19 | −42,06 | 0,7425 | 0,2514 | |||
| WLK / Westlake Corporation | 0,00 | −28,82 | 0,18 | −64,13 | 0,7342 | −0,0207 | |||
| HAL / Halliburton Company | 0,01 | −50,17 | 0,18 | −60,13 | 0,7227 | 0,0283 | |||
| POOL / Pool Corporation | 0,00 | 0,18 | 0,7159 | 0,7159 | |||||
| NEM / Newmont Corporation | 0,00 | 0,18 | 0,7155 | 0,7155 | |||||
| GPC / Genuine Parts Company | 0,00 | −67,02 | 0,18 | −66,42 | 0,7126 | −0,1038 | |||
| NUE / Nucor Corporation | 0,00 | −61,26 | 0,18 | −58,49 | 0,7033 | 0,0546 | |||
| WSO / Watsco, Inc. | 0,00 | −63,81 | 0,17 | −68,65 | 0,6740 | −0,1505 | |||
| OWL / Blue Owl Capital Inc. | 0,01 | −61,02 | 0,17 | −62,64 | 0,6649 | −0,0195 | |||
| DG / Dollar General Corporation | 0,00 | −63,60 | 0,15 | −52,83 | 0,6001 | 0,1126 | |||
| TOIXX / Federated Hermes Money Market Obligations Trust - Federated Hermes Tre Obli Fd Inst Shares USD | 0,11 | −50,23 | 0,11 | −50,44 | 0,4525 | 0,1028 |