Grundläggande statistik
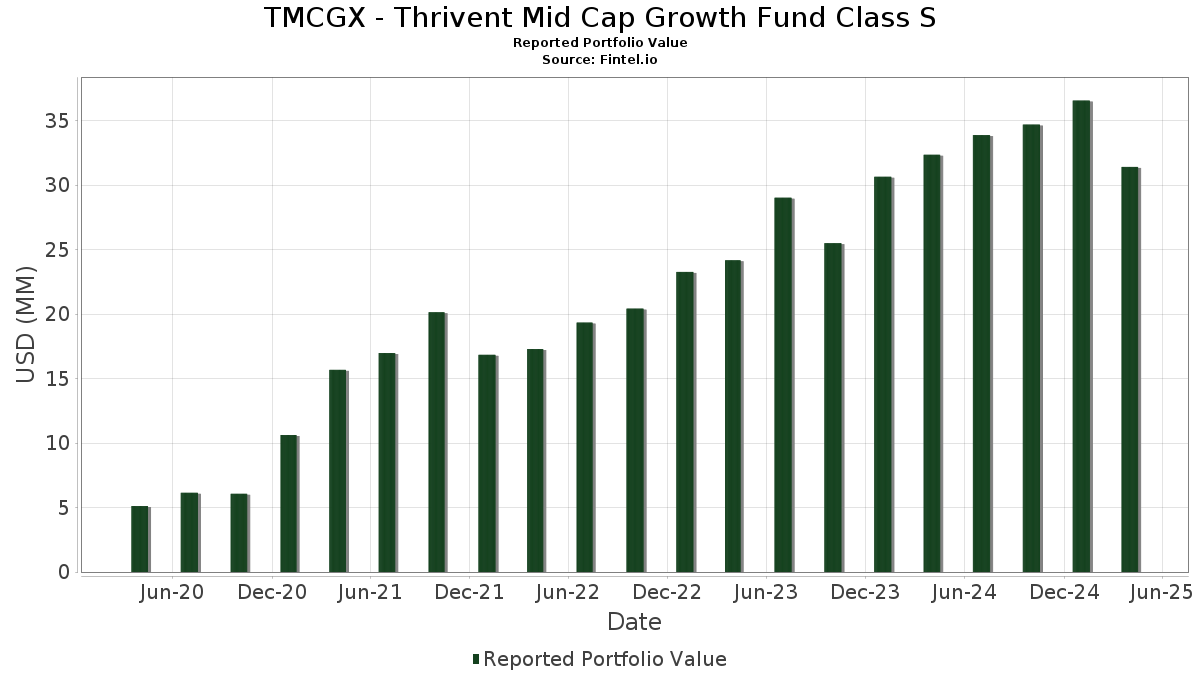
| Portföljvärde | $ 31 406 755 |
| Aktuella positioner | 83 |
Senaste innehav, resultat, förvaltat kapital (från 13F, 13D)
TMCGX - Thrivent Mid Cap Growth Fund Class S har redovisat 83 totala innehav i sina senaste SEC-arkiveringar. Det senaste portföljvärdet beräknas vara $ 31 406 755 USD. Faktiskt förvaltade tillgångar (AUM) är detta värde plus likvida medel (som inte redovisas). TMCGX - Thrivent Mid Cap Growth Fund Class Ss största innehav är Howmet Aerospace Inc. (US:HWM) , Tradeweb Markets Inc. (US:TW) , DoorDash, Inc. (US:DASH) , ExlService Holdings, Inc. (US:EXLS) , and Waste Connections, Inc. (US:WCN) . TMCGX - Thrivent Mid Cap Growth Fund Class Ss nya positioner inkluderar State Street Institutional Investment Trust - State Street Institutional US Govt Money Market Fnd Premier Cls (US:GVMXX) , Palantir Technologies Inc. (US:PLTR) , .
Största ökningarna detta kvartal
Vi använder förändringen i portföljallokeringen eftersom det är det mest meningsfulla måttet. Förändringar kan bero på transaktioner eller förändringar i aktiekurser.
| Värdepapper | Aktier (MM) |
Värde (MM$) |
Portfölj % av | ΔPortfölj % av |
|---|---|---|---|---|
| 0,53 | 0,53 | 1,7003 | 1,7003 | |
| 0,37 | 0,37 | 1,2002 | 1,2002 | |
| 0,00 | 0,69 | 2,2173 | 0,7895 | |
| 0,00 | 0,22 | 0,6998 | 0,6998 | |
| 0,00 | 0,38 | 1,2080 | 0,6860 | |
| 0,01 | 0,82 | 2,6304 | 0,5462 | |
| 0,01 | 0,78 | 2,5138 | 0,5128 | |
| 0,00 | 0,44 | 1,4253 | 0,4807 | |
| 0,00 | 0,44 | 1,4265 | 0,3764 | |
| 0,00 | 0,58 | 1,8654 | 0,3609 |
Största minskningarna detta kvartal
Vi använder förändringen i portföljallokeringen eftersom det är det mest meningsfulla måttet. Förändringar kan bero på transaktioner eller förändringar i aktiepriser.
| Värdepapper | Aktier (MM) |
Värde (MM$) |
Portfölj % av | ΔPortfölj % av |
|---|---|---|---|---|
| 0,00 | 0,22 | 0,7012 | −0,6447 | |
| 0,00 | 0,27 | 0,8766 | −0,5556 | |
| 0,00 | 0,24 | 0,7576 | −0,5131 | |
| 0,00 | 0,21 | 0,6905 | −0,3960 | |
| 0,00 | 0,31 | 0,9946 | −0,3750 | |
| 0,00 | 0,34 | 1,1006 | −0,3599 | |
| 0,00 | 0,33 | 1,0731 | −0,3564 | |
| 0,01 | 0,31 | 1,0055 | −0,3544 | |
| 0,01 | 0,41 | 1,3108 | −0,3355 | |
| 0,00 | 0,20 | 0,6406 | −0,2924 |
13F- och fond arkiveringar
Denna blankett lämnades in den 2025-06-26 för rapporteringsperioden 2025-04-30. Klicka på länksymbolen för att se hela transaktionshistoriken.
Uppgradera för att låsa upp premiumdata och exportera till Excel![]() .
.
| Värdepapper | Typ | Genomsnittligt aktiepris | Aktier (MM) |
ΔAktier (%) |
ΔAktier (%) |
Värde ($MM) |
Portfölj (%) |
ΔPortfölj (%) |
|
|---|---|---|---|---|---|---|---|---|---|
| HWM / Howmet Aerospace Inc. | 0,01 | −1,32 | 0,82 | 8,07 | 2,6304 | 0,5462 | |||
| TW / Tradeweb Markets Inc. | 0,01 | −1,33 | 0,78 | 7,58 | 2,5138 | 0,5128 | |||
| DASH / DoorDash, Inc. | 0,00 | 30,13 | 0,69 | 33,01 | 2,2173 | 0,7895 | |||
| EXLS / ExlService Holdings, Inc. | 0,01 | −1,32 | 0,58 | −4,89 | 1,8781 | 0,1892 | |||
| WCN / Waste Connections, Inc. | 0,00 | −1,31 | 0,58 | 6,04 | 1,8654 | 0,3609 | |||
| HUBS / HubSpot, Inc. | 0,00 | −1,32 | 0,55 | −22,68 | 1,7692 | −0,1871 | |||
| APH / Amphenol Corporation | 0,01 | −1,33 | 0,53 | 7,47 | 1,7122 | 0,3460 | |||
| GVMXX / State Street Institutional Investment Trust - State Street Institutional US Govt Money Market Fnd Premier Cls | 0,53 | 0,53 | 1,7003 | 1,7003 | |||||
| GWRE / Guidewire Software, Inc. | 0,00 | −1,32 | 0,52 | −4,43 | 1,6699 | 0,1753 | |||
| CRWD / CrowdStrike Holdings, Inc. | 0,00 | −1,35 | 0,50 | 6,16 | 1,6121 | 0,3137 | |||
| ROST / Ross Stores, Inc. | 0,00 | −1,32 | 0,49 | −8,96 | 1,5724 | 0,0950 | |||
| CLH / Clean Harbors, Inc. | 0,00 | 13,36 | 0,48 | 4,09 | 1,5595 | 0,2770 | |||
| TYL / Tyler Technologies, Inc. | 0,00 | −1,33 | 0,48 | −10,89 | 1,5561 | 0,0612 | |||
| FAST / Fastenal Company | 0,01 | −1,33 | 0,48 | 9,20 | 1,5298 | 0,3294 | |||
| COR / Cencora, Inc. | 0,00 | −12,97 | 0,47 | 0,21 | 1,5230 | 0,2219 | |||
| PTC / PTC Inc. | 0,00 | −1,32 | 0,46 | −21,12 | 1,4932 | −0,1239 | |||
| GMED / Globus Medical, Inc. | 0,01 | −1,33 | 0,46 | −23,54 | 1,4743 | −0,1780 | |||
| DXCM / DexCom, Inc. | 0,01 | −1,32 | 0,45 | −18,81 | 1,4458 | −0,0798 | |||
| FICO / Fair Isaac Corporation | 0,00 | −1,32 | 0,45 | 4,68 | 1,4407 | 0,2640 | |||
| FTI / TechnipFMC plc | 0,02 | −1,32 | 0,45 | −7,48 | 1,4331 | 0,1070 | |||
| DT / Dynatrace, Inc. | 0,01 | 14,62 | 0,44 | −6,74 | 1,4280 | 0,1168 | |||
| EHC / Encompass Health Corporation | 0,00 | −1,33 | 0,44 | 16,27 | 1,4265 | 0,3764 | |||
| AJG / Arthur J. Gallagher & Co. | 0,00 | 21,57 | 0,44 | 29,24 | 1,4253 | 0,4807 | |||
| CASY / Casey's General Stores, Inc. | 0,00 | −1,36 | 0,44 | 8,17 | 1,4068 | 0,2938 | |||
| CYBR / CyberArk Software Ltd. | 0,00 | −1,35 | 0,44 | −6,24 | 1,4042 | 0,1206 | |||
| CMG / Chipotle Mexican Grill, Inc. | 0,01 | 20,37 | 0,43 | 4,34 | 1,3938 | 0,2490 | |||
| TRMB / Trimble Inc. | 0,01 | −1,32 | 0,43 | −18,18 | 1,3907 | −0,0645 | |||
| IDXX / IDEXX Laboratories, Inc. | 0,00 | −1,31 | 0,42 | 1,20 | 1,3603 | 0,2093 | |||
| SN / SharkNinja, Inc. | 0,01 | 6,25 | 0,42 | −23,54 | 1,3515 | −0,1608 | |||
| ANET / Arista Networks Inc | 0,01 | 7,18 | 0,42 | −23,43 | 1,3357 | −0,1584 | |||
| HLT / Hilton Worldwide Holdings Inc. | 0,00 | 24,27 | 0,41 | 9,36 | 1,3192 | 0,2872 | |||
| TPG / TPG Inc. | 0,01 | −1,33 | 0,41 | −31,83 | 1,3108 | −0,3355 | |||
| BWXT / BWX Technologies, Inc. | 0,00 | −1,32 | 0,40 | −4,55 | 1,2856 | 0,1315 | |||
| TRU / TransUnion | 0,00 | −1,32 | 0,39 | −17,55 | 1,2580 | −0,0475 | |||
| IT / Gartner, Inc. | 0,00 | −1,28 | 0,39 | −23,58 | 1,2548 | −0,1478 | |||
| ODFL / Old Dominion Freight Line, Inc. | 0,00 | −1,32 | 0,39 | −18,45 | 1,2525 | −0,0631 | |||
| HLI / Houlihan Lokey, Inc. | 0,00 | −1,32 | 0,39 | −12,02 | 1,2519 | 0,0344 | |||
| EME / EMCOR Group, Inc. | 0,00 | −1,32 | 0,39 | −11,62 | 1,2496 | 0,0375 | |||
| CSGP / CoStar Group, Inc. | 0,01 | −1,32 | 0,38 | −4,31 | 1,2142 | 0,1265 | |||
| NTRA / Natera, Inc. | 0,00 | 132,21 | 0,38 | 98,41 | 1,2080 | 0,6860 | |||
| Thrivent Cash Management Trust / STIV (N/A) | 0,37 | 0,37 | 1,2002 | 1,2002 | |||||
| NTRS / Northern Trust Corporation | 0,00 | −1,32 | 0,37 | −17,56 | 1,1965 | −0,0436 | |||
| JKHY / Jack Henry & Associates, Inc. | 0,00 | −1,34 | 0,37 | −1,60 | 1,1883 | 0,1533 | |||
| MLM / Martin Marietta Materials, Inc. | 0,00 | −1,27 | 0,37 | −4,92 | 1,1821 | 0,1179 | |||
| RGEN / Repligen Corporation | 0,00 | −1,30 | 0,37 | −17,98 | 1,1755 | −0,0525 | |||
| KNSL / Kinsale Capital Group, Inc. | 0,00 | −20,27 | 0,36 | −21,55 | 1,1738 | −0,1057 | |||
| VST / Vistra Corp. | 0,00 | −1,31 | 0,36 | −23,89 | 1,1602 | −0,1442 | |||
| WSO / Watsco, Inc. | 0,00 | −1,39 | 0,36 | −5,26 | 1,1587 | 0,1119 | |||
| ROK / Rockwell Automation, Inc. | 0,00 | 19,35 | 0,35 | 6,31 | 1,1406 | 0,2210 | |||
| PINS / Pinterest, Inc. | 0,01 | 5,30 | 0,35 | −19,12 | 1,1323 | −0,0658 | |||
| LULU / lululemon athletica inc. | 0,00 | −1,33 | 0,34 | −35,66 | 1,1006 | −0,3599 | |||
| DECK / Deckers Outdoor Corporation | 0,00 | 22,75 | 0,34 | −23,36 | 1,0893 | −0,1263 | |||
| NVT / nVent Electric plc | 0,01 | −1,33 | 0,34 | −16,67 | 1,0781 | −0,0305 | |||
| WH / Wyndham Hotels & Resorts, Inc. | 0,00 | −20,89 | 0,33 | −35,71 | 1,0731 | −0,3564 | |||
| CARG / CarGurus, Inc. | 0,01 | −1,33 | 0,33 | −29,66 | 1,0711 | −0,2316 | |||
| FI / Fiserv, Inc. | 0,00 | −1,32 | 0,33 | −15,78 | 1,0674 | −0,0164 | |||
| POOL / Pool Corporation | 0,00 | −1,34 | 0,32 | −16,06 | 1,0443 | −0,0197 | |||
| CBRE / CBRE Group, Inc. | 0,00 | −1,31 | 0,32 | −16,84 | 1,0349 | −0,0285 | |||
| FROG / JFrog Ltd. | 0,01 | −1,32 | 0,32 | −3,95 | 1,0172 | 0,1090 | |||
| LSCC / Lattice Semiconductor Corporation | 0,01 | −1,32 | 0,31 | −15,41 | 1,0087 | −0,0110 | |||
| WMS / Advanced Drainage Systems, Inc. | 0,00 | −1,32 | 0,31 | −7,40 | 1,0080 | 0,0764 | |||
| GTLB / GitLab Inc. | 0,01 | −1,33 | 0,31 | −36,71 | 1,0055 | −0,3544 | |||
| MDB / MongoDB, Inc. | 0,00 | −1,32 | 0,31 | −37,83 | 0,9946 | −0,3750 | |||
| ARGX / argenx SE - Depositary Receipt (Common Stock) | 0,00 | −1,26 | 0,30 | −2,89 | 0,9737 | 0,1165 | |||
| SKY / Champion Homes, Inc. | 0,00 | −1,31 | 0,29 | −7,59 | 0,9429 | 0,0699 | |||
| RPM / RPM International Inc. | 0,00 | −1,33 | 0,29 | −16,62 | 0,9207 | −0,0265 | |||
| NVR / NVR, Inc. | 0,00 | −2,44 | 0,29 | −13,11 | 0,9173 | 0,0119 | |||
| XSW / SPDR Series Trust - SPDR S&P Software & Services ETF | 0,00 | −37,53 | 0,27 | −47,59 | 0,8766 | −0,5556 | |||
| US7587501039 / Regal-Beloit Corp. | 0,00 | −1,32 | 0,27 | −34,15 | 0,8638 | −0,2600 | |||
| STE / STERIS plc | 0,00 | 28,46 | 0,25 | 31,22 | 0,7999 | 0,2766 | |||
| MRVL / Marvell Technology, Inc. | 0,00 | −1,32 | 0,24 | −49,02 | 0,7576 | −0,5131 | |||
| HQY / HealthEquity, Inc. | 0,00 | −1,32 | 0,23 | −23,51 | 0,7451 | −0,0874 | |||
| XBI / SPDR Series Trust - SPDR S&P Biotech ETF | 0,00 | 36,79 | 0,23 | 22,16 | 0,7296 | 0,2195 | |||
| WST / West Pharmaceutical Services, Inc. | 0,00 | −1,30 | 0,22 | −38,96 | 0,7228 | −0,2905 | |||
| TTD / The Trade Desk, Inc. | 0,00 | −1,31 | 0,22 | −55,53 | 0,7012 | −0,6447 | |||
| PLTR / Palantir Technologies Inc. | 0,00 | 0,22 | 0,6998 | 0,6998 | |||||
| GLOB / Globant S.A. | 0,00 | −1,30 | 0,21 | −45,69 | 0,6905 | −0,3960 | |||
| HOOD / Robinhood Markets, Inc. | 0,00 | −1,32 | 0,21 | −6,61 | 0,6843 | 0,0564 | |||
| ONTO / Onto Innovation Inc. | 0,00 | −1,33 | 0,20 | −41,12 | 0,6406 | −0,2924 | |||
| PEN / Penumbra, Inc. | 0,00 | −1,33 | 0,20 | 8,33 | 0,6295 | 0,1316 | |||
| MTDR / Matador Resources Company | 0,00 | −1,33 | 0,18 | −32,71 | 0,5839 | −0,1592 | |||
| EXAS / Exact Sciences Corporation | 0,00 | −1,33 | 0,17 | −19,42 | 0,5351 | −0,0350 | |||
| KRE / SPDR Series Trust - SPDR S&P Regional Banking ETF | 0,00 | −1,33 | 0,07 | −17,24 | 0,2331 | −0,0066 |