Grundläggande statistik
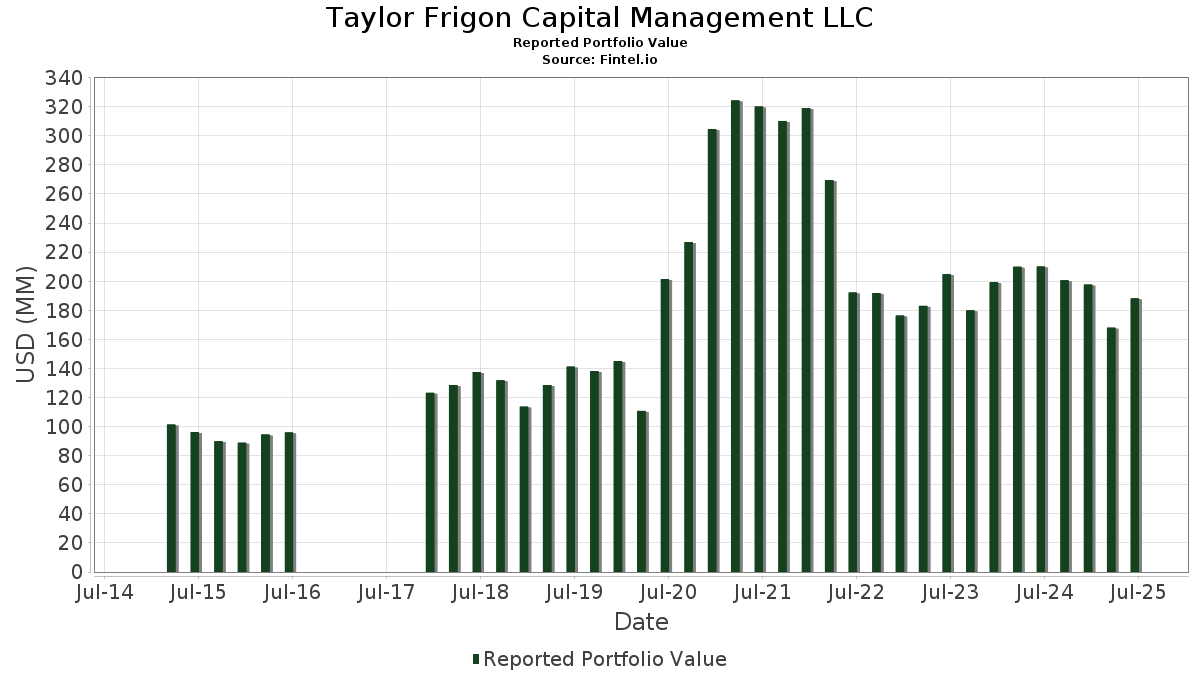
| Portföljvärde | $ 188 111 758 |
| Aktuella positioner | 90 |
Senaste innehav, resultat, förvaltat kapital (från 13F, 13D)
Taylor Frigon Capital Management LLC har redovisat 90 totala innehav i sina senaste SEC-arkiveringar. Det senaste portföljvärdet beräknas vara $ 188 111 758 USD. Faktiskt förvaltade tillgångar (AUM) är detta värde plus likvida medel (som inte redovisas). Taylor Frigon Capital Management LLCs största innehav är Credo Technology Group Holding Ltd (US:CRDO) , Monolithic Power Systems, Inc. (US:MPWR) , Carvana Co. (US:CVNA) , Cloudflare, Inc. (US:NET) , and Glaukos Corporation (US:GKOS) . Taylor Frigon Capital Management LLCs nya positioner inkluderar GitLab Inc. (US:GTLB) , .
Största ökningarna detta kvartal
Vi använder förändringen i portföljallokeringen eftersom det är det mest meningsfulla måttet. Förändringar kan bero på transaktioner eller förändringar i aktiekurser.
| Värdepapper | Aktier (MM) |
Värde (MM$) |
Portfölj % av | ΔPortfölj % av |
|---|---|---|---|---|
| 0,05 | 2,14 | 1,1377 | 1,1377 | |
| 0,05 | 4,20 | 2,2323 | 1,0660 | |
| 0,08 | 2,98 | 1,5833 | 0,5965 | |
| 0,02 | 3,37 | 1,7936 | 0,5569 | |
| 0,03 | 2,75 | 1,4617 | 0,5015 | |
| 0,09 | 2,85 | 1,5138 | 0,4029 | |
| 0,03 | 3,22 | 1,7134 | 0,3908 | |
| 0,05 | 2,78 | 1,4786 | 0,3766 | |
| 0,02 | 2,36 | 1,2553 | 0,3532 | |
| 0,00 | 2,49 | 1,3228 | 0,3269 |
Största minskningarna detta kvartal
Vi använder förändringen i portföljallokeringen eftersom det är det mest meningsfulla måttet. Förändringar kan bero på transaktioner eller förändringar i aktiepriser.
| Värdepapper | Aktier (MM) |
Värde (MM$) |
Portfölj % av | ΔPortfölj % av |
|---|---|---|---|---|
| 0,02 | 2,30 | 1,2245 | −0,6169 | |
| 0,03 | 1,63 | 0,8679 | −0,3844 | |
| 0,02 | 2,10 | 1,1181 | −0,3624 | |
| 0,16 | 1,80 | 0,9556 | −0,3169 | |
| 0,05 | 2,80 | 1,4897 | −0,3165 | |
| 0,03 | 2,14 | 1,1363 | −0,3038 | |
| 0,00 | 1,68 | 0,8948 | −0,3014 | |
| 0,13 | 2,43 | 1,2915 | −0,2681 | |
| 0,08 | 1,37 | 0,7273 | −0,2614 | |
| 0,19 | 1,73 | 0,9204 | −0,2530 |
13F- och fond arkiveringar
Denna blankett lämnades in den 2025-07-17 för rapporteringsperioden 2025-06-30. Klicka på länksymbolen för att se hela transaktionshistoriken.
Uppgradera för att låsa upp premiumdata och exportera till Excel![]() .
.
| Värdepapper | Typ | Genomsnittligt aktiepris | Aktier (MM) |
ΔAktier (%) |
ΔAktier (%) |
Värde ($MM) |
Portfölj (%) |
ΔPortfölj (%) |
|
|---|---|---|---|---|---|---|---|---|---|
| CRDO / Credo Technology Group Holding Ltd | 0,05 | −7,03 | 4,20 | 114,34 | 2,2323 | 1,0660 | |||
| MPWR / Monolithic Power Systems, Inc. | 0,00 | −11,12 | 3,53 | 12,08 | 1,8740 | 0,0018 | |||
| CVNA / Carvana Co. | 0,01 | −29,75 | 3,39 | 13,93 | 1,8006 | 0,0304 | |||
| NET / Cloudflare, Inc. | 0,02 | −6,06 | 3,37 | 62,40 | 1,7936 | 0,5569 | |||
| GKOS / Glaukos Corporation | 0,03 | 39,40 | 3,22 | 45,11 | 1,7134 | 0,3908 | |||
| MAIN / Main Street Capital Corporation | 0,05 | 12,77 | 3,01 | 17,85 | 1,6010 | 0,0796 | |||
| SYM / Symbotic Inc. | 0,08 | −6,53 | 2,98 | 79,72 | 1,5833 | 0,5965 | |||
| ALKT / Alkami Technology, Inc. | 0,09 | 32,90 | 2,85 | 52,57 | 1,5138 | 0,4029 | |||
| CYBR / CyberArk Software Ltd. | 0,01 | −4,73 | 2,84 | 11,70 | 1,5078 | −0,0041 | |||
| PCOR / Procore Technologies, Inc. | 0,04 | −5,76 | 2,83 | −2,68 | 1,5069 | −0,2266 | |||
| TMDX / TransMedics Group, Inc. | 0,02 | −33,19 | 2,82 | 33,03 | 1,5011 | 0,2379 | |||
| PRCT / PROCEPT BioRobotics Corporation | 0,05 | −6,58 | 2,80 | −7,65 | 1,4897 | −0,3165 | |||
| MBLY / Mobileye Global Inc. | 0,16 | −5,22 | 2,80 | 18,39 | 1,4890 | 0,0806 | |||
| PSTG / Pure Storage, Inc. | 0,05 | 23,22 | 2,78 | 50,24 | 1,4786 | 0,3766 | |||
| ARCC / Ares Capital Corporation | 0,13 | 20,90 | 2,77 | 19,78 | 1,4752 | 0,0964 | |||
| HTGC / Hercules Capital, Inc. | 0,15 | 32,16 | 2,77 | 25,79 | 1,4726 | 0,1613 | |||
| CAMT / Camtek Ltd. | 0,03 | 18,19 | 2,75 | 70,43 | 1,4617 | 0,5015 | |||
| ALAB / Astera Labs, Inc. | 0,03 | −6,16 | 2,68 | 42,18 | 1,4266 | 0,3032 | |||
| MNDY / monday.com Ltd. | 0,01 | −5,55 | 2,67 | 22,13 | 1,4177 | 0,1181 | |||
| FVRR / Fiverr International Ltd. | 0,09 | −5,37 | 2,65 | 10,85 | 1,4072 | −0,0148 | |||
| PI / Impinj, Inc. | 0,02 | −6,34 | 2,63 | 14,70 | 1,3982 | 0,0331 | |||
| MRVL / Marvell Technology, Inc. | 0,03 | 16,45 | 2,60 | 46,45 | 1,3827 | 0,3251 | |||
| APH / Amphenol Corporation | 0,03 | −4,16 | 2,58 | 44,34 | 1,3705 | 0,3069 | |||
| TOST / Toast, Inc. | 0,06 | −5,99 | 2,53 | 25,56 | 1,3425 | 0,1448 | |||
| IDXX / IDEXX Laboratories, Inc. | 0,00 | −6,68 | 2,52 | 19,52 | 1,3378 | 0,0842 | |||
| KLAC / KLA Corporation | 0,00 | 12,88 | 2,49 | 48,80 | 1,3228 | 0,3269 | |||
| TSEM / Tower Semiconductor Ltd. | 0,06 | −5,15 | 2,47 | 15,31 | 1,3137 | 0,0379 | |||
| KRNT / Kornit Digital Ltd. | 0,13 | −9,44 | 2,43 | −7,25 | 1,2915 | −0,2681 | |||
| AXP / American Express Company | 0,01 | −3,73 | 2,37 | 14,12 | 1,2590 | 0,0236 | |||
| ONTO / Onto Innovation Inc. | 0,02 | 40,18 | 2,36 | 16,63 | 1,2567 | 0,0498 | |||
| CCI / Crown Castle Inc. | 0,02 | 58,09 | 2,36 | 55,84 | 1,2553 | 0,3532 | |||
| DLR / Digital Realty Trust, Inc. | 0,01 | −1,90 | 2,35 | 19,37 | 1,2517 | 0,0773 | |||
| ARE / Alexandria Real Estate Equities, Inc. | 0,03 | 74,40 | 2,35 | 36,95 | 1,2474 | 0,2272 | |||
| DXCM / DexCom, Inc. | 0,03 | −5,96 | 2,34 | 20,23 | 1,2422 | 0,0850 | |||
| TW / Tradeweb Markets Inc. | 0,02 | −24,49 | 2,30 | −25,54 | 1,2245 | −0,6169 | |||
| NICE / NICE Ltd. - Depositary Receipt (Common Stock) | 0,01 | 7,45 | 2,29 | 17,46 | 1,2159 | 0,0563 | |||
| BROS / Dutch Bros Inc. | 0,03 | 12,73 | 2,27 | 24,85 | 1,2075 | 0,1244 | |||
| GDYN / Grid Dynamics Holdings, Inc. | 0,20 | 37,63 | 2,26 | 1,57 | 1,2011 | −0,1231 | |||
| MDB / MongoDB, Inc. | 0,01 | −5,80 | 2,18 | 12,35 | 1,1566 | 0,0037 | |||
| BOOT / Boot Barn Holdings, Inc. | 0,01 | −23,08 | 2,17 | 9,45 | 1,1513 | −0,0267 | |||
| CLPT / ClearPoint Neuro, Inc. | 0,18 | −5,85 | 2,15 | −5,44 | 1,1454 | −0,2112 | |||
| NVCR / NovoCure Limited | 0,12 | −5,74 | 2,14 | −5,81 | 1,1377 | −0,2153 | |||
| GTLB / GitLab Inc. | 0,05 | 2,14 | 1,1377 | 1,1377 | |||||
| CBZ / CBIZ, Inc. | 0,03 | −6,53 | 2,14 | −11,66 | 1,1363 | −0,3038 | |||
| TTAN / ServiceTitan, Inc. | 0,02 | −24,95 | 2,10 | −15,44 | 1,1181 | −0,3624 | |||
| BILL / BILL Holdings, Inc. | 0,05 | 21,81 | 2,10 | 22,59 | 1,1168 | 0,0968 | |||
| COST / Costco Wholesale Corporation | 0,00 | −4,52 | 2,09 | −0,10 | 1,1104 | −0,1338 | |||
| EW / Edwards Lifesciences Corporation | 0,03 | 0,31 | 2,08 | 8,23 | 1,1052 | −0,0381 | |||
| WIX / Wix.com Ltd. | 0,01 | −5,08 | 2,08 | −7,93 | 1,1042 | −0,2388 | |||
| EPAM / EPAM Systems, Inc. | 0,01 | 2,86 | 2,04 | 6,36 | 1,0847 | −0,0572 | |||
| FHI / Federated Hermes, Inc. | 0,04 | −2,98 | 1,89 | 5,47 | 1,0050 | −0,0621 | |||
| NSSC / Napco Security Technologies, Inc. | 0,06 | −6,05 | 1,85 | 21,18 | 0,9858 | 0,0748 | |||
| OMF / OneMain Holdings, Inc. | 0,03 | −0,85 | 1,81 | 15,63 | 0,9601 | 0,0303 | |||
| ALL / The Allstate Corporation | 0,01 | −1,62 | 1,81 | −4,35 | 0,9596 | −0,1639 | |||
| TXN / Texas Instruments Incorporated | 0,01 | −1,53 | 1,80 | 13,76 | 0,9582 | 0,0151 | |||
| GCMG / GCM Grosvenor Inc. | 0,16 | −3,76 | 1,80 | −15,91 | 0,9556 | −0,3169 | |||
| EXR / Extra Space Storage Inc. | 0,01 | −1,33 | 1,78 | −2,04 | 0,9472 | −0,1354 | |||
| CGEN / Compugen Ltd. | 0,99 | −5,21 | 1,77 | 15,61 | 0,9412 | 0,0292 | |||
| EQIX / Equinix, Inc. | 0,00 | −1,48 | 1,75 | −3,84 | 0,9319 | −0,1537 | |||
| LUCK / Lucky Strike Entertainment Corporation | 0,19 | −6,10 | 1,73 | −12,18 | 0,9204 | −0,2530 | |||
| ROL / Rollins, Inc. | 0,03 | −2,28 | 1,73 | 2,01 | 0,9183 | −0,0895 | |||
| SYK / Stryker Corporation | 0,00 | −3,05 | 1,70 | 3,04 | 0,9026 | −0,0783 | |||
| WSO / Watsco, Inc. | 0,00 | −3,59 | 1,68 | −16,23 | 0,8948 | −0,3014 | |||
| ASML / ASML Holding N.V. - Depositary Receipt (Common Stock) | 0,00 | −2,11 | 1,64 | 18,44 | 0,8708 | 0,0472 | |||
| CCOI / Cogent Communications Holdings, Inc. | 0,03 | −1,30 | 1,63 | −22,40 | 0,8679 | −0,3844 | |||
| INMD / InMode Ltd. | 0,10 | 6,05 | 1,63 | −8,06 | 0,8677 | −0,1894 | |||
| QUIK / QuickLogic Corporation | 0,26 | −4,91 | 1,62 | 14,61 | 0,8596 | 0,0199 | |||
| HR / Healthcare Realty Trust Incorporated | 0,10 | −1,35 | 1,55 | −7,43 | 0,8222 | −0,1723 | |||
| GGG / Graco Inc. | 0,02 | −1,42 | 1,52 | 1,47 | 0,8072 | −0,0835 | |||
| QCOM / QUALCOMM Incorporated | 0,01 | −0,71 | 1,50 | 2,94 | 0,7997 | −0,0702 | |||
| SYY / Sysco Corporation | 0,02 | −1,19 | 1,50 | −0,27 | 0,7992 | −0,0982 | |||
| FDS / FactSet Research Systems Inc. | 0,00 | −1,54 | 1,49 | −3,12 | 0,7924 | −0,1236 | |||
| STE / STERIS plc | 0,01 | −1,48 | 1,49 | 4,43 | 0,7901 | −0,0572 | |||
| MKC / McCormick & Company, Incorporated | 0,02 | −1,66 | 1,46 | −9,45 | 0,7745 | −0,1829 | |||
| RHP / Ryman Hospitality Properties, Inc. | 0,01 | −1,33 | 1,45 | 6,45 | 0,7726 | −0,0399 | |||
| JKHY / Jack Henry & Associates, Inc. | 0,01 | −1,21 | 1,40 | −2,51 | 0,7445 | −0,1107 | |||
| FPI / Farmland Partners Inc. | 0,12 | −1,89 | 1,39 | 1,31 | 0,7380 | −0,0780 | |||
| TSCO / Tractor Supply Company | 0,03 | −2,14 | 1,38 | −6,27 | 0,7312 | −0,1424 | |||
| IRT / Independence Realty Trust, Inc. | 0,08 | −1,14 | 1,37 | −17,59 | 0,7273 | −0,2614 | |||
| AFG / American Financial Group, Inc. | 0,01 | −1,11 | 1,36 | −5,02 | 0,7249 | −0,1293 | |||
| FAST / Fastenal Company | 0,03 | 97,10 | 1,26 | 6,78 | 0,6702 | −0,0329 | |||
| HLI / Houlihan Lokey, Inc. | 0,01 | −1,43 | 1,20 | 9,88 | 0,6386 | −0,0125 | |||
| TJX / The TJX Companies, Inc. | 0,01 | −1,38 | 1,19 | 0,00 | 0,6329 | −0,0759 | |||
| AVY / Avery Dennison Corporation | 0,01 | −1,01 | 1,17 | −2,43 | 0,6204 | −0,0915 | |||
| POOL / Pool Corporation | 0,00 | −0,93 | 1,08 | −9,31 | 0,5751 | −0,1349 | |||
| APYX / Apyx Medical Corporation | 0,48 | −6,77 | 1,08 | 53,20 | 0,5728 | 0,1539 | |||
| HD / The Home Depot, Inc. | 0,00 | −1,37 | 1,06 | −1,31 | 0,5623 | −0,0758 | |||
| TTC / The Toro Company | 0,01 | −1,45 | 1,04 | −4,24 | 0,5520 | −0,0936 | |||
| FMC / FMC Corporation | 0,02 | −1,39 | 0,98 | −2,40 | 0,5185 | −0,0765 | |||
| VUZI / Vuzix Corporation | 0,33 | −5,99 | 0,97 | 34,58 | 0,5152 | 0,0865 | |||
| NVEE / NV5 Global, Inc. | 0,00 | −100,00 | 0,00 | 0,0000 |