Grundläggande statistik
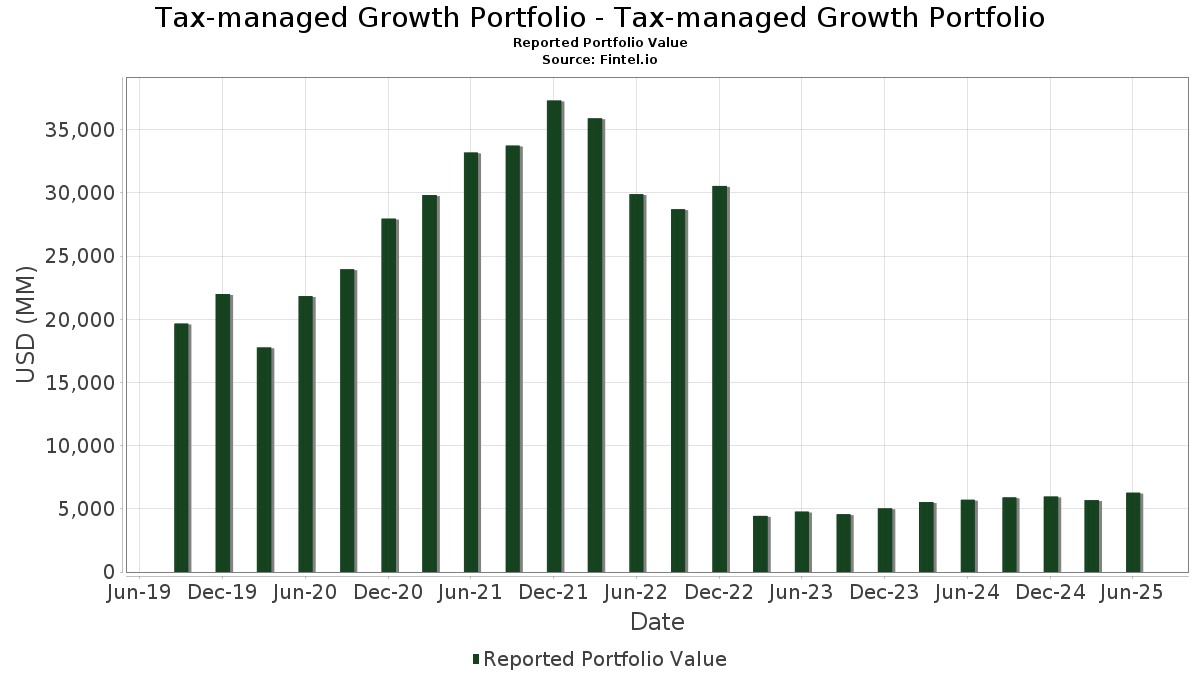
| Portföljvärde | $ 6 272 325 025 |
| Aktuella positioner | 129 |
Senaste innehav, resultat, förvaltat kapital (från 13F, 13D)
Tax-managed Growth Portfolio - Tax-managed Growth Portfolio har redovisat 129 totala innehav i sina senaste SEC-arkiveringar. Det senaste portföljvärdet beräknas vara $ 6 272 325 025 USD. Faktiskt förvaltade tillgångar (AUM) är detta värde plus likvida medel (som inte redovisas). Tax-managed Growth Portfolio - Tax-managed Growth Portfolios största innehav är Microsoft Corporation (US:MSFT) , NVIDIA Corporation (US:NVDA) , Amazon.com, Inc. (US:AMZN) , Apple Inc. (US:AAPL) , and Meta Platforms, Inc. (US:META) .
Största ökningarna detta kvartal
Vi använder förändringen i portföljallokeringen eftersom det är det mest meningsfulla måttet. Förändringar kan bero på transaktioner eller förändringar i aktiekurser.
| Värdepapper | Aktier (MM) |
Värde (MM$) |
Portfölj % av | ΔPortfölj % av |
|---|---|---|---|---|
| 2,85 | 450,91 | 7,1877 | 1,7441 | |
| 0,91 | 452,19 | 7,2080 | 1,2024 | |
| 1,73 | 378,60 | 6,0350 | 0,6293 | |
| 0,12 | 165,90 | 2,6444 | 0,6114 | |
| 0,35 | 170,13 | 2,7119 | 0,6103 | |
| 0,28 | 59,50 | 0,9484 | 0,5208 | |
| 0,15 | 31,41 | 0,5007 | 0,5007 | |
| 1,01 | 177,44 | 2,8285 | 0,4952 | |
| 0,43 | 315,82 | 5,0343 | 0,4467 | |
| 0,18 | 27,99 | 0,4461 | 0,4461 |
Största minskningarna detta kvartal
Vi använder förändringen i portföljallokeringen eftersom det är det mest meningsfulla måttet. Förändringar kan bero på transaktioner eller förändringar i aktiepriser.
| Värdepapper | Aktier (MM) |
Värde (MM$) |
Portfölj % av | ΔPortfölj % av |
|---|---|---|---|---|
| 1,67 | 343,58 | 5,4767 | −1,1912 | |
| 0,14 | 6,31 | 0,1006 | −0,5309 | |
| 0,03 | 6,00 | 0,0956 | −0,3143 | |
| 0,12 | 92,91 | 1,4810 | −0,2890 | |
| 0,74 | 80,29 | 1,2798 | −0,2790 | |
| 0,90 | 84,20 | 1,3422 | −0,1919 | |
| 0,14 | 8,96 | 0,1428 | −0,1899 | |
| 0,08 | 21,50 | 0,3428 | −0,1883 | |
| 0,25 | 24,34 | 0,3879 | −0,1558 | |
| 0,19 | 35,84 | 0,5714 | −0,1406 |
13F- och fond arkiveringar
Denna blankett lämnades in den 2025-08-25 för rapporteringsperioden 2025-06-30. Klicka på länksymbolen för att se hela transaktionshistoriken.
Uppgradera för att låsa upp premiumdata och exportera till Excel![]() .
.
| Värdepapper | Typ | Genomsnittligt aktiepris | Aktier (MM) |
ΔAktier (%) |
ΔAktier (%) |
Värde ($MM) |
Portfölj (%) |
ΔPortfölj (%) |
|
|---|---|---|---|---|---|---|---|---|---|
| MSFT / Microsoft Corporation | 0,91 | 0,00 | 452,19 | 32,50 | 7,2080 | 1,2024 | |||
| NVDA / NVIDIA Corporation | 2,85 | 0,00 | 450,91 | 45,77 | 7,1877 | 1,7441 | |||
| AMZN / Amazon.com, Inc. | 1,73 | 6,89 | 378,60 | 23,25 | 6,0350 | 0,6293 | |||
| AAPL / Apple Inc. | 1,67 | −1,83 | 343,58 | −9,32 | 5,4767 | −1,1912 | |||
| META / Meta Platforms, Inc. | 0,43 | −5,39 | 315,82 | 21,15 | 5,0343 | 0,4467 | |||
| GOOGL / Alphabet Inc. | 1,01 | 17,44 | 177,44 | 33,83 | 2,8285 | 0,4952 | |||
| BRK.B / Berkshire Hathaway Inc. | 0,35 | 56,19 | 170,13 | 42,46 | 2,7119 | 0,6103 | |||
| NFLX / Netflix, Inc. | 0,12 | 0,00 | 165,90 | 43,60 | 2,6444 | 0,6114 | |||
| JPM / JPMorgan Chase & Co. | 0,51 | 0,00 | 149,19 | 18,19 | 2,3782 | 0,1566 | |||
| GOOG / Alphabet Inc. | 0,84 | 0,00 | 148,66 | 13,54 | 2,3697 | 0,0656 | |||
| WMT / Walmart Inc. | 1,03 | 0,00 | 100,62 | 11,38 | 1,6038 | 0,0141 | |||
| LLY / Eli Lilly and Company | 0,12 | −2,13 | 92,91 | −7,62 | 1,4810 | −0,2890 | |||
| BKNG / Booking Holdings Inc. | 0,02 | 0,00 | 91,63 | 25,66 | 1,4605 | 0,1774 | |||
| GS / The Goldman Sachs Group, Inc. | 0,12 | 0,00 | 87,30 | 29,56 | 1,3916 | 0,2057 | |||
| UBER / Uber Technologies, Inc. | 0,90 | −24,57 | 84,20 | −3,41 | 1,3422 | −0,1919 | |||
| COST / Costco Wholesale Corporation | 0,08 | 0,00 | 80,51 | 4,67 | 1,2834 | −0,0703 | |||
| XOM / Exxon Mobil Corporation | 0,74 | 0,00 | 80,29 | −9,36 | 1,2798 | −0,2790 | |||
| PANW / Palo Alto Networks, Inc. | 0,37 | 9,78 | 75,77 | 31,66 | 1,2078 | 0,1950 | |||
| V / Visa Inc. | 0,21 | 0,00 | 75,56 | 1,31 | 1,2044 | −0,1081 | |||
| AVGO / Broadcom Inc. | 0,25 | 0,00 | 68,82 | 64,64 | 1,0970 | 0,3614 | |||
| ANET / Arista Networks Inc | 0,66 | 42,06 | 67,68 | 87,59 | 1,0788 | 0,4439 | |||
| DIS / The Walt Disney Company | 0,53 | 0,00 | 66,28 | 25,64 | 1,0565 | 0,1282 | |||
| BA / The Boeing Company | 0,28 | 99,34 | 59,50 | 144,90 | 0,9484 | 0,5208 | |||
| SHW / The Sherwin-Williams Company | 0,17 | 29,90 | 59,22 | 27,73 | 0,9440 | 0,1281 | |||
| NOW / ServiceNow, Inc. | 0,06 | 0,00 | 56,81 | 29,13 | 0,9056 | 0,1314 | |||
| ISRG / Intuitive Surgical, Inc. | 0,10 | 0,00 | 55,00 | 9,72 | 0,8766 | −0,0054 | |||
| NTNX / Nutanix, Inc. | 0,69 | 5,32 | 52,97 | 15,32 | 0,8444 | 0,0360 | |||
| ABT / Abbott Laboratories | 0,39 | 5,44 | 52,75 | 8,11 | 0,8408 | −0,0178 | |||
| DUK / Duke Energy Corporation | 0,42 | 0,00 | 50,00 | −3,25 | 0,7970 | −0,1125 | |||
| ORLY / O'Reilly Automotive, Inc. | 0,53 | 1 400,00 | 47,86 | −5,63 | 0,7629 | −0,1296 | |||
| LOW / Lowe's Companies, Inc. | 0,21 | 0,00 | 47,13 | −4,87 | 0,7513 | −0,1206 | |||
| ACN / Accenture plc | 0,15 | 0,00 | 44,06 | −4,21 | 0,7023 | −0,1072 | |||
| GE / General Electric Company | 0,16 | 0,00 | 41,99 | 28,60 | 0,6693 | 0,0947 | |||
| PGR / The Progressive Corporation | 0,15 | 0,00 | 40,30 | −5,71 | 0,6424 | −0,1097 | |||
| QCOM / QUALCOMM Incorporated | 0,24 | −0,32 | 38,85 | 3,34 | 0,6193 | −0,0423 | |||
| MAR / Marriott International, Inc. | 0,14 | 33,09 | 38,46 | 52,65 | 0,6131 | 0,1697 | |||
| AXP / American Express Company | 0,12 | 0,00 | 38,30 | 18,56 | 0,6105 | 0,0420 | |||
| JNJ / Johnson & Johnson | 0,25 | 0,00 | 37,50 | −7,89 | 0,5978 | −0,1187 | |||
| VRTX / Vertex Pharmaceuticals Incorporated | 0,08 | 0,00 | 37,26 | −8,17 | 0,5939 | −0,1201 | |||
| LNG / Cheniere Energy, Inc. | 0,15 | 0,00 | 36,41 | 5,24 | 0,5803 | −0,0285 | |||
| CL / Colgate-Palmolive Company | 0,40 | 0,00 | 36,12 | −2,99 | 0,5758 | −0,0795 | |||
| EMR / Emerson Electric Co. | 0,27 | 0,00 | 35,88 | 21,61 | 0,5719 | 0,0527 | |||
| ABBV / AbbVie Inc. | 0,19 | 0,00 | 35,84 | −11,41 | 0,5714 | −0,1406 | |||
| WFC / Wells Fargo & Company | 0,45 | 0,00 | 35,78 | 11,60 | 0,5704 | 0,0061 | |||
| ITW / Illinois Tool Works Inc. | 0,14 | 0,00 | 35,38 | −0,30 | 0,5639 | −0,0606 | |||
| PG / The Procter & Gamble Company | 0,22 | 0,00 | 35,16 | −6,51 | 0,5605 | −0,1014 | |||
| CSCO / Cisco Systems, Inc. | 0,50 | 0,00 | 34,90 | 12,43 | 0,5563 | 0,0100 | |||
| AMAT / Applied Materials, Inc. | 0,19 | 0,00 | 34,27 | 26,15 | 0,5462 | 0,0682 | |||
| UNP / Union Pacific Corporation | 0,15 | 0,00 | 34,18 | −2,61 | 0,5449 | −0,0728 | |||
| LIN / Linde plc | 0,07 | 0,00 | 33,94 | 0,76 | 0,5411 | −0,0518 | |||
| SCHW / The Charles Schwab Corporation | 0,37 | 0,00 | 33,88 | 16,56 | 0,5401 | 0,0285 | |||
| MCO / Moody's Corporation | 0,07 | 0,00 | 33,58 | 7,71 | 0,5352 | −0,0134 | |||
| SBUX / Starbucks Corporation | 0,36 | 0,00 | 33,09 | −6,59 | 0,5275 | −0,0959 | |||
| TXN / Texas Instruments Incorporated | 0,16 | 0,00 | 32,90 | 15,54 | 0,5244 | 0,0233 | |||
| SPOT / Spotify Technology S.A. | 0,04 | 0,00 | 32,69 | 39,51 | 0,5211 | 0,1087 | |||
| ADI / Analog Devices, Inc. | 0,13 | 0,00 | 31,82 | 18,03 | 0,5073 | 0,0328 | |||
| COF / Capital One Financial Corporation | 0,15 | 31,41 | 0,5007 | 0,5007 | |||||
| BSX / Boston Scientific Corporation | 0,29 | 0,00 | 31,13 | 6,47 | 0,4962 | −0,0183 | |||
| ADBE / Adobe Inc. | 0,08 | 0,00 | 31,10 | 0,87 | 0,4957 | −0,0468 | |||
| NKE / NIKE, Inc. | 0,42 | 0,00 | 29,75 | 11,91 | 0,4742 | 0,0064 | |||
| ECL / Ecolab Inc. | 0,11 | 0,00 | 29,64 | 6,28 | 0,4725 | −0,0183 | |||
| SYK / Stryker Corporation | 0,07 | 0,00 | 28,61 | 6,28 | 0,4560 | −0,0177 | |||
| LYV / Live Nation Entertainment, Inc. | 0,18 | 27,99 | 0,4461 | 0,4461 | |||||
| TJX / The TJX Companies, Inc. | 0,22 | 0,00 | 27,13 | 1,39 | 0,4324 | −0,0384 | |||
| AMGN / Amgen Inc. | 0,10 | 0,00 | 27,11 | −10,38 | 0,4322 | −0,1002 | |||
| CDNS / Cadence Design Systems, Inc. | 0,08 | 0,00 | 25,88 | 21,16 | 0,4125 | 0,0366 | |||
| PEP / PepsiCo, Inc. | 0,19 | 0,00 | 25,57 | −11,94 | 0,4076 | −0,1034 | |||
| WM / Waste Management, Inc. | 0,11 | 0,00 | 24,87 | −1,16 | 0,3964 | −0,0464 | |||
| HCA / HCA Healthcare, Inc. | 0,06 | 0,00 | 24,55 | 10,87 | 0,3913 | 0,0016 | |||
| LRCX / Lam Research Corporation | 0,25 | −41,18 | 24,34 | −21,24 | 0,3879 | −0,1558 | |||
| PM / Philip Morris International Inc. | 0,13 | −0,23 | 23,25 | 14,48 | 0,3706 | 0,0132 | |||
| RTX / RTX Corporation | 0,16 | 0,00 | 22,92 | 10,23 | 0,3654 | −0,0005 | |||
| ARGX / argenx SE - Depositary Receipt (Common Stock) | 0,04 | 0,00 | 22,75 | −6,87 | 0,3627 | −0,0673 | |||
| BAC / Bank of America Corporation | 0,47 | −0,23 | 22,40 | 13,13 | 0,3571 | 0,0086 | |||
| PH / Parker-Hannifin Corporation | 0,03 | 0,00 | 22,25 | 14,91 | 0,3547 | 0,0139 | |||
| CRM / Salesforce, Inc. | 0,08 | −29,88 | 21,50 | −28,75 | 0,3428 | −0,1883 | |||
| CAT / Caterpillar Inc. | 0,06 | 0,00 | 21,37 | 17,71 | 0,3407 | 0,0212 | |||
| ADP / Automatic Data Processing, Inc. | 0,07 | 0,00 | 21,05 | 0,94 | 0,3355 | −0,0314 | |||
| MA / Mastercard Incorporated | 0,04 | 0,00 | 20,59 | 2,52 | 0,3282 | −0,0252 | |||
| FITB / Fifth Third Bancorp | 0,49 | −0,10 | 20,19 | 4,81 | 0,3218 | −0,0172 | |||
| A / Agilent Technologies, Inc. | 0,15 | 0,00 | 17,87 | 0,88 | 0,2848 | −0,0269 | |||
| ROST / Ross Stores, Inc. | 0,14 | 0,00 | 17,80 | −0,16 | 0,2837 | −0,0300 | |||
| CBOE / Cboe Global Markets, Inc. | 0,08 | 0,00 | 17,69 | 3,06 | 0,2820 | −0,0201 | |||
| COP / ConocoPhillips | 0,19 | 0,00 | 17,43 | −14,55 | 0,2778 | −0,0811 | |||
| FDX / FedEx Corporation | 0,08 | −0,36 | 17,27 | −7,09 | 0,2752 | −0,0518 | |||
| SPGI / S&P Global Inc. | 0,03 | 0,00 | 16,88 | 3,78 | 0,2690 | −0,0172 | |||
| ROK / Rockwell Automation, Inc. | 0,05 | 0,00 | 16,85 | 28,56 | 0,2686 | 0,0379 | |||
| DOV / Dover Corporation | 0,09 | −0,13 | 16,71 | 4,17 | 0,2664 | −0,0159 | |||
| NSC / Norfolk Southern Corporation | 0,06 | −0,13 | 16,63 | 7,94 | 0,2651 | −0,0061 | |||
| DE / Deere & Company | 0,03 | 0,00 | 16,41 | 8,34 | 0,2616 | −0,0050 | |||
| AFL / Aflac Incorporated | 0,15 | −0,32 | 16,23 | −5,46 | 0,2587 | −0,0434 | |||
| MRK / Merck & Co., Inc. | 0,20 | −0,13 | 16,08 | −11,93 | 0,2563 | −0,0650 | |||
| AJG / Arthur J. Gallagher & Co. | 0,05 | 0,00 | 15,06 | −7,28 | 0,2401 | −0,0458 | |||
| VRSK / Verisk Analytics, Inc. | 0,05 | 0,00 | 14,58 | 4,66 | 0,2323 | −0,0127 | |||
| CARR / Carrier Global Corporation | 0,19 | 0,00 | 13,85 | 15,44 | 0,2207 | 0,0096 | |||
| TFC / Truist Financial Corporation | 0,31 | 0,00 | 13,39 | 4,47 | 0,2135 | −0,0121 | |||
| ORCL / Oracle Corporation | 0,06 | −2,24 | 13,33 | 52,87 | 0,2125 | 0,0590 | |||
| TSCO / Tractor Supply Company | 0,25 | 0,00 | 13,23 | −4,23 | 0,2110 | −0,0322 | |||
| AR / Antero Resources Corporation | 0,33 | 0,00 | 13,23 | −0,40 | 0,2109 | −0,0229 | |||
| MKL / Markel Group Inc. | 0,01 | 0,00 | 12,71 | 6,84 | 0,2026 | −0,0068 | |||
| MPC / Marathon Petroleum Corporation | 0,07 | 0,00 | 11,50 | 14,01 | 0,1833 | 0,0058 | |||
| BK / The Bank of New York Mellon Corporation | 0,13 | −0,46 | 11,40 | 8,13 | 0,1817 | −0,0038 | |||
| ICE / Intercontinental Exchange, Inc. | 0,06 | 0,00 | 11,19 | 6,36 | 0,1783 | −0,0068 | |||
| GD / General Dynamics Corporation | 0,04 | 0,00 | 10,95 | 7,00 | 0,1746 | −0,0056 | |||
| WCN / Waste Connections, Inc. | 0,06 | 0,00 | 10,80 | −4,34 | 0,1722 | −0,0265 | |||
| FTNT / Fortinet, Inc. | 0,10 | 0,00 | 10,57 | 9,83 | 0,1685 | −0,0009 | |||
| YUM / Yum! Brands, Inc. | 0,07 | −0,20 | 10,45 | −6,03 | 0,1666 | −0,0291 | |||
| MMC / Marsh & McLennan Companies, Inc. | 0,05 | −0,52 | 10,08 | −10,87 | 0,1607 | −0,0384 | |||
| GEHC / GE HealthCare Technologies Inc. | 0,14 | 0,00 | 10,04 | −8,23 | 0,1600 | −0,0325 | |||
| CME / CME Group Inc. | 0,04 | 0,00 | 10,04 | 3,89 | 0,1600 | −0,0100 | |||
| AME / AMETEK, Inc. | 0,05 | 0,00 | 9,93 | 5,13 | 0,1583 | −0,0079 | |||
| AON / Aon plc | 0,03 | 0,00 | 9,68 | −10,61 | 0,1543 | −0,0363 | |||
| DD / DuPont de Nemours, Inc. | 0,14 | 0,00 | 9,35 | −8,15 | 0,1491 | −0,0301 | |||
| MNST / Monster Beverage Corporation | 0,14 | −55,73 | 8,96 | −52,61 | 0,1428 | −0,1899 | |||
| NOC / Northrop Grumman Corporation | 0,02 | 0,00 | 8,06 | −2,35 | 0,1284 | −0,0168 | |||
| BLK / BlackRock, Inc. | 0,01 | 0,00 | 7,65 | 10,86 | 0,1219 | 0,0005 | |||
| MKC / McCormick & Company, Incorporated | 0,10 | −0,29 | 7,28 | −8,14 | 0,1160 | −0,0234 | |||
| US61747C7074 / Morgan Stanley Institutional Liquidity Funds Government Portfolio, Institutional Class | 7,05 | −46,54 | 7,05 | −46,54 | 0,1123 | −0,1196 | |||
| ZBH / Zimmer Biomet Holdings, Inc. | 0,08 | −0,30 | 7,01 | −19,65 | 0,1117 | −0,0418 | |||
| J / Jacobs Solutions Inc. | 0,05 | −1,07 | 6,86 | 7,57 | 0,1094 | −0,0029 | |||
| SLB / Schlumberger Limited | 0,20 | −1,35 | 6,86 | −20,23 | 0,1093 | −0,0420 | |||
| CHRW / C.H. Robinson Worldwide, Inc. | 0,07 | −0,31 | 6,74 | −6,59 | 0,1075 | −0,0196 | |||
| BMY / Bristol-Myers Squibb Company | 0,14 | −76,83 | 6,31 | −82,41 | 0,1006 | −0,5309 | |||
| WDAY / Workday, Inc. | 0,03 | −18,21 | 6,20 | −15,96 | 0,0988 | −0,0310 | |||
| PSX / Phillips 66 | 0,05 | 0,00 | 6,19 | −3,39 | 0,0986 | −0,0141 | |||
| DHR / Danaher Corporation | 0,03 | −73,28 | 6,00 | −74,25 | 0,0956 | −0,3143 | |||
| RF / Regions Financial Corporation | 0,25 | −1,42 | 5,87 | 6,71 | 0,0936 | −0,0032 | |||
| UPS / United Parcel Service, Inc. | 0,05 | −21,95 | 5,54 | −28,39 | 0,0884 | −0,0478 | |||
| TRV / The Travelers Companies, Inc. | 0,02 | 0,00 | 5,45 | 1,17 | 0,0868 | −0,0079 |