Grundläggande statistik
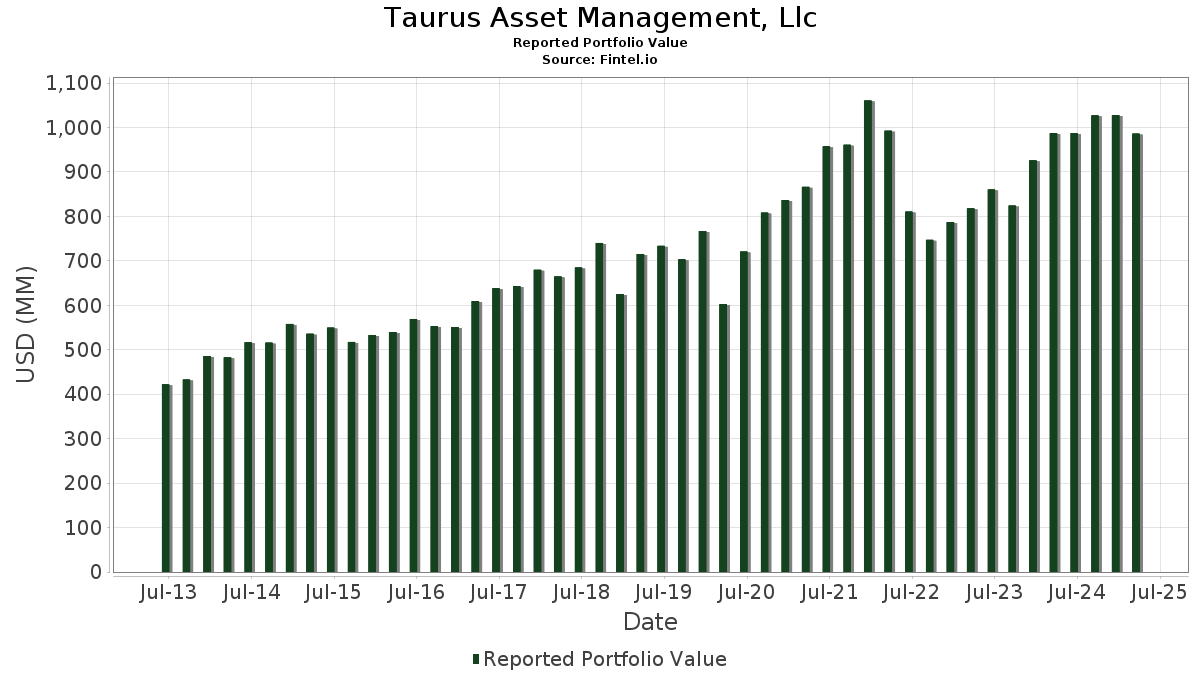
| Portföljvärde | $ 986 165 320 |
| Aktuella positioner | 87 |
Senaste innehav, resultat, förvaltat kapital (från 13F, 13D)
Taurus Asset Management, Llc har redovisat 87 totala innehav i sina senaste SEC-arkiveringar. Det senaste portföljvärdet beräknas vara $ 986 165 320 USD. Faktiskt förvaltade tillgångar (AUM) är detta värde plus likvida medel (som inte redovisas). Taurus Asset Management, Llcs största innehav är Apple Inc. (US:AAPL) , Microsoft Corporation (US:MSFT) , JPMorgan Chase & Co. (US:JPM) , Amazon.com, Inc. (US:AMZN) , and Visa Inc. (US:V) .
Största ökningarna detta kvartal
Vi använder förändringen i portföljallokeringen eftersom det är det mest meningsfulla måttet. Förändringar kan bero på transaktioner eller förändringar i aktiekurser.
| Värdepapper | Aktier (MM) |
Värde (MM$) |
Portfölj % av | ΔPortfölj % av |
|---|---|---|---|---|
| 0,03 | 15,36 | 1,5580 | 1,4469 | |
| 0,07 | 12,50 | 1,2673 | 1,2263 | |
| 0,04 | 24,88 | 2,5227 | 0,8457 | |
| 0,12 | 41,40 | 4,1984 | 0,5040 | |
| 0,37 | 26,75 | 2,7128 | 0,3892 | |
| 0,05 | 25,41 | 2,5766 | 0,3359 | |
| 0,13 | 19,62 | 1,9891 | 0,2940 | |
| 0,20 | 49,90 | 5,0602 | 0,2594 | |
| 0,07 | 21,16 | 2,1460 | 0,2177 | |
| 0,02 | 13,45 | 1,3640 | 0,2030 |
Största minskningarna detta kvartal
Vi använder förändringen i portföljallokeringen eftersom det är det mest meningsfulla måttet. Förändringar kan bero på transaktioner eller förändringar i aktiepriser.
| Värdepapper | Aktier (MM) |
Värde (MM$) |
Portfölj % av | ΔPortfölj % av |
|---|---|---|---|---|
| 0,03 | 3,21 | 0,3255 | −1,3851 | |
| 0,25 | 39,07 | 3,9621 | −0,7087 | |
| 0,32 | 71,23 | 7,2228 | −0,6915 | |
| 0,24 | 46,54 | 4,7193 | −0,6148 | |
| 0,14 | 20,55 | 2,0833 | −0,5821 | |
| 0,09 | 25,31 | 2,5664 | −0,5266 | |
| 0,01 | 2,21 | 0,2239 | −0,4557 | |
| 0,19 | 69,93 | 7,0911 | −0,4169 | |
| 0,02 | 14,13 | 1,4330 | −0,3782 | |
| 0,15 | 30,68 | 3,1114 | −0,1813 |
13F- och fond arkiveringar
Denna blankett lämnades in den 2025-05-13 för rapporteringsperioden 2025-03-31. Klicka på länksymbolen för att se hela transaktionshistoriken.
Uppgradera för att låsa upp premiumdata och exportera till Excel![]() .
.
| Värdepapper | Typ | Genomsnittligt aktiepris | Aktier (MM) |
ΔAktier (%) |
ΔAktier (%) |
Värde ($MM) |
Portfölj (%) |
ΔPortfölj (%) |
|
|---|---|---|---|---|---|---|---|---|---|
| AAPL / Apple Inc. | 0,32 | −1,29 | 71,23 | −12,44 | 7,2228 | −0,6915 | |||
| MSFT / Microsoft Corporation | 0,19 | 1,75 | 69,93 | −9,38 | 7,0911 | −0,4169 | |||
| JPM / JPMorgan Chase & Co. | 0,20 | −1,17 | 49,90 | 1,13 | 5,0602 | 0,2594 | |||
| AMZN / Amazon.com, Inc. | 0,24 | −2,11 | 46,54 | −15,11 | 4,7193 | −0,6148 | |||
| V / Visa Inc. | 0,12 | −1,67 | 41,40 | 9,04 | 4,1984 | 0,5040 | |||
| GOOG / Alphabet Inc. | 0,25 | −0,79 | 39,07 | −18,61 | 3,9621 | −0,7087 | |||
| INTU / Intuit Inc. | 0,05 | 3,22 | 32,88 | 0,84 | 3,3340 | 0,1617 | |||
| DHR / Danaher Corporation | 0,15 | 1,52 | 30,68 | −9,33 | 3,1114 | −0,1813 | |||
| SPY / SPDR S&P 500 ETF | 0,05 | 7,01 | 28,40 | 2,13 | 2,8803 | 0,1744 | |||
| KO / The Coca-Cola Company | 0,37 | −2,62 | 26,75 | 12,02 | 2,7128 | 0,3892 | |||
| COST / Costco Wholesale Corporation | 0,03 | −0,95 | 26,71 | 2,24 | 2,7087 | 0,1668 | |||
| TMO / Thermo Fisher Scientific Inc. | 0,05 | −0,94 | 25,78 | −5,25 | 2,6140 | −0,0329 | |||
| CHD / Church & Dwight Co., Inc. | 0,23 | −6,42 | 25,69 | −1,62 | 2,6047 | 0,0645 | |||
| LIN / Linde plc | 0,05 | −0,80 | 25,41 | 10,33 | 2,5766 | 0,3359 | |||
| CRM / Salesforce, Inc. | 0,09 | −0,82 | 25,31 | −20,39 | 2,5664 | −0,5266 | |||
| ASML / ASML Holding N.V. - Depositary Receipt (Common Stock) | 0,04 | 50,97 | 24,88 | 44,34 | 2,5227 | 0,8457 | |||
| BAC / Bank of America Corporation | 0,52 | −0,46 | 21,57 | −5,49 | 2,1874 | −0,0332 | |||
| APH / Amphenol Corporation | 0,33 | −1,44 | 21,50 | −6,92 | 2,1803 | −0,0671 | |||
| MCD / McDonald's Corporation | 0,07 | −0,91 | 21,16 | 6,78 | 2,1460 | 0,2177 | |||
| GTLS / Chart Industries, Inc. | 0,14 | −0,86 | 20,55 | −25,00 | 2,0833 | −0,5821 | |||
| MMM / 3M Company | 0,13 | −1,04 | 19,62 | 12,58 | 1,9891 | 0,2940 | |||
| AME / AMETEK, Inc. | 0,11 | −1,40 | 19,45 | −5,84 | 1,9723 | −0,0374 | |||
| HD / The Home Depot, Inc. | 0,05 | −1,87 | 19,18 | −7,55 | 1,9450 | −0,0735 | |||
| NEE / NextEra Energy, Inc. | 0,25 | −1,20 | 17,38 | −2,30 | 1,7623 | 0,0315 | |||
| MDLZ / Mondelez International, Inc. | 0,25 | −8,43 | 17,21 | 4,02 | 1,7447 | 0,1354 | |||
| COO / The Cooper Companies, Inc. | 0,19 | 1,94 | 16,18 | −6,47 | 1,6410 | −0,0423 | |||
| META / Meta Platforms, Inc. | 0,03 | 1 267,03 | 15,36 | 1 246,54 | 1,5580 | 1,4469 | |||
| DIS / The Walt Disney Company | 0,15 | −0,07 | 14,85 | −11,42 | 1,5062 | −0,1252 | |||
| TXN / Texas Instruments Incorporated | 0,08 | −2,87 | 14,52 | −6,92 | 1,4722 | −0,0453 | |||
| NOW / ServiceNow, Inc. | 0,02 | 1,08 | 14,13 | −24,09 | 1,4330 | −0,3782 | |||
| NKE / NIKE, Inc. | 0,21 | 3,90 | 13,57 | −12,84 | 1,3761 | −0,1388 | |||
| ROP / Roper Technologies, Inc. | 0,02 | −0,61 | 13,45 | 12,73 | 1,3640 | 0,2030 | |||
| AVGO / Broadcom Inc. | 0,07 | 4 001,37 | 12,50 | 2 868,41 | 1,2673 | 1,2263 | |||
| ODFL / Old Dominion Freight Line, Inc. | 0,06 | 0,60 | 10,73 | −5,64 | 1,0883 | −0,0184 | |||
| REGN / Regeneron Pharmaceuticals, Inc. | 0,02 | −2,42 | 10,60 | −13,12 | 1,0747 | −0,1122 | |||
| UNP / Union Pacific Corporation | 0,04 | 3,57 | 10,41 | 7,30 | 1,0556 | 0,1117 | |||
| EOG / EOG Resources, Inc. | 0,07 | −8,59 | 8,80 | −4,38 | 0,8927 | −0,0030 | |||
| NVDD / Direxion Shares ETF Trust - Direxion Daily NVDA Bear 1X Shares | 0,06 | 0,36 | 6,03 | −19,01 | 0,6119 | −0,1129 | |||
| PEP / PepsiCo, Inc. | 0,04 | −0,36 | 5,62 | −1,75 | 0,5702 | 0,0134 | |||
| JNJ / Johnson & Johnson | 0,03 | −2,19 | 5,20 | 12,18 | 0,5269 | 0,0762 | |||
| AXP / American Express Company | 0,01 | −2,07 | 3,82 | −11,23 | 0,3874 | −0,0313 | |||
| XOM / Exxon Mobil Corporation | 0,03 | 0,00 | 3,41 | 10,55 | 0,3454 | 0,0457 | |||
| AMD / Advanced Micro Devices, Inc. | 0,03 | −78,53 | 3,21 | −81,74 | 0,3255 | −1,3851 | |||
| VLTO / Veralto Corporation | 0,03 | −12,11 | 2,87 | −15,93 | 0,2907 | −0,0410 | |||
| ACN / Accenture plc | 0,01 | −64,37 | 2,21 | −68,40 | 0,2239 | −0,4557 | |||
| SBUX / Starbucks Corporation | 0,02 | −0,46 | 2,14 | 7,01 | 0,2168 | 0,0224 | |||
| LLY / Eli Lilly and Company | 0,00 | −1,65 | 1,97 | 5,23 | 0,2000 | 0,0176 | |||
| CVX / Chevron Corporation | 0,01 | −8,07 | 1,79 | 6,19 | 0,1811 | 0,0175 | |||
| BRK.A / Berkshire Hathaway Inc. | 0,00 | 0,00 | 1,60 | 17,27 | 0,1619 | 0,0294 | |||
| GJR / Strats Trust For Procter & Gambel Security - Preferred Security | 0,01 | −2,28 | 1,57 | −0,63 | 0,1588 | 0,0054 | |||
| ABT / Abbott Laboratories | 0,01 | 0,00 | 1,44 | 17,32 | 0,1456 | 0,0265 | |||
| ABBV / AbbVie Inc. | 0,01 | −0,40 | 1,29 | 17,49 | 0,1308 | 0,0239 | |||
| GOOGL / Alphabet Inc. | 0,01 | −0,80 | 1,16 | −18,92 | 0,1173 | −0,0216 | |||
| CAT / Caterpillar Inc. | 0,00 | 0,00 | 1,04 | −9,08 | 0,1056 | −0,0058 | |||
| PFE / Pfizer Inc. | 0,04 | −5,74 | 1,03 | −9,93 | 0,1040 | −0,0068 | |||
| BSX / Boston Scientific Corporation | 0,01 | 0,00 | 1,01 | 12,88 | 0,1023 | 0,0154 | |||
| CL / Colgate-Palmolive Company | 0,01 | −7,75 | 1,00 | −4,92 | 0,1018 | −0,0009 | |||
| PM / Philip Morris International Inc. | 0,01 | −3,07 | 1,00 | 27,88 | 0,1015 | 0,0253 | |||
| MA / Mastercard Incorporated | 0,00 | 0,00 | 0,96 | 4,00 | 0,0975 | 0,0076 | |||
| VOO / Vanguard Index Funds - Vanguard S&P 500 ETF | 0,00 | −9,66 | 0,89 | −13,77 | 0,0902 | −0,0102 | |||
| WSM / Williams-Sonoma, Inc. | 0,01 | 0,00 | 0,79 | −14,59 | 0,0802 | −0,0099 | |||
| YUM / Yum! Brands, Inc. | 0,00 | 0,00 | 0,76 | 17,39 | 0,0767 | 0,0140 | |||
| MO / Altria Group, Inc. | 0,01 | −2,57 | 0,68 | 11,78 | 0,0693 | 0,0098 | |||
| ADI / Analog Devices, Inc. | 0,00 | 0,00 | 0,55 | −5,00 | 0,0559 | −0,0006 | |||
| BRK.B / Berkshire Hathaway Inc. | 0,00 | −8,89 | 0,55 | 7,07 | 0,0554 | 0,0057 | |||
| GE / General Electric Company | 0,00 | 0,00 | 0,53 | 19,86 | 0,0539 | 0,0108 | |||
| IDXX / IDEXX Laboratories, Inc. | 0,00 | 0,00 | 0,51 | 1,58 | 0,0522 | 0,0029 | |||
| LOW / Lowe's Companies, Inc. | 0,00 | 0,00 | 0,50 | −5,49 | 0,0506 | −0,0008 | |||
| AMGN / Amgen Inc. | 0,00 | −1,67 | 0,46 | 17,69 | 0,0466 | 0,0086 | |||
| SPGI / S&P Global Inc. | 0,00 | 0,00 | 0,43 | 1,90 | 0,0436 | 0,0026 | |||
| GS / The Goldman Sachs Group, Inc. | 0,00 | 0,00 | 0,42 | −4,55 | 0,0427 | −0,0002 | |||
| RTX / RTX Corporation | 0,00 | 0,00 | 0,39 | 14,58 | 0,0399 | 0,0065 | |||
| PODD / Insulet Corporation | 0,00 | 0,00 | 0,37 | 0,54 | 0,0379 | 0,0018 | |||
| ORCL / Oracle Corporation | 0,00 | 0,00 | 0,36 | −15,93 | 0,0364 | −0,0052 | |||
| MRK / Merck & Co., Inc. | 0,00 | 0,00 | 0,31 | −9,91 | 0,0314 | −0,0020 | |||
| BLK / BlackRock, Inc. | 0,00 | 0,00 | 0,28 | −7,82 | 0,0288 | −0,0011 | |||
| CMCSA / Comcast Corporation | 0,01 | −19,98 | 0,28 | −21,29 | 0,0285 | −0,0063 | |||
| IVV / iShares Trust - iShares Core S&P 500 ETF | 0,00 | 0,00 | 0,27 | −4,58 | 0,0275 | −0,0001 | |||
| HON / Honeywell International Inc. | 0,00 | −5,27 | 0,27 | −11,51 | 0,0274 | −0,0022 | |||
| APD / Air Products and Chemicals, Inc. | 0,00 | 0,00 | 0,27 | 1,51 | 0,0274 | 0,0015 | |||
| DXCM / DexCom, Inc. | 0,00 | 0,00 | 0,26 | −12,20 | 0,0263 | −0,0024 | |||
| GEV / GE Vernova Inc. | 0,00 | 0,00 | 0,25 | −7,01 | 0,0256 | −0,0009 | |||
| ROST / Ross Stores, Inc. | 0,00 | 0,00 | 0,25 | −15,82 | 0,0255 | −0,0035 | |||
| ED / Consolidated Edison, Inc. | 0,00 | 0,22 | 0,0224 | 0,0224 | |||||
| BXMT / Blackstone Mortgage Trust, Inc. | 0,01 | 0,00 | 0,22 | 15,18 | 0,0223 | 0,0037 | |||
| FTV / Fortive Corporation | 0,00 | −14,89 | 0,22 | −17,05 | 0,0223 | −0,0035 | |||
| ZTS / Zoetis Inc. | 0,00 | 0,00 | 0,21 | 1,44 | 0,0214 | 0,0011 | |||
| BX / Blackstone Inc. | 0,00 | −100,00 | 0,00 | 0,0000 | |||||
| VUG / Vanguard Index Funds - Vanguard Growth ETF | 0,00 | −100,00 | 0,00 | 0,0000 |