Grundläggande statistik
| Portföljvärde | $ 311 324 689 |
| Aktuella positioner | 96 |
Senaste innehav, resultat, förvaltat kapital (från 13F, 13D)
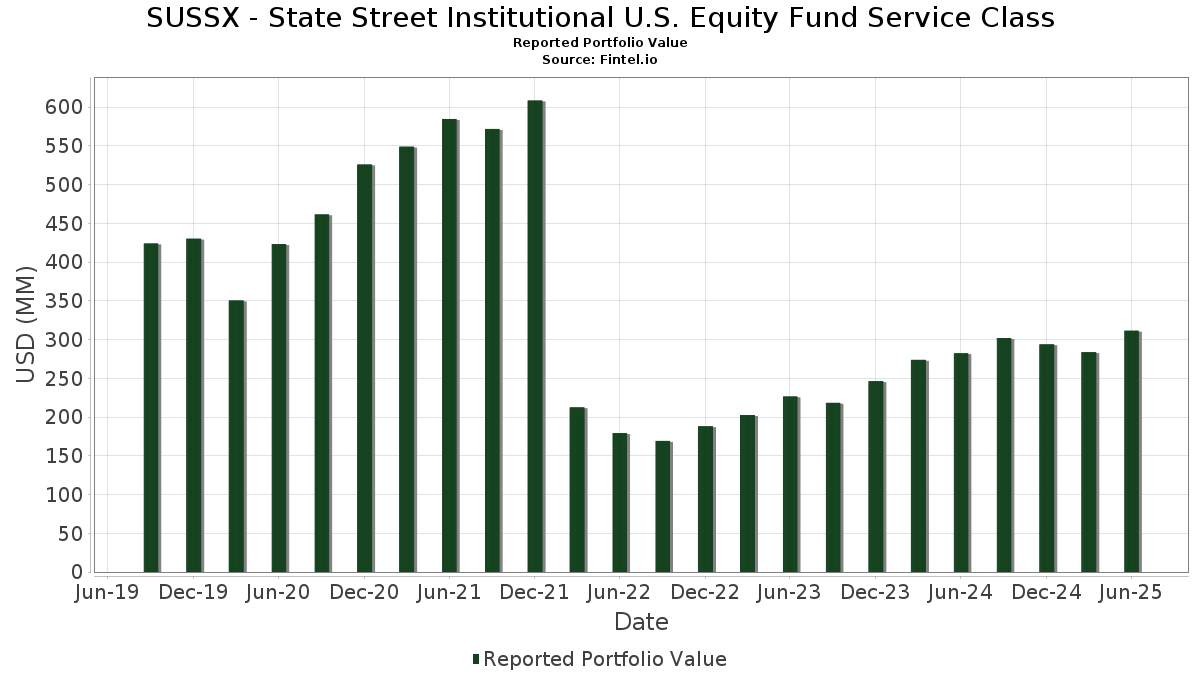
SUSSX - State Street Institutional U.S. Equity Fund Service Class har redovisat 96 totala innehav i sina senaste SEC-arkiveringar. Det senaste portföljvärdet beräknas vara $ 311 324 689 USD. Faktiskt förvaltade tillgångar (AUM) är detta värde plus likvida medel (som inte redovisas). SUSSX - State Street Institutional U.S. Equity Fund Service Classs största innehav är NVIDIA Corporation (US:NVDA) , Microsoft Corporation (US:MSFT) , Apple Inc. (US:AAPL) , Amazon.com, Inc. (US:AMZN) , and Meta Platforms, Inc. (US:META) . SUSSX - State Street Institutional U.S. Equity Fund Service Classs nya positioner inkluderar EQT Corporation (US:EQT) , CrowdStrike Holdings, Inc. (US:CRWD) , The Cooper Companies, Inc. (US:COO) , .
Största ökningarna detta kvartal
Vi använder förändringen i portföljallokeringen eftersom det är det mest meningsfulla måttet. Förändringar kan bero på transaktioner eller förändringar i aktiekurser.
| Värdepapper | Aktier (MM) |
Värde (MM$) |
Portfölj % av | ΔPortfölj % av |
|---|---|---|---|---|
| 0,17 | 26,54 | 8,5207 | 1,8829 | |
| 0,05 | 25,35 | 8,1410 | 1,5423 | |
| 0,04 | 9,87 | 3,1700 | 1,0720 | |
| 0,02 | 3,29 | 1,0564 | 1,0564 | |
| 0,01 | 4,83 | 1,5523 | 0,9170 | |
| 0,00 | 2,57 | 0,8258 | 0,8258 | |
| 0,01 | 4,00 | 1,2850 | 0,7260 | |
| 0,02 | 3,72 | 1,1943 | 0,6154 | |
| 0,02 | 12,66 | 4,0663 | 0,5475 | |
| 0,03 | 2,06 | 0,6599 | 0,3860 |
Största minskningarna detta kvartal
Vi använder förändringen i portföljallokeringen eftersom det är det mest meningsfulla måttet. Förändringar kan bero på transaktioner eller förändringar i aktiepriser.
| Värdepapper | Aktier (MM) |
Värde (MM$) |
Portfölj % av | ΔPortfölj % av |
|---|---|---|---|---|
| 4,26 | 4,26 | 1,3691 | −2,5449 | |
| 0,08 | 15,47 | 4,9685 | −1,1178 | |
| 0,02 | 2,85 | 0,9140 | −0,9375 | |
| 0,01 | 1,09 | 0,3511 | −0,8401 | |
| 0,02 | 1,84 | 0,5893 | −0,8249 | |
| 0,00 | 0,92 | 0,2950 | −0,7765 | |
| 0,00 | 1,22 | 0,3912 | −0,6262 | |
| 0,00 | 0,76 | 0,2452 | −0,5187 | |
| 0,01 | 2,75 | 0,8831 | −0,4062 | |
| 0,02 | 2,15 | 0,6895 | −0,3970 |
13F- och fond arkiveringar
Denna blankett lämnades in den 2025-08-28 för rapporteringsperioden 2025-06-30. Klicka på länksymbolen för att se hela transaktionshistoriken.
Uppgradera för att låsa upp premiumdata och exportera till Excel![]() .
.
| Värdepapper | Typ | Genomsnittligt aktiepris | Aktier (MM) |
ΔAktier (%) |
ΔAktier (%) |
Värde ($MM) |
Portfölj (%) |
ΔPortfölj (%) |
|
|---|---|---|---|---|---|---|---|---|---|
| NVDA / NVIDIA Corporation | 0,17 | −3,49 | 26,54 | 40,68 | 8,5207 | 1,8829 | |||
| MSFT / Microsoft Corporation | 0,05 | 2,04 | 25,35 | 35,21 | 8,1410 | 1,5423 | |||
| AAPL / Apple Inc. | 0,08 | −3,14 | 15,47 | −10,53 | 4,9685 | −1,1178 | |||
| AMZN / Amazon.com, Inc. | 0,07 | 1,99 | 14,68 | 17,61 | 4,7147 | 0,3211 | |||
| META / Meta Platforms, Inc. | 0,02 | −1,10 | 12,66 | 26,65 | 4,0663 | 0,5475 | |||
| GOOGL / Alphabet Inc. | 0,07 | 0,75 | 12,25 | 14,81 | 3,9325 | 0,1786 | |||
| AVGO / Broadcom Inc. | 0,04 | 0,58 | 9,87 | 65,61 | 3,1700 | 1,0720 | |||
| JPM / JPMorgan Chase & Co. | 0,02 | −9,90 | 6,69 | 6,48 | 2,1486 | −0,0629 | |||
| V / Visa Inc. | 0,02 | −2,50 | 5,67 | −1,22 | 1,8191 | −0,1992 | |||
| BAC / Bank of America Corporation | 0,12 | 6,54 | 5,45 | 20,81 | 1,7486 | 0,1623 | |||
| HD / The Home Depot, Inc. | 0,01 | 0,00 | 5,25 | 0,04 | 1,6845 | −0,1609 | |||
| GS / The Goldman Sachs Group, Inc. | 0,01 | 106,69 | 4,83 | 167,81 | 1,5523 | 0,9170 | |||
| LLY / Eli Lilly and Company | 0,01 | 38,86 | 4,77 | 31,07 | 1,5321 | 0,2509 | |||
| UBER / Uber Technologies, Inc. | 0,05 | 4,09 | 4,59 | 33,28 | 1,4741 | 0,2620 | |||
| GVMXX / State Street Institutional Investment Trust - State Street Institutional US Govt Money Market Fnd Premier Cls | 4,26 | −61,66 | 4,26 | −61,67 | 1,3691 | −2,5449 | |||
| EMR / Emerson Electric Co. | 0,03 | 10,22 | 4,21 | 34,03 | 1,3519 | 0,2465 | |||
| PH / Parker-Hannifin Corporation | 0,01 | 1,71 | 4,19 | 16,89 | 1,3447 | 0,0838 | |||
| CRM / Salesforce, Inc. | 0,01 | 147,95 | 4,00 | 151,95 | 1,2850 | 0,7260 | |||
| URI / United Rentals, Inc. | 0,01 | −1,99 | 3,93 | 17,84 | 1,2623 | 0,0881 | |||
| SPGI / S&P Global Inc. | 0,01 | 2,55 | 3,85 | 6,43 | 1,2376 | −0,0369 | |||
| UNH / UnitedHealth Group Incorporated | 0,01 | 146,83 | 3,84 | 47,01 | 1,2333 | 0,3140 | |||
| AMAT / Applied Materials, Inc. | 0,02 | 19,45 | 3,80 | 50,71 | 1,2188 | 0,3323 | |||
| BRK.B / Berkshire Hathaway Inc. | 0,01 | −2,39 | 3,79 | −10,96 | 1,2160 | −0,2809 | |||
| TXN / Texas Instruments Incorporated | 0,02 | 95,69 | 3,72 | 126,08 | 1,1943 | 0,6154 | |||
| LIN / Linde plc | 0,01 | −10,23 | 3,72 | −9,57 | 1,1931 | −0,2526 | |||
| WM / Waste Management, Inc. | 0,02 | −6,54 | 3,51 | −7,61 | 1,1265 | −0,2100 | |||
| TMO / Thermo Fisher Scientific Inc. | 0,01 | 33,35 | 3,38 | 8,64 | 1,0859 | −0,0094 | |||
| PM / Philip Morris International Inc. | 0,02 | 3,29 | 1,0564 | 1,0564 | |||||
| ADBE / Adobe Inc. | 0,01 | 32,80 | 3,17 | 33,95 | 1,0175 | 0,1850 | |||
| BR / Broadridge Financial Solutions, Inc. | 0,01 | 11,71 | 3,13 | 11,99 | 1,0044 | 0,0213 | |||
| NEE / NextEra Energy, Inc. | 0,04 | −8,61 | 2,98 | −10,49 | 0,9560 | −0,2147 | |||
| WMT / Walmart Inc. | 0,03 | 0,00 | 2,86 | 11,38 | 0,9178 | 0,0147 | |||
| JNJ / Johnson & Johnson | 0,02 | −41,26 | 2,85 | −45,90 | 0,9140 | −0,9375 | |||
| IQV / IQVIA Holdings Inc. | 0,02 | 35,75 | 2,78 | 21,36 | 0,8922 | 0,0863 | |||
| AMT / American Tower Corporation | 0,01 | −26,09 | 2,75 | −24,92 | 0,8831 | −0,4062 | |||
| SNPS / Synopsys, Inc. | 0,01 | −2,40 | 2,65 | 16,67 | 0,8517 | 0,0517 | |||
| EQIX / Equinix, Inc. | 0,00 | 2,57 | 0,8258 | 0,8258 | |||||
| MLM / Martin Marietta Materials, Inc. | 0,00 | 16,55 | 2,56 | 33,84 | 0,8232 | 0,1490 | |||
| XOM / Exxon Mobil Corporation | 0,02 | −6,66 | 2,43 | −15,41 | 0,7810 | −0,2307 | |||
| ORCL / Oracle Corporation | 0,01 | 4,37 | 2,29 | 63,27 | 0,7367 | 0,2420 | |||
| NFLX / Netflix, Inc. | 0,00 | 0,00 | 2,24 | 43,61 | 0,7181 | 0,1700 | |||
| TTEK / Tetra Tech, Inc. | 0,06 | 31,60 | 2,20 | 61,79 | 0,7070 | 0,2281 | |||
| COP / ConocoPhillips | 0,02 | −18,61 | 2,15 | −30,45 | 0,6895 | −0,3970 | |||
| CBRE / CBRE Group, Inc. | 0,02 | 25,83 | 2,14 | 34,78 | 0,6871 | 0,1285 | |||
| ETN / Eaton Corporation plc | 0,01 | 3,46 | 2,12 | 35,84 | 0,6793 | 0,1313 | |||
| KVUE / Kenvue Inc. | 0,10 | −19,65 | 2,08 | −29,88 | 0,6694 | −0,3767 | |||
| MSCI / MSCI Inc. | 0,00 | 42,27 | 2,07 | 40,79 | 0,6650 | 0,1782 | |||
| CMS / CMS Energy Corporation | 0,03 | 186,26 | 2,06 | 164,14 | 0,6599 | 0,3860 | |||
| MRK / Merck & Co., Inc. | 0,02 | −48,21 | 1,84 | −54,33 | 0,5893 | −0,8249 | |||
| ICE / Intercontinental Exchange, Inc. | 0,01 | 4,58 | 1,83 | 11,29 | 0,5886 | 0,0087 | |||
| ORLY / O'Reilly Automotive, Inc. | 0,02 | 1 400,00 | 1,82 | −5,64 | 0,5852 | −0,0944 | |||
| RTX / RTX Corporation | 0,01 | −6,97 | 1,77 | 2,55 | 0,5682 | −0,0390 | |||
| TT / Trane Technologies plc | 0,00 | −14,60 | 1,74 | 10,86 | 0,5577 | 0,0064 | |||
| TSLA / Tesla, Inc. | 0,01 | 0,00 | 1,71 | 22,58 | 0,5491 | 0,0581 | |||
| GOOG / Alphabet Inc. | 0,01 | 0,00 | 1,68 | 13,55 | 0,5408 | 0,0188 | |||
| DIS / The Walt Disney Company | 0,01 | 0,00 | 1,58 | 25,70 | 0,5057 | 0,0646 | |||
| GM / General Motors Company | 0,03 | 0,00 | 1,55 | 4,67 | 0,4968 | −0,0236 | |||
| CVX / Chevron Corporation | 0,01 | −3,09 | 1,54 | −17,04 | 0,4955 | −0,1592 | |||
| AMD / Advanced Micro Devices, Inc. | 0,01 | 0,00 | 1,52 | 38,13 | 0,4875 | 0,1007 | |||
| MCD / McDonald's Corporation | 0,01 | 0,00 | 1,50 | −6,48 | 0,4824 | −0,0828 | |||
| UNP / Union Pacific Corporation | 0,01 | −4,27 | 1,49 | −6,77 | 0,4775 | −0,0838 | |||
| SRE / Sempra | 0,02 | 4,08 | 1,48 | 10,50 | 0,4767 | 0,0040 | |||
| PEP / PepsiCo, Inc. | 0,01 | 0,00 | 1,41 | −11,93 | 0,4528 | −0,1107 | |||
| NOW / ServiceNow, Inc. | 0,00 | −30,57 | 1,39 | −10,35 | 0,4453 | −0,0990 | |||
| PGR / The Progressive Corporation | 0,01 | 1,66 | 1,36 | −4,17 | 0,4359 | −0,0625 | |||
| ABT / Abbott Laboratories | 0,01 | −10,59 | 1,35 | −8,31 | 0,4323 | −0,0845 | |||
| AZN / AstraZeneca PLC - Depositary Receipt (Common Stock) | 0,02 | 0,00 | 1,34 | −4,96 | 0,4311 | −0,0659 | |||
| MNST / Monster Beverage Corporation | 0,02 | 0,00 | 1,29 | 7,05 | 0,4147 | −0,0099 | |||
| CB / Chubb Limited | 0,00 | −56,07 | 1,22 | −57,85 | 0,3912 | −0,6262 | |||
| INTU / Intuit Inc. | 0,00 | 4,33 | 1,10 | 33,78 | 0,3538 | 0,0641 | |||
| APH / Amphenol Corporation | 0,01 | 0,00 | 1,10 | 50,55 | 0,3530 | 0,0960 | |||
| BDX / Becton, Dickinson and Company | 0,01 | −57,04 | 1,09 | −67,71 | 0,3511 | −0,8401 | |||
| DHR / Danaher Corporation | 0,01 | −11,98 | 1,09 | −15,23 | 0,3506 | −0,1024 | |||
| GWW / W.W. Grainger, Inc. | 0,00 | 0,00 | 1,08 | 5,28 | 0,3457 | −0,0141 | |||
| ELV / Elevance Health, Inc. | 0,00 | 13,25 | 1,02 | 1,29 | 0,3277 | −0,0269 | |||
| COST / Costco Wholesale Corporation | 0,00 | 0,00 | 1,02 | 4,63 | 0,3268 | −0,0154 | |||
| EQT / EQT Corporation | 0,02 | 0,93 | 0,2985 | 0,2985 | |||||
| MA / Mastercard Incorporated | 0,00 | −70,57 | 0,92 | −69,84 | 0,2950 | −0,7765 | |||
| MMC / Marsh & McLennan Companies, Inc. | 0,00 | 6,43 | 0,89 | −4,70 | 0,2870 | −0,0429 | |||
| ACN / Accenture plc | 0,00 | 4,36 | 0,89 | 0,00 | 0,2848 | −0,0275 | |||
| VST / Vistra Corp. | 0,00 | 36,65 | 0,86 | 125,59 | 0,2775 | 0,1426 | |||
| CME / CME Group Inc. | 0,00 | −48,95 | 0,86 | −46,99 | 0,2770 | −0,2954 | |||
| CRWD / CrowdStrike Holdings, Inc. | 0,00 | 0,86 | 0,2746 | 0,2746 | |||||
| IDXX / IDEXX Laboratories, Inc. | 0,00 | −47,34 | 0,85 | −32,81 | 0,2745 | −0,1728 | |||
| TMUS / T-Mobile US, Inc. | 0,00 | 0,00 | 0,82 | −10,71 | 0,2625 | −0,0595 | |||
| VRTX / Vertex Pharmaceuticals Incorporated | 0,00 | −61,69 | 0,76 | −64,84 | 0,2452 | −0,5187 | |||
| FIS / Fidelity National Information Services, Inc. | 0,01 | −20,43 | 0,73 | −13,36 | 0,2357 | −0,0621 | |||
| ROST / Ross Stores, Inc. | 0,00 | 0,00 | 0,63 | −0,16 | 0,2014 | −0,0197 | |||
| COO / The Cooper Companies, Inc. | 0,01 | 0,62 | 0,2004 | 0,2004 | |||||
| AIG / American International Group, Inc. | 0,01 | 5,82 | 0,62 | 4,19 | 0,2000 | −0,0104 | |||
| ECL / Ecolab Inc. | 0,00 | −14,50 | 0,60 | −9,06 | 0,1934 | −0,0398 | |||
| MDLZ / Mondelez International, Inc. | 0,01 | 17,42 | 0,53 | 16,63 | 0,1714 | 0,0104 | |||
| LOW / Lowe's Companies, Inc. | 0,00 | 0,00 | 0,52 | −4,93 | 0,1675 | −0,0255 | |||
| IFF / International Flavors & Fragrances Inc. | 0,01 | 18,71 | 0,46 | 12,65 | 0,1488 | 0,0038 | |||
| BMRN / BioMarin Pharmaceutical Inc. | 0,01 | 0,00 | 0,37 | −22,32 | 0,1187 | −0,0486 | |||
| S+P500 EMINI FUT SEP25 / DE (000000000) | 0,03 | 0,0093 | 0,0093 |