Grundläggande statistik
| Portföljvärde | $ 109 750 972 |
| Aktuella positioner | 98 |
Senaste innehav, resultat, förvaltat kapital (från 13F, 13D)
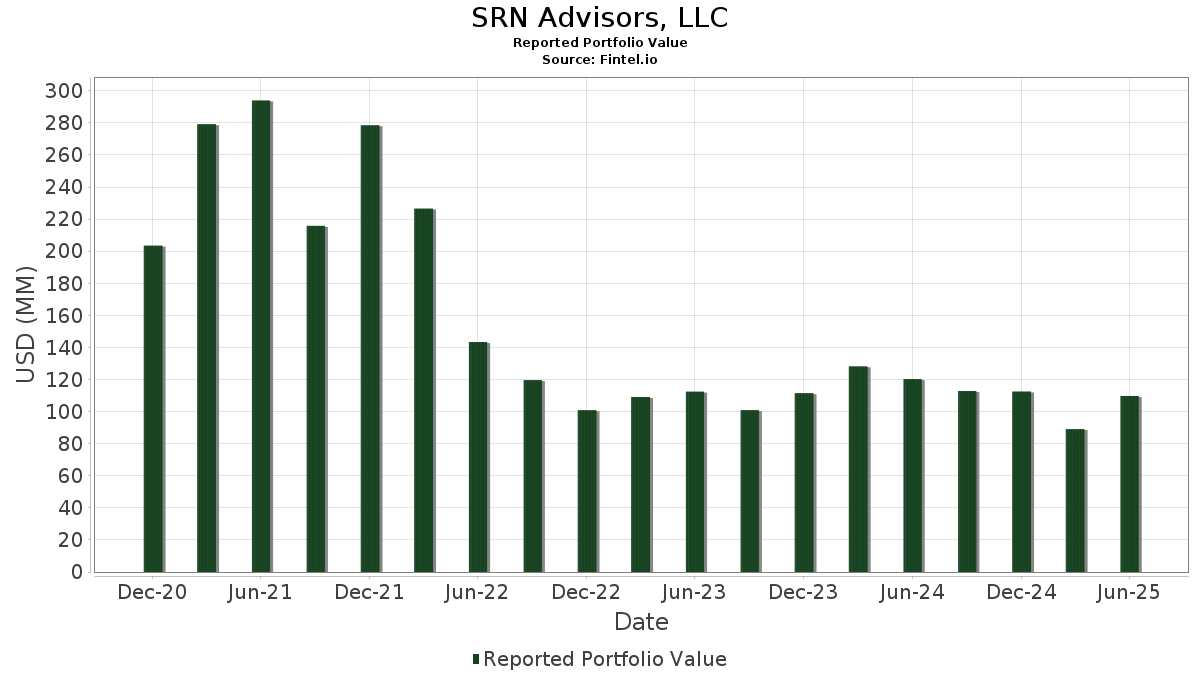
SRN Advisors, LLC har redovisat 98 totala innehav i sina senaste SEC-arkiveringar. Det senaste portföljvärdet beräknas vara $ 109 750 972 USD. Faktiskt förvaltade tillgångar (AUM) är detta värde plus likvida medel (som inte redovisas). SRN Advisors, LLCs största innehav är NVIDIA Corporation (US:NVDA) , Broadcom Inc. (US:AVGO) , Costco Wholesale Corporation (US:COST) , Visa Inc. (US:V) , and Mastercard Incorporated (US:MA) . SRN Advisors, LLCs nya positioner inkluderar Bitdeer Technologies Group (DE:R1T) , Circle Internet Group, Inc. (US:CRCL) , Hut 8 Corp. (US:HUT) , .
Största ökningarna detta kvartal
Vi använder förändringen i portföljallokeringen eftersom det är det mest meningsfulla måttet. Förändringar kan bero på transaktioner eller förändringar i aktiekurser.
| Värdepapper | Aktier (MM) |
Värde (MM$) |
Portfölj % av | ΔPortfölj % av |
|---|---|---|---|---|
| 0,03 | 4,37 | 3,9826 | 2,1818 | |
| 0,18 | 2,04 | 1,8596 | 1,8596 | |
| 0,01 | 2,71 | 2,4649 | 1,6504 | |
| 0,01 | 1,53 | 1,3940 | 1,3940 | |
| 0,43 | 2,04 | 1,8628 | 1,1289 | |
| 0,01 | 2,11 | 1,9202 | 1,0990 | |
| 0,43 | 1,90 | 1,7294 | 1,0790 | |
| 0,06 | 1,10 | 1,0043 | 1,0043 | |
| 0,01 | 3,55 | 3,2329 | 0,9547 | |
| 0,15 | 1,70 | 1,5492 | 0,7281 |
Största minskningarna detta kvartal
Vi använder förändringen i portföljallokeringen eftersom det är det mest meningsfulla måttet. Förändringar kan bero på transaktioner eller förändringar i aktiepriser.
| Värdepapper | Aktier (MM) |
Värde (MM$) |
Portfölj % av | ΔPortfölj % av |
|---|---|---|---|---|
| 0,00 | 0,91 | 0,8297 | −0,9768 | |
| 0,00 | 1,24 | 1,1257 | −0,9536 | |
| 0,00 | 0,20 | 0,1860 | −0,8691 | |
| 0,00 | 0,33 | 0,3035 | −0,6735 | |
| 0,00 | 1,45 | 1,3256 | −0,6243 | |
| 0,01 | 1,52 | 1,3859 | −0,4710 | |
| 0,03 | 0,70 | 0,6390 | −0,4394 | |
| 0,00 | 0,61 | 0,5578 | −0,4055 | |
| 0,00 | 0,56 | 0,5127 | −0,3787 | |
| 0,01 | 2,82 | 2,5667 | −0,3738 |
13F- och fond arkiveringar
Denna blankett lämnades in den 2025-08-14 för rapporteringsperioden 2025-06-30. Klicka på länksymbolen för att se hela transaktionshistoriken.
Uppgradera för att låsa upp premiumdata och exportera till Excel![]() .
.
| Värdepapper | Typ | Genomsnittligt aktiepris | Aktier (MM) |
ΔAktier (%) |
ΔAktier (%) |
Värde ($MM) |
Portfölj (%) |
ΔPortfölj (%) |
|
|---|---|---|---|---|---|---|---|---|---|
| NVDA / NVIDIA Corporation | 0,03 | 87,00 | 4,37 | 172,61 | 3,9826 | 2,1818 | |||
| AVGO / Broadcom Inc. | 0,01 | 6,24 | 3,55 | 74,95 | 3,2329 | 0,9547 | |||
| COST / Costco Wholesale Corporation | 0,00 | 4,94 | 3,11 | 9,85 | 2,8349 | −0,3462 | |||
| V / Visa Inc. | 0,01 | 6,20 | 2,82 | 7,56 | 2,5667 | −0,3738 | |||
| MA / Mastercard Incorporated | 0,00 | 7,73 | 2,71 | 10,43 | 2,4700 | −0,2865 | |||
| PWR / Quanta Services, Inc. | 0,01 | 150,86 | 2,71 | 273,10 | 2,4649 | 1,6504 | |||
| HOOD / Robinhood Markets, Inc. | 0,02 | −29,06 | 2,23 | 59,63 | 2,0325 | 0,4627 | |||
| KLAC / KLA Corporation | 0,00 | 3,86 | 2,15 | 36,93 | 1,9563 | 0,1943 | |||
| TSM / Taiwan Semiconductor Manufacturing Company Limited - Depositary Receipt (Common Stock) | 0,01 | 111,24 | 2,11 | 188,24 | 1,9202 | 1,0990 | |||
| MSFT / Microsoft Corporation | 0,00 | −13,83 | 2,05 | 14,21 | 1,8673 | −0,1483 | |||
| CIFR / Cipher Mining Inc. | 0,43 | 50,53 | 2,04 | 213,02 | 1,8628 | 1,1289 | |||
| R1T / Bitdeer Technologies Group | 0,18 | 2,04 | 1,8596 | 1,8596 | |||||
| WULF / TeraWulf Inc. | 0,43 | 104,26 | 1,90 | 227,81 | 1,7294 | 1,0790 | |||
| GRMN / Garmin Ltd. | 0,01 | 98,91 | 1,82 | 91,18 | 1,6591 | 0,5896 | |||
| CTAS / Cintas Corporation | 0,01 | 6,25 | 1,80 | 15,20 | 1,6440 | −0,1148 | |||
| CORZ / Core Scientific, Inc. | 0,10 | −47,90 | 1,75 | 22,84 | 1,5936 | −0,0055 | |||
| VRSK / Verisk Analytics, Inc. | 0,01 | 3,67 | 1,71 | 8,52 | 1,5551 | −0,2114 | |||
| RIOT / Riot Platforms, Inc. | 0,15 | 46,53 | 1,70 | 132,56 | 1,5492 | 0,7281 | |||
| GWW / W.W. Grainger, Inc. | 0,00 | 4,11 | 1,69 | 9,62 | 1,5364 | −0,1909 | |||
| CRCL / Circle Internet Group, Inc. | 0,01 | 1,53 | 1,3940 | 1,3940 | |||||
| HUBB / Hubbell Incorporated | 0,00 | 6,21 | 1,52 | 31,09 | 1,3869 | 0,0829 | |||
| ACN / Accenture plc | 0,01 | −3,96 | 1,52 | −7,99 | 1,3859 | −0,4710 | |||
| MSCI / MSCI Inc. | 0,00 | 3,56 | 1,46 | 5,58 | 1,3285 | −0,2218 | |||
| MSTR / Strategy Inc | 0,00 | −40,25 | 1,45 | −16,24 | 1,3256 | −0,6243 | |||
| MPWR / Monolithic Power Systems, Inc. | 0,00 | 6,20 | 1,43 | 33,96 | 1,3015 | 0,1037 | |||
| XYZ / Block, Inc. | 0,02 | 21,82 | 1,41 | 52,32 | 1,2843 | 0,2450 | |||
| QCOM / QUALCOMM Incorporated | 0,01 | 53,05 | 1,29 | 58,69 | 1,1731 | 0,2619 | |||
| COIN / Coinbase Global, Inc. | 0,00 | −67,21 | 1,24 | −33,28 | 1,1257 | −0,9536 | |||
| INTU / Intuit Inc. | 0,00 | 1,98 | 1,21 | 30,82 | 1,1066 | 0,0640 | |||
| ETN / Eaton Corporation plc | 0,00 | 4,17 | 1,19 | 36,77 | 1,0887 | 0,1078 | |||
| APH / Amphenol Corporation | 0,01 | 3,35 | 1,19 | 55,69 | 1,0857 | 0,2257 | |||
| CUBI / Customers Bancorp, Inc. | 0,02 | 22,89 | 1,19 | 43,81 | 1,0803 | 0,1543 | |||
| MARA / MARA Holdings, Inc. | 0,07 | 3,95 | 1,16 | 41,74 | 1,0558 | 0,1377 | |||
| HUT / Hut 8 Corp. | 0,06 | 1,10 | 1,0043 | 1,0043 | |||||
| LRCX / Lam Research Corporation | 0,01 | 4,38 | 1,10 | 39,85 | 0,9979 | 0,1178 | |||
| ECL / Ecolab Inc. | 0,00 | 1,87 | 1,07 | 8,30 | 0,9756 | −0,1351 | |||
| GL / Globe Life Inc. | 0,01 | 3,65 | 1,03 | −2,19 | 0,9362 | −0,2437 | |||
| PHM / PulteGroup, Inc. | 0,01 | 3,00 | 1,00 | 5,70 | 0,9124 | −0,1518 | |||
| FAST / Fastenal Company | 0,02 | 111,22 | 1,00 | 14,42 | 0,9118 | −0,0706 | |||
| CB / Chubb Limited | 0,00 | 2,21 | 0,99 | −1,97 | 0,9054 | −0,2327 | |||
| CMI / Cummins Inc. | 0,00 | 6,24 | 0,99 | 10,96 | 0,9045 | −0,0998 | |||
| ODFL / Old Dominion Freight Line, Inc. | 0,01 | 4,28 | 0,98 | 2,29 | 0,8945 | −0,1833 | |||
| MCO / Moody's Corporation | 0,00 | 2,72 | 0,97 | 10,67 | 0,8793 | −0,1002 | |||
| EXPD / Expeditors International of Washington, Inc. | 0,01 | 1,97 | 0,95 | −3,17 | 0,8636 | −0,2351 | |||
| IBM / International Business Machines Corporation | 0,00 | −52,25 | 0,91 | −43,41 | 0,8297 | −0,9768 | |||
| MSI / Motorola Solutions, Inc. | 0,00 | 6,23 | 0,90 | 1,92 | 0,8237 | −0,1715 | |||
| TXN / Texas Instruments Incorporated | 0,00 | 141,22 | 0,90 | 178,95 | 0,8214 | 0,4581 | |||
| HIG / The Hartford Insurance Group, Inc. | 0,01 | 4,69 | 0,88 | 7,34 | 0,7992 | −0,1184 | |||
| BR / Broadridge Financial Solutions, Inc. | 0,00 | 6,25 | 0,86 | 6,44 | 0,7834 | −0,1233 | |||
| SHW / The Sherwin-Williams Company | 0,00 | 2,31 | 0,85 | 0,59 | 0,7746 | −0,1744 | |||
| LLY / Eli Lilly and Company | 0,00 | 1,60 | 0,84 | −4,10 | 0,7664 | −0,2187 | |||
| CTSH / Cognizant Technology Solutions Corporation | 0,01 | 3,87 | 0,84 | 5,93 | 0,7647 | −0,1249 | |||
| AMAT / Applied Materials, Inc. | 0,00 | 6,09 | 0,83 | 33,87 | 0,7531 | 0,0595 | |||
| SAP / SAP SE - Depositary Receipt (Common Stock) | 0,00 | −22,23 | 0,83 | −11,95 | 0,7523 | −0,3002 | |||
| PNR / Pentair plc | 0,01 | 3,86 | 0,82 | 21,94 | 0,7451 | −0,0084 | |||
| CME / CME Group Inc. | 0,00 | 6,23 | 0,82 | 10,41 | 0,7451 | −0,0870 | |||
| J / Jacobs Solutions Inc. | 0,01 | 3,85 | 0,81 | 12,90 | 0,7423 | −0,0679 | |||
| HON / Honeywell International Inc. | 0,00 | 6,20 | 0,81 | 16,81 | 0,7414 | −0,0410 | |||
| LIN / Linde plc | 0,00 | 6,18 | 0,81 | 7,05 | 0,7340 | −0,1116 | |||
| ITW / Illinois Tool Works Inc. | 0,00 | 3,47 | 0,80 | 3,08 | 0,7324 | −0,1427 | |||
| GS / The Goldman Sachs Group, Inc. | 0,00 | −9,06 | 0,80 | 17,78 | 0,7248 | −0,0335 | |||
| MMC / Marsh & McLennan Companies, Inc. | 0,00 | 6,28 | 0,77 | −4,85 | 0,6976 | −0,2054 | |||
| ERIE / Erie Indemnity Company | 0,00 | 3,09 | 0,76 | −14,75 | 0,6961 | −0,3096 | |||
| KMB / Kimberly-Clark Corporation | 0,01 | 5,18 | 0,76 | −4,66 | 0,6898 | −0,2020 | |||
| NKE / NIKE, Inc. | 0,01 | 4,54 | 0,75 | 16,98 | 0,6848 | −0,0367 | |||
| MPC / Marathon Petroleum Corporation | 0,00 | 6,24 | 0,74 | 21,28 | 0,6752 | −0,0118 | |||
| CHD / Church & Dwight Co., Inc. | 0,01 | 5,51 | 0,74 | −7,97 | 0,6741 | −0,2279 | |||
| CINF / Cincinnati Financial Corporation | 0,00 | 5,85 | 0,74 | 6,68 | 0,6702 | −0,1039 | |||
| PG / The Procter & Gamble Company | 0,00 | 6,24 | 0,73 | −0,68 | 0,6624 | −0,1596 | |||
| NDAQ / Nasdaq, Inc. | 0,01 | −12,78 | 0,72 | 2,87 | 0,6547 | −0,1302 | |||
| BLK / BlackRock, Inc. | 0,00 | −8,59 | 0,71 | 1,28 | 0,6511 | −0,1408 | |||
| AME / AMETEK, Inc. | 0,00 | 6,11 | 0,71 | 11,42 | 0,6496 | −0,0682 | |||
| AOS / A. O. Smith Corporation | 0,01 | 5,90 | 0,71 | 6,31 | 0,6457 | −0,1034 | |||
| HPE / Hewlett Packard Enterprise Company | 0,03 | −44,89 | 0,70 | −26,98 | 0,6390 | −0,4394 | |||
| MU / Micron Technology, Inc. | 0,01 | −28,03 | 0,70 | 2,04 | 0,6374 | −0,1322 | |||
| DHI / D.R. Horton, Inc. | 0,01 | 5,23 | 0,68 | 6,79 | 0,6165 | −0,0955 | |||
| CLSK / CleanSpark, Inc. | 0,06 | −48,56 | 0,68 | −15,52 | 0,6151 | −0,2829 | |||
| AAPL / Apple Inc. | 0,00 | 5,86 | 0,66 | −2,21 | 0,6044 | −0,1575 | |||
| A / Agilent Technologies, Inc. | 0,01 | 5,63 | 0,66 | 6,60 | 0,6037 | −0,0945 | |||
| MRK / Merck & Co., Inc. | 0,01 | 4,08 | 0,66 | −8,09 | 0,6005 | −0,2059 | |||
| PYPL / PayPal Holdings, Inc. | 0,01 | −29,25 | 0,64 | −19,42 | 0,5792 | −0,3067 | |||
| CSCO / Cisco Systems, Inc. | 0,01 | −32,43 | 0,62 | −24,05 | 0,5643 | −0,3512 | |||
| ORCL / Oracle Corporation | 0,00 | −54,36 | 0,61 | −28,59 | 0,5578 | −0,4055 | |||
| AMD / Advanced Micro Devices, Inc. | 0,00 | −14,56 | 0,61 | 18,09 | 0,5531 | −0,0246 | |||
| AXP / American Express Company | 0,00 | −40,20 | 0,56 | −29,13 | 0,5127 | −0,3787 | |||
| BK / The Bank of New York Mellon Corporation | 0,01 | −9,03 | 0,55 | −1,26 | 0,5018 | −0,1241 | |||
| NU / Nu Holdings Ltd. | 0,04 | −44,80 | 0,51 | −26,12 | 0,4646 | −0,3097 | |||
| BIDU / Baidu, Inc. - Depositary Receipt (Common Stock) | 0,01 | 33,30 | 0,51 | 24,51 | 0,4629 | 0,0036 | |||
| BFB / Brown-Forman Corp. - Class B | 0,02 | 5,90 | 0,45 | −16,01 | 0,4111 | −0,1924 | |||
| BABA / Alibaba Group Holding Limited - Depositary Receipt (Common Stock) | 0,00 | 83,55 | 0,42 | 57,25 | 0,3862 | 0,0838 | |||
| JD / JD.com, Inc. - Depositary Receipt (Common Stock) | 0,01 | 53,21 | 0,38 | 21,61 | 0,3440 | −0,0046 | |||
| IREN / IREN Limited | 0,03 | −73,40 | 0,37 | −36,35 | 0,3337 | −0,3125 | |||
| WMT / Walmart Inc. | 0,00 | −65,62 | 0,33 | −61,68 | 0,3035 | −0,6735 | |||
| RMD / ResMed Inc. | 0,00 | −10,85 | 0,23 | 2,73 | 0,2066 | −0,0412 | |||
| SBAC / SBA Communications Corporation | 0,00 | −10,83 | 0,22 | −4,68 | 0,2043 | −0,0603 | |||
| SPGI / S&P Global Inc. | 0,00 | −10,68 | 0,22 | −7,17 | 0,2008 | −0,0662 | |||
| TRV / The Travelers Companies, Inc. | 0,00 | −10,85 | 0,22 | −9,88 | 0,2004 | −0,0735 | |||
| JPM / JPMorgan Chase & Co. | 0,00 | −81,62 | 0,20 | −78,27 | 0,1860 | −0,8691 | |||
| TPL / Texas Pacific Land Corporation | 0,00 | −100,00 | 0,00 | 0,0000 | |||||
| TMO / Thermo Fisher Scientific Inc. | 0,00 | −100,00 | 0,00 | 0,0000 | |||||
| DOV / Dover Corporation | 0,00 | −100,00 | 0,00 | 0,0000 | |||||
| ZTS / Zoetis Inc. | 0,00 | −100,00 | 0,00 | 0,0000 |