Grundläggande statistik
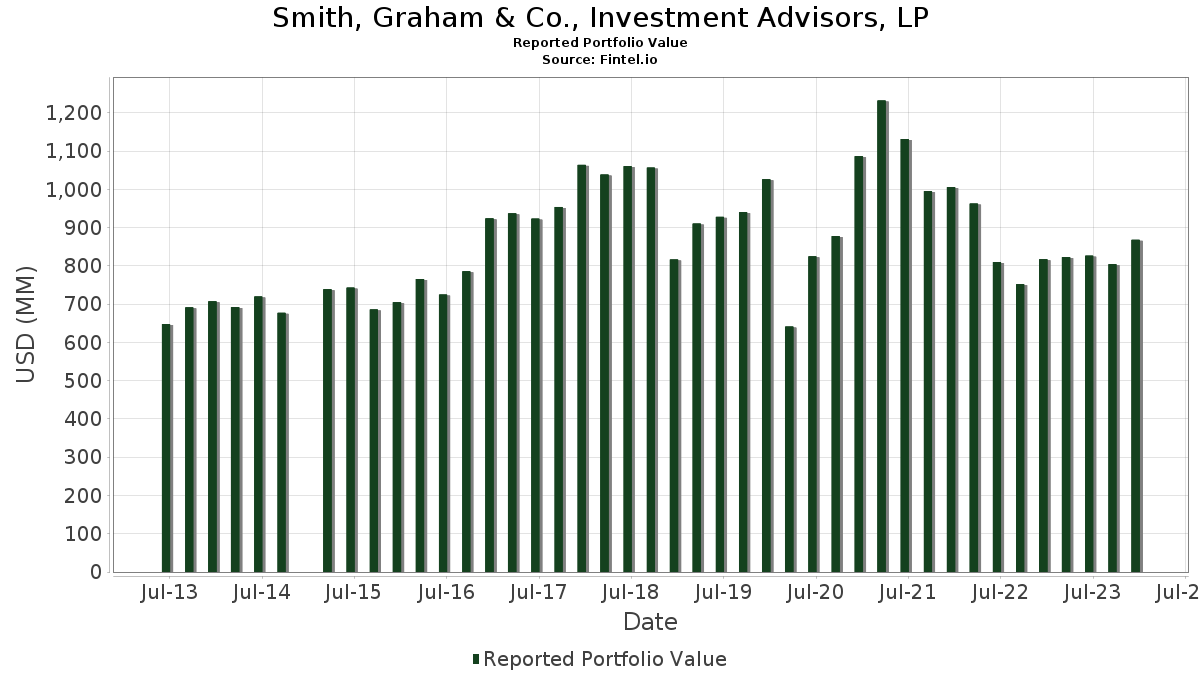
| Portföljvärde | $ 868 062 258 |
| Aktuella positioner | 141 |
Senaste innehav, resultat, förvaltat kapital (från 13F, 13D)
Smith, Graham & Co., Investment Advisors, LP har redovisat 141 totala innehav i sina senaste SEC-arkiveringar. Det senaste portföljvärdet beräknas vara $ 868 062 258 USD. Faktiskt förvaltade tillgångar (AUM) är detta värde plus likvida medel (som inte redovisas). Smith, Graham & Co., Investment Advisors, LPs största innehav är Koppers Holdings Inc. (US:KOP) , Hibbett, Inc. (US:HIBB) , Dycom Industries, Inc. (US:DY) , Griffon Corporation (US:GFF) , and Group 1 Automotive, Inc. (US:GPI) . Smith, Graham & Co., Investment Advisors, LPs nya positioner inkluderar Permian Resources Corporation (US:PR) , Preferred Bank (US:PFBC) , Clearfield, Inc. (US:CLFD) , OGE Energy Corp. (US:OGE) , and .
Största ökningarna detta kvartal
Vi använder förändringen i portföljallokeringen eftersom det är det mest meningsfulla måttet. Förändringar kan bero på transaktioner eller förändringar i aktiekurser.
| Värdepapper | Aktier (MM) |
Värde (MM$) |
Portfölj % av | ΔPortfölj % av |
|---|---|---|---|---|
| 0,74 | 10,01 | 1,1529 | 1,1529 | |
| 0,09 | 6,52 | 0,7513 | 0,7513 | |
| 0,18 | 5,15 | 0,5931 | 0,5931 | |
| 0,21 | 15,08 | 1,7371 | 0,4346 | |
| 0,24 | 14,39 | 1,6581 | 0,4241 | |
| 0,44 | 7,29 | 0,8393 | 0,4184 | |
| 0,09 | 3,23 | 0,3717 | 0,3717 | |
| 0,38 | 7,20 | 0,8299 | 0,3379 | |
| 0,29 | 15,10 | 1,7390 | 0,2812 | |
| 0,13 | 14,77 | 1,7019 | 0,2729 |
Största minskningarna detta kvartal
Vi använder förändringen i portföljallokeringen eftersom det är det mest meningsfulla måttet. Förändringar kan bero på transaktioner eller förändringar i aktiepriser.
| Värdepapper | Aktier (MM) |
Värde (MM$) |
Portfölj % av | ΔPortfölj % av |
|---|---|---|---|---|
| 0,00 | 0,00 | −1,2881 | ||
| 0,00 | 0,00 | −0,9489 | ||
| 0,00 | 0,00 | −0,7241 | ||
| 0,00 | 0,00 | −0,7226 | ||
| 0,00 | 0,00 | −0,5354 | ||
| 0,35 | 3,69 | 0,4254 | −0,4336 | |
| 0,02 | 12,14 | 1,3981 | −0,3308 | |
| 0,12 | 5,56 | 0,6409 | −0,3244 | |
| 0,10 | 7,77 | 0,8952 | −0,3196 | |
| 0,06 | 7,38 | 0,8501 | −0,2943 |
13F- och fond arkiveringar
Denna blankett lämnades in den 2024-01-29 för rapporteringsperioden 2023-12-31. Klicka på länksymbolen för att se hela transaktionshistoriken.
Uppgradera för att låsa upp premiumdata och exportera till Excel![]() .
.
| Värdepapper | Typ | Genomsnittligt aktiepris | Aktier (MM) |
ΔAktier (%) |
ΔAktier (%) |
Värde ($MM) |
Portfölj (%) |
ΔPortfölj (%) |
|
|---|---|---|---|---|---|---|---|---|---|
| KOP / Koppers Holdings Inc. | 0,29 | −0,60 | 15,10 | 28,73 | 1,7390 | 0,2812 | |||
| HIBB / Hibbett, Inc. | 0,21 | −5,06 | 15,08 | 43,92 | 1,7371 | 0,4346 | |||
| DY / Dycom Industries, Inc. | 0,13 | −0,62 | 14,77 | 28,52 | 1,7019 | 0,2729 | |||
| GFF / Griffon Corporation | 0,24 | −5,63 | 14,39 | 45,00 | 1,6581 | 0,4241 | |||
| GPI / Group 1 Automotive, Inc. | 0,04 | −13,01 | 13,63 | −1,35 | 1,5700 | −0,1474 | |||
| LAD / Lithia Motors, Inc. | 0,04 | −0,60 | 13,58 | 10,83 | 1,5645 | 0,0411 | |||
| SIGI / Selective Insurance Group, Inc. | 0,12 | −0,60 | 12,33 | −4,15 | 1,4206 | −0,1788 | |||
| MDC / M.D.C. Holdings, Inc. | 0,22 | −0,60 | 12,22 | 33,21 | 1,4072 | 0,2672 | |||
| DECK / Deckers Outdoor Corporation | 0,02 | −32,88 | 12,14 | −12,73 | 1,3981 | −0,3308 | |||
| SCSC / ScanSource, Inc. | 0,30 | −0,60 | 12,06 | 29,91 | 1,3891 | 0,2351 | |||
| WBS / Webster Financial Corporation | 0,22 | −0,60 | 11,23 | 25,17 | 1,2938 | 0,1784 | |||
| UCTT / Ultra Clean Holdings, Inc. | 0,32 | −0,59 | 10,94 | 14,38 | 1,2601 | 0,0712 | |||
| PRIM / Primoris Services Corporation | 0,30 | −0,60 | 10,08 | 0,86 | 1,1612 | −0,0813 | |||
| PR / Permian Resources Corporation | 0,74 | 10,01 | 1,1529 | 1,1529 | |||||
| GB.WS / Global Blue Group Holding AG - Equity Warrant | 0,10 | −0,61 | 9,86 | 25,56 | 1,1364 | 0,1597 | |||
| TTEK / Tetra Tech, Inc. | 0,06 | −0,60 | 9,82 | 9,13 | 1,1318 | 0,0127 | |||
| GBX / The Greenbrier Companies, Inc. | 0,22 | 1,73 | 9,69 | 12,35 | 1,1164 | 0,0441 | |||
| ECPG / Encore Capital Group, Inc. | 0,19 | −0,60 | 9,66 | 5,63 | 1,1131 | −0,0241 | |||
| TTMI / TTM Technologies, Inc. | 0,61 | −0,59 | 9,66 | 22,02 | 1,1125 | 0,1286 | |||
| SEM / Select Medical Holdings Corporation | 0,41 | −0,60 | 9,63 | −7,56 | 1,1098 | −0,1858 | |||
| OMI / Owens & Minor, Inc. | 0,49 | −0,59 | 9,47 | 18,54 | 1,0910 | 0,0978 | |||
| LZB / La-Z-Boy Incorporated | 0,24 | −0,59 | 8,89 | 18,85 | 1,0244 | 0,0943 | |||
| PWR / Quanta Services, Inc. | 0,04 | −11,62 | 8,85 | 1,96 | 1,0196 | −0,0596 | |||
| CRUS / Cirrus Logic, Inc. | 0,10 | −0,61 | 8,48 | 11,79 | 0,9766 | 0,0339 | |||
| AEIS / Advanced Energy Industries, Inc. | 0,08 | −0,58 | 8,45 | 5,01 | 0,9733 | −0,0269 | |||
| BLDR / Builders FirstSource, Inc. | 0,05 | −13,47 | 8,44 | 16,03 | 0,9723 | 0,0680 | |||
| AXL / American Axle & Manufacturing Holdings, Inc. | 0,95 | −0,60 | 8,37 | 20,63 | 0,9645 | 0,1016 | |||
| TITN / Titan Machinery Inc. | 0,29 | 20,33 | 8,28 | 30,74 | 0,9539 | 0,1665 | |||
| 872307903 / TCF Financial Corporation | 0,21 | 19,47 | 8,26 | 21,91 | 0,9512 | 0,1092 | |||
| VTLE / Vital Energy, Inc. | 0,18 | 62,38 | 8,22 | 33,28 | 0,9466 | 0,1802 | |||
| PBH / Prestige Consumer Healthcare Inc. | 0,13 | −0,61 | 8,01 | 6,39 | 0,9231 | −0,0132 | |||
| HOUS / Anywhere Real Estate Inc. | 0,97 | −0,59 | 7,88 | 25,39 | 0,9081 | 0,1265 | |||
| GATX / GATX Corporation | 0,06 | −0,60 | 7,79 | 9,80 | 0,8971 | 0,0154 | |||
| DRH / DiamondRock Hospitality Company | 0,83 | −0,60 | 7,79 | 16,23 | 0,8970 | 0,0642 | |||
| BDC / Belden Inc. | 0,10 | −0,61 | 7,77 | −20,48 | 0,8952 | −0,3196 | |||
| ENS / EnerSys | 0,07 | −0,61 | 7,52 | 6,00 | 0,8665 | −0,0157 | |||
| CARG / CarGurus, Inc. | 0,31 | 8,71 | 7,52 | 49,92 | 0,8660 | 0,2426 | |||
| PDCO / Patterson Companies, Inc. | 0,26 | −0,60 | 7,41 | −4,59 | 0,8535 | −0,1118 | |||
| JBL / Jabil Inc. | 0,06 | −20,16 | 7,38 | −19,84 | 0,8501 | −0,2943 | |||
| TGI / Triumph Group, Inc. | 0,44 | −0,60 | 7,29 | 115,18 | 0,8393 | 0,4184 | |||
| AMCX / AMC Networks Inc. | 0,38 | 14,13 | 7,20 | 82,03 | 0,8299 | 0,3379 | |||
| WAFD / WaFd, Inc | 0,22 | −0,58 | 7,15 | 27,92 | 0,8235 | 0,1287 | |||
| HOPE / Hope Bancorp, Inc. | 0,58 | −0,60 | 7,05 | 35,68 | 0,8117 | 0,1661 | |||
| BAND / Bandwidth Inc. | 0,49 | −0,59 | 7,02 | 27,65 | 0,8085 | 0,1249 | |||
| NMIH / NMI Holdings, Inc. | 0,23 | −0,58 | 6,89 | 8,94 | 0,7934 | 0,0074 | |||
| X / United States Steel Corporation | 0,14 | −9,28 | 6,83 | 35,87 | 0,7863 | 0,1619 | |||
| BV / BrightView Holdings, Inc. | 0,80 | 10,31 | 6,77 | 19,86 | 0,7801 | 0,0777 | |||
| CRK / Comstock Resources, Inc. | 0,76 | −0,59 | 6,70 | −20,24 | 0,7717 | −0,2724 | |||
| BGS / B&G Foods, Inc. | 0,63 | 4,28 | 6,62 | 10,72 | 0,7628 | 0,0193 | |||
| WEX / WEX Inc. | 0,03 | −0,61 | 6,61 | 2,80 | 0,7615 | −0,0378 | |||
| M / Macy's, Inc. | 0,33 | −9,28 | 6,60 | 57,20 | 0,7609 | 0,2386 | |||
| ANTX / AN2 Therapeutics, Inc. | 0,01 | −9,24 | 6,60 | −1,71 | 0,7605 | −0,0745 | |||
| SYNA / Synaptics Incorporated | 0,06 | −0,60 | 6,57 | 26,78 | 0,7571 | 0,1127 | |||
| PFBC / Preferred Bank | 0,09 | 6,52 | 0,7513 | 0,7513 | |||||
| BANC / Banc of California, Inc. | 0,48 | 11,75 | 6,47 | 21,23 | 0,7454 | 0,0819 | |||
| SPTN / SpartanNash Company | 0,28 | 20,07 | 6,46 | 25,26 | 0,7445 | 0,1031 | |||
| MTZ / MasTec, Inc. | 0,09 | 21,32 | 6,45 | 27,66 | 0,7428 | 0,1148 | |||
| ACRE / Ares Commercial Real Estate Corporation | 0,61 | −0,59 | 6,29 | 8,19 | 0,7242 | 0,0018 | |||
| TMHC / Taylor Morrison Home Corporation | 0,11 | −9,28 | 5,98 | 13,60 | 0,6891 | 0,0344 | |||
| TXT / Textron Inc. | 0,07 | −9,29 | 5,96 | −6,64 | 0,6866 | −0,1071 | |||
| LGND / Ligand Pharmaceuticals Incorporated | 0,08 | 34,39 | 5,94 | 60,22 | 0,6839 | 0,2232 | |||
| GDOT / Green Dot Corporation | 0,60 | 54,13 | 5,91 | 9,54 | 0,6813 | 0,0101 | |||
| CI / The Cigna Group | 0,02 | −9,29 | 5,85 | −5,05 | 0,6737 | −0,0919 | |||
| CCRN / Cross Country Healthcare, Inc. | 0,25 | 1,51 | 5,76 | −7,29 | 0,6638 | −0,1089 | |||
| AN / AutoNation, Inc. | 0,04 | −9,30 | 5,72 | −10,03 | 0,6585 | −0,1313 | |||
| RS / Reliance, Inc. | 0,02 | −9,30 | 5,69 | −3,26 | 0,6555 | −0,0757 | |||
| OI / O-I Glass, Inc. | 0,34 | 5,14 | 5,59 | 2,95 | 0,6435 | −0,0311 | |||
| SFM / Sprouts Farmers Market, Inc. | 0,12 | −36,26 | 5,56 | −28,35 | 0,6409 | −0,3244 | |||
| WSM / Williams-Sonoma, Inc. | 0,03 | −9,28 | 5,56 | 17,79 | 0,6407 | 0,0537 | |||
| ZM / Zoom Communications Inc. | 0,08 | 29,50 | 5,48 | 33,15 | 0,6313 | 0,1196 | |||
| FANG / Diamondback Energy, Inc. | 0,03 | −9,25 | 5,32 | −9,13 | 0,6134 | −0,1151 | |||
| DKS / DICK'S Sporting Goods, Inc. | 0,04 | −9,26 | 5,30 | 22,83 | 0,6100 | 0,0740 | |||
| VBTX / Veritex Holdings, Inc. | 0,23 | −0,59 | 5,29 | 28,86 | 0,6092 | 0,0991 | |||
| ACM / AECOM | 0,06 | −9,30 | 5,27 | 0,96 | 0,6068 | −0,0418 | |||
| PAHC / Phibro Animal Health Corporation | 0,45 | −0,59 | 5,19 | −9,86 | 0,5975 | −0,1178 | |||
| STLD / Steel Dynamics, Inc. | 0,04 | −9,28 | 5,18 | −0,08 | 0,5967 | −0,0477 | |||
| CLFD / Clearfield, Inc. | 0,18 | 5,15 | 0,5931 | 0,5931 | |||||
| LITE / Lumentum Holdings Inc. | 0,10 | −9,26 | 5,11 | 5,27 | 0,5891 | −0,0148 | |||
| PMT / PennyMac Mortgage Investment Trust | 0,33 | −0,60 | 4,98 | 19,85 | 0,5740 | 0,0571 | |||
| MD / Pediatrix Medical Group, Inc. | 0,53 | 51,47 | 4,97 | 10,81 | 0,5728 | 0,0151 | |||
| PRA / ProAssurance Corporation | 0,36 | 6,61 | 4,92 | −22,19 | 0,5670 | −0,2192 | |||
| ELAN / Elanco Animal Health Incorporated | 0,32 | 16,02 | 4,81 | 53,81 | 0,5536 | 0,1651 | |||
| AL / Air Lease Corporation | 0,11 | 9,02 | 4,80 | 16,01 | 0,5534 | 0,0387 | |||
| CBRE / CBRE Group, Inc. | 0,05 | −9,29 | 4,79 | 14,32 | 0,5520 | 0,0310 | |||
| RJF / Raymond James Financial, Inc. | 0,04 | −9,28 | 4,71 | 0,70 | 0,5431 | −0,0388 | |||
| TPR / Tapestry, Inc. | 0,13 | −9,28 | 4,69 | 16,13 | 0,5399 | 0,0383 | |||
| SAIC / Science Applications International Corporation | 0,04 | −9,28 | 4,66 | 6,85 | 0,5371 | −0,0053 | |||
| AMSF / AMERISAFE, Inc. | 0,10 | −0,61 | 4,63 | −7,14 | 0,5331 | −0,0864 | |||
| HUM / Humana Inc. | 0,01 | −9,24 | 4,58 | −14,61 | 0,5272 | −0,1390 | |||
| PLXS / Plexus Corp. | 0,04 | −9,26 | 4,56 | 5,54 | 0,5249 | −0,0119 | |||
| ARW / Arrow Electronics, Inc. | 0,04 | −9,28 | 4,55 | −11,45 | 0,5246 | −0,1147 | |||
| SLGN / Silgan Holdings Inc. | 0,10 | −0,45 | 4,53 | 4,50 | 0,5213 | −0,0171 | |||
| WDC / Western Digital Corporation | 0,09 | −16,83 | 4,50 | −4,54 | 0,5187 | −0,0677 | |||
| WLK / Westlake Corporation | 0,03 | −9,25 | 4,49 | 1,88 | 0,5174 | −0,0306 | |||
| VSH / Vishay Intertechnology, Inc. | 0,19 | −9,28 | 4,44 | −12,05 | 0,5113 | −0,1160 | |||
| RDN / Radian Group Inc. | 0,15 | −9,28 | 4,38 | 3,16 | 0,5044 | −0,0233 | |||
| PLCE / The Children's Place, Inc. | 0,19 | −0,60 | 4,37 | −14,61 | 0,5036 | −0,1328 | |||
| JLL / Jones Lang LaSalle Incorporated | 0,02 | −9,33 | 4,37 | 21,28 | 0,5036 | 0,0556 | |||
| SWKS / Skyworks Solutions, Inc. | 0,04 | −9,29 | 4,32 | 3,45 | 0,4981 | −0,0216 | |||
| HPE / Hewlett Packard Enterprise Company | 0,25 | −9,28 | 4,31 | −11,33 | 0,4970 | −0,1078 | |||
| COLB / Columbia Banking System, Inc. | 0,16 | −0,60 | 4,28 | 30,67 | 0,4928 | 0,0857 | |||
| GCO / Genesco Inc. | 0,12 | −0,60 | 4,21 | 13,58 | 0,4848 | 0,0241 | |||
| CDP / COPT Defense Properties | 0,16 | −9,29 | 3,99 | −2,44 | 0,4598 | −0,0488 | |||
| CNP / CenterPoint Energy, Inc. | 0,14 | −9,28 | 3,95 | −3,45 | 0,4548 | −0,0536 | |||
| DINO / HF Sinclair Corporation | 0,07 | −9,28 | 3,93 | −11,47 | 0,4527 | −0,0990 | |||
| UBSI / United Bankshares, Inc. | 0,10 | −0,59 | 3,90 | 35,31 | 0,4495 | 0,0910 | |||
| SF / Stifel Financial Corp. | 0,06 | −9,26 | 3,83 | 2,11 | 0,4409 | −0,0250 | |||
| INGR / Ingredion Incorporated | 0,04 | 14,29 | 3,81 | 26,08 | 0,4389 | 0,0632 | |||
| REZI / Resideo Technologies, Inc. | 0,20 | −9,28 | 3,79 | 8,04 | 0,4367 | 0,0006 | |||
| VLO / Valero Energy Corporation | 0,03 | −9,25 | 3,77 | −16,76 | 0,4349 | −0,1288 | |||
| RL / Ralph Lauren Corporation | 0,03 | −9,26 | 3,73 | 12,72 | 0,4299 | 0,0183 | |||
| SLG / SL Green Realty Corp. | 0,08 | −9,28 | 3,72 | 9,87 | 0,4283 | 0,0076 | |||
| JNPR / Juniper Networks, Inc. | 0,13 | −9,28 | 3,71 | −3,79 | 0,4274 | −0,0519 | |||
| MDRX / Veradigm Inc. | 0,35 | −33,06 | 3,69 | −46,56 | 0,4254 | −0,4336 | |||
| FULT / Fulton Financial Corporation | 0,22 | −9,28 | 3,69 | 23,31 | 0,4248 | 0,0530 | |||
| PTEN / Patterson-UTI Energy, Inc. | 0,34 | −9,30 | 3,68 | −29,22 | 0,4242 | −0,2226 | |||
| DFS / Discover Financial Services | 0,03 | −9,25 | 3,65 | 17,77 | 0,4199 | 0,0351 | |||
| GNTX / Gentex Corporation | 0,11 | −9,28 | 3,64 | −8,94 | 0,4191 | −0,0776 | |||
| FL / Foot Locker, Inc. | 0,12 | −9,27 | 3,63 | 62,91 | 0,4186 | 0,1413 | |||
| RF / Regions Financial Corporation | 0,18 | −9,28 | 3,56 | 2,24 | 0,4105 | −0,0229 | |||
| KLIC / Kulicke and Soffa Industries, Inc. | 0,07 | −9,27 | 3,56 | 2,09 | 0,4104 | −0,0234 | |||
| HST / Host Hotels & Resorts, Inc. | 0,18 | −9,27 | 3,53 | 9,94 | 0,4066 | 0,0074 | |||
| COF / Capital One Financial Corporation | 0,03 | −9,26 | 3,49 | 22,61 | 0,4023 | 0,0482 | |||
| CE / Celanese Corporation | 0,02 | −9,29 | 3,40 | 12,30 | 0,3914 | 0,0152 | |||
| FITB / Fifth Third Bancorp | 0,10 | −9,28 | 3,38 | 23,57 | 0,3896 | 0,0492 | |||
| EWBC / East West Bancorp, Inc. | 0,05 | −9,28 | 3,37 | 23,82 | 0,3881 | 0,0499 | |||
| FAF / First American Financial Corporation | 0,05 | −9,29 | 3,35 | 3,49 | 0,3863 | −0,0166 | |||
| OGE / OGE Energy Corp. | 0,09 | 3,23 | 0,3717 | 0,3717 | |||||
| CATY / Cathay General Bancorp | 0,07 | −9,29 | 3,18 | 16,30 | 0,3658 | 0,0264 | |||
| LEA / Lear Corporation | 0,02 | −9,32 | 3,13 | −4,58 | 0,3604 | −0,0472 | |||
| LUV / Southwest Airlines Co. | 0,10 | −9,28 | 3,02 | −3,21 | 0,3479 | −0,0400 | |||
| LH / Labcorp Holdings Inc. | 0,01 | −9,30 | 2,91 | 2,54 | 0,3350 | −0,0176 | |||
| DBI / Designer Brands Inc. | 0,31 | −9,28 | 2,74 | −36,60 | 0,3154 | −0,2213 | |||
| MTB / M&T Bank Corporation | 0,02 | −9,27 | 2,70 | −1,64 | 0,3115 | −0,0303 | |||
| PEG / Public Service Enterprise Group Incorporated | 0,04 | −9,29 | 2,65 | −2,54 | 0,3050 | −0,0327 | |||
| TCBI / Texas Capital Bancshares, Inc. | 0,04 | −9,28 | 2,62 | −0,46 | 0,3018 | −0,0254 | |||
| HBAN / Huntington Bancshares Incorporated | 0,19 | −9,28 | 2,48 | 10,97 | 0,2856 | 0,0078 | |||
| KEY / KeyCorp | 0,17 | −9,28 | 2,47 | 21,41 | 0,2842 | 0,0316 | |||
| GLW / Corning Incorporated | 0,07 | −9,29 | 2,21 | −9,35 | 0,2547 | −0,0485 | |||
| JBLU / JetBlue Airways Corporation | 0,36 | −9,28 | 1,99 | 9,46 | 0,2294 | 0,0032 | |||
| AEE / Ameren Corporation | 0,02 | −9,28 | 1,58 | −12,30 | 0,1816 | −0,0419 | |||
| NXGN / NextGen Healthcare Inc | 0,00 | −100,00 | 0,00 | −100,00 | −0,7241 | ||||
| COMM / CommScope Holding Company, Inc. | 0,00 | −100,00 | 0,00 | −100,00 | −0,1481 | ||||
| ESTE / Earthstone Energy Inc - Class A | 0,00 | −100,00 | 0,00 | −100,00 | −1,2881 | ||||
| EGRX / Eagle Pharmaceuticals, Inc. | 0,00 | −100,00 | 0,00 | −100,00 | −0,5354 | ||||
| WOR / Worthington Enterprises, Inc. | 0,00 | −100,00 | 0,00 | −100,00 | −0,9489 | ||||
| CHS / Chico's FAS, Inc. | 0,00 | −100,00 | 0,00 | −100,00 | −0,7226 |