Grundläggande statistik
| Portföljvärde | $ 77 501 000 |
| Aktuella positioner | 56 |
Senaste innehav, resultat, förvaltat kapital (från 13F, 13D)
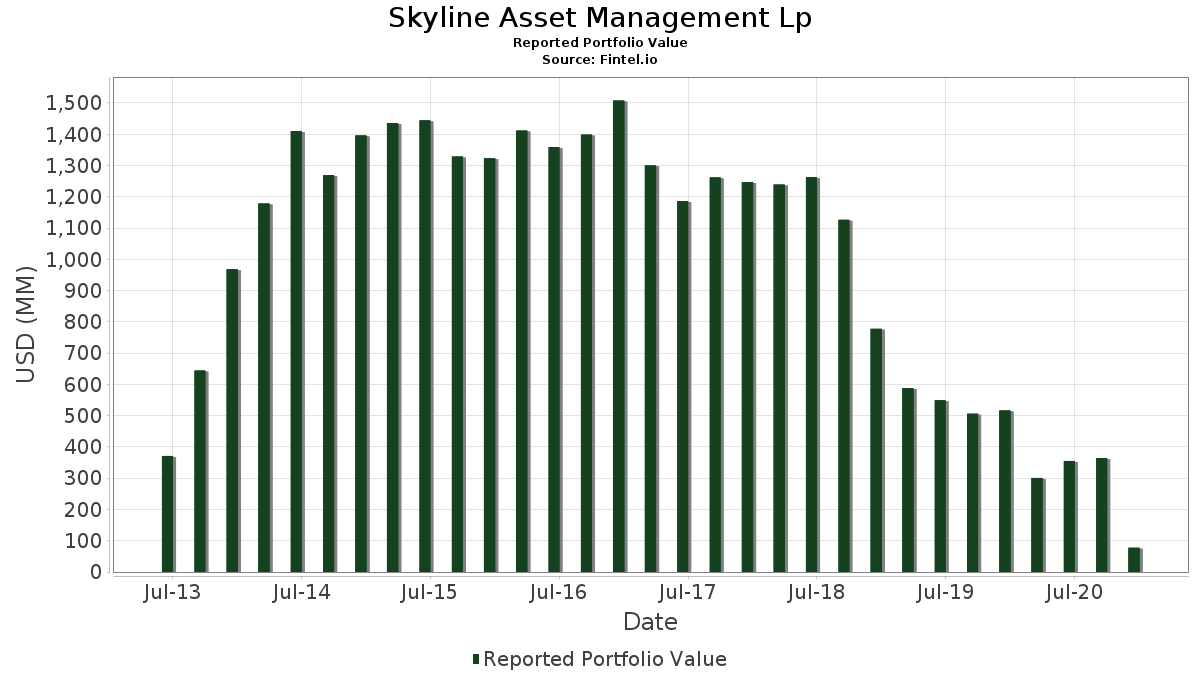
Skyline Asset Management Lp har redovisat 56 totala innehav i sina senaste SEC-arkiveringar. Det senaste portföljvärdet beräknas vara $ 77 501 000 USD. Faktiskt förvaltade tillgångar (AUM) är detta värde plus likvida medel (som inte redovisas). Skyline Asset Management Lps största innehav är Welbilt Inc (US:WBT) , The Children's Place, Inc. (US:PLCE) , Hillenbrand, Inc. (US:HI) , WSFS Financial Corporation (US:WSFS) , and BMC Stock Holdings, Inc. (US:) . Skyline Asset Management Lps nya positioner inkluderar Bed Bath & Beyond, Inc. (US:BBBY) , Bloomin' Brands, Inc. (US:BLMN) , Masonite International Corporation (US:DOOR) , PROG Holdings, Inc. (US:PRG) , and .
Största ökningarna detta kvartal
Vi använder förändringen i portföljallokeringen eftersom det är det mest meningsfulla måttet. Förändringar kan bero på transaktioner eller förändringar i aktiekurser.
| Värdepapper | Aktier (MM) |
Värde (MM$) |
Portfölj % av | ΔPortfölj % av |
|---|---|---|---|---|
| 0,03 | 1,30 | 1,6748 | 1,6748 | |
| 0,07 | 1,30 | 1,6722 | 1,6722 | |
| 0,06 | 1,25 | 1,6064 | 1,6064 | |
| 0,02 | 0,97 | 1,2503 | 1,2503 | |
| 0,01 | 0,90 | 1,1548 | 1,1548 | |
| 0,04 | 1,93 | 2,4955 | 1,0364 | |
| 0,01 | 0,68 | 0,8826 | 0,8826 | |
| 0,16 | 2,07 | 2,6658 | 0,8566 | |
| 0,09 | 1,67 | 2,1548 | 0,5456 | |
| 0,04 | 1,89 | 2,4322 | 0,5237 |
Största minskningarna detta kvartal
Vi använder förändringen i portföljallokeringen eftersom det är det mest meningsfulla måttet. Förändringar kan bero på transaktioner eller förändringar i aktiepriser.
| Värdepapper | Aktier (MM) |
Värde (MM$) |
Portfölj % av | ΔPortfölj % av |
|---|---|---|---|---|
| 0,00 | 0,00 | −2,1376 | ||
| 0,00 | 0,00 | −1,2739 | ||
| 0,00 | 0,00 | −1,1531 | ||
| 0,00 | 0,00 | −0,7590 | ||
| 0,05 | 1,29 | 1,6658 | −0,6371 | |
| 0,02 | 1,25 | 1,6090 | −0,4852 | |
| 0,03 | 1,82 | 2,3548 | −0,4775 | |
| 0,05 | 1,24 | 1,6038 | −0,4511 | |
| 0,03 | 1,44 | 1,8632 | −0,3996 | |
| 0,03 | 1,38 | 1,7845 | −0,3451 |
13F- och fond arkiveringar
Denna blankett lämnades in den 2021-01-26 för rapporteringsperioden 2020-12-31. Klicka på länksymbolen för att se hela transaktionshistoriken.
Uppgradera för att låsa upp premiumdata och exportera till Excel![]() .
.
| Värdepapper | Typ | Genomsnittligt aktiepris | Aktier (MM) |
ΔAktier (%) |
ΔAktier (%) |
Värde ($MM) |
Portfölj (%) |
ΔPortfölj (%) |
|
|---|---|---|---|---|---|---|---|---|---|
| WBT / Welbilt Inc | 0,16 | −85,37 | 2,07 | −68,64 | 2,6658 | 0,8566 | |||
| PLCE / The Children's Place, Inc. | 0,04 | −79,40 | 1,93 | −63,60 | 2,4955 | 1,0364 | |||
| HI / Hillenbrand, Inc. | 0,05 | −83,48 | 1,89 | −76,81 | 2,4348 | 0,2006 | |||
| WSFS / WSFS Financial Corporation | 0,04 | −83,70 | 1,89 | −72,88 | 2,4322 | 0,5237 | |||
| / BMC Stock Holdings, Inc. | 0,03 | −85,88 | 1,82 | −82,31 | 2,3548 | −0,4775 | |||
| OEC / Orion S.A. | 0,10 | −83,49 | 1,78 | −77,38 | 2,2916 | 0,1356 | |||
| DIN / Dine Brands Global, Inc. | 0,03 | −81,30 | 1,77 | −80,13 | 2,2903 | −0,1622 | |||
| ACHC / Acadia Healthcare Company, Inc. | 0,03 | −85,49 | 1,68 | −75,26 | 2,1664 | 0,3029 | |||
| STL / Sterling Bancorp. | 0,09 | −83,32 | 1,67 | −71,50 | 2,1548 | 0,5456 | |||
| ESNT / Essent Group Ltd. | 0,04 | −84,24 | 1,61 | −81,61 | 2,0787 | −0,3274 | |||
| US7846351044 / SPX Corp | 0,03 | −83,81 | 1,59 | −80,96 | 2,0555 | −0,2422 | |||
| BUSE / First Busey Corporation | 0,07 | −83,26 | 1,57 | −77,30 | 2,0245 | 0,1267 | |||
| TRS / TriMas Corporation | 0,05 | −83,66 | 1,57 | −77,30 | 2,0232 | 0,1267 | |||
| FOCS / Focus Financial Partners Inc - Class A | 0,04 | −83,42 | 1,55 | −78,00 | 1,9987 | 0,0654 | |||
| BXS / BancorpSouth Bank | 0,06 | −83,23 | 1,54 | −76,26 | 1,9897 | 0,2058 | |||
| UMPQ / Umpqua Holdings Corp | 0,10 | −83,35 | 1,53 | −76,26 | 1,9780 | 0,2046 | |||
| UMBF / UMB Financial Corporation | 0,02 | −83,42 | 1,48 | −76,67 | 1,9135 | 0,1678 | |||
| MAN / ManpowerGroup Inc. | 0,02 | −81,88 | 1,48 | −77,71 | 1,9084 | 0,0861 | |||
| SANM / Sanmina Corporation | 0,05 | −84,16 | 1,48 | −81,31 | 1,9058 | −0,2647 | |||
| KN / Knowles Corporation | 0,08 | −84,24 | 1,47 | −80,51 | 1,8929 | −0,1738 | |||
| LCII / LCI Industries | 0,01 | −83,50 | 1,45 | −79,87 | 1,8735 | −0,1075 | |||
| MTX / Minerals Technologies Inc. | 0,02 | −84,05 | 1,45 | −80,62 | 1,8671 | −0,1832 | |||
| PRFT / Perficient, Inc. | 0,03 | −84,28 | 1,44 | −82,48 | 1,8632 | −0,3996 | |||
| KLIC / Kulicke and Soffa Industries, Inc. | 0,04 | −83,49 | 1,43 | −76,56 | 1,8426 | 0,1699 | |||
| KFY / Korn Ferry | 0,03 | −81,57 | 1,42 | −72,36 | 1,8348 | 0,4219 | |||
| RGA / Reinsurance Group of America, Incorporated | 0,01 | −84,03 | 1,40 | −80,55 | 1,8090 | −0,1709 | |||
| NBHC / National Bank Holdings Corporation | 0,04 | −83,27 | 1,40 | −79,13 | 1,8051 | −0,0353 | |||
| BC / Brunswick Corporation | 0,02 | −83,96 | 1,40 | −79,25 | 1,8000 | −0,0460 | |||
| TTMI / TTM Technologies, Inc. | 0,10 | −84,18 | 1,38 | −80,87 | 1,7858 | −0,2005 | |||
| BECN / Beacon Roofing Supply, Inc. | 0,03 | −86,22 | 1,38 | −82,17 | 1,7845 | −0,3451 | |||
| FOE / Ferro Corp. | 0,09 | −84,24 | 1,38 | −81,41 | 1,7780 | −0,2579 | |||
| ROCK / Gibraltar Industries, Inc. | 0,02 | −83,39 | 1,37 | −81,66 | 1,7729 | −0,2842 | |||
| RXN / Rexnord Corp | 0,03 | −83,90 | 1,35 | −78,69 | 1,7380 | 0,0022 | |||
| AMWD / American Woodmark Corporation | 0,01 | −84,32 | 1,34 | −81,26 | 1,7316 | −0,2354 | |||
| KMPR / Kemper Corporation | 0,02 | −84,20 | 1,31 | −81,83 | 1,6903 | −0,2899 | |||
| WGO / Winnebago Industries, Inc. | 0,02 | −81,05 | 1,30 | −78,01 | 1,6787 | 0,0541 | |||
| JRVR / James River Group Holdings, Ltd. | 0,03 | −31,07 | 1,30 | −23,87 | 1,6748 | 1,6748 | |||
| BBBY / Bed Bath & Beyond, Inc. | 0,07 | 1,30 | 1,6722 | 1,6722 | |||||
| SHYF / The Shyft Group, Inc. | 0,05 | −89,76 | 1,29 | −84,61 | 1,6658 | −0,6371 | |||
| NCR / NCR Corp. | 0,03 | −83,81 | 1,27 | −72,52 | 1,6438 | 0,3708 | |||
| CMP / Compass Minerals International, Inc. | 0,02 | −84,28 | 1,25 | −83,65 | 1,6090 | −0,4852 | |||
| BLMN / Bloomin' Brands, Inc. | 0,06 | 1,25 | 1,6064 | 1,6064 | |||||
| JELD / JELD-WEN Holding, Inc. | 0,05 | −85,20 | 1,24 | −83,39 | 1,6038 | −0,4511 | |||
| BHE / Benchmark Electronics, Inc. | 0,04 | −84,18 | 1,21 | −78,80 | 1,5626 | −0,0063 | |||
| FMBI / First Midwest Bancorp, Inc. | 0,08 | −84,15 | 1,21 | −76,58 | 1,5600 | 0,1422 | |||
| SIMO / Silicon Motion Technology Corporation - Depositary Receipt (Common Stock) | 0,02 | −83,89 | 1,17 | −79,46 | 1,5097 | −0,0548 | |||
| TPIC / TPI Composites, Inc. | 0,02 | −90,38 | 1,12 | −82,47 | 1,4503 | −0,3105 | |||
| CMCO / Columbus McKinnon Corporation | 0,03 | −84,43 | 1,12 | −81,93 | 1,4477 | −0,2571 | |||
| R / Ryder System, Inc. | 0,02 | −84,11 | 1,10 | −76,77 | 1,4180 | 0,1189 | |||
| WNS / WNS (Holdings) Limited | 0,02 | −84,03 | 1,09 | −82,02 | 1,4129 | −0,2592 | |||
| NPO / Enpro Inc. | 0,01 | −84,39 | 1,08 | −79,10 | 1,3935 | −0,0254 | |||
| THS / TreeHouse Foods, Inc. | 0,02 | −79,27 | 0,97 | −78,26 | 1,2503 | 1,2503 | |||
| DOOR / Masonite International Corporation | 0,01 | 0,90 | 1,1548 | 1,1548 | |||||
| AMN / AMN Healthcare Services, Inc. | 0,01 | −83,84 | 0,87 | −81,14 | 1,1187 | −0,1434 | |||
| PRG / PROG Holdings, Inc. | 0,01 | 0,68 | 0,8826 | 0,8826 | |||||
| PBH / Prestige Consumer Healthcare Inc. | 0,01 | −84,05 | 0,51 | −84,72 | 0,6529 | −0,2563 | |||
| AAN / The Aaron's Company, Inc. | 0,00 | −100,00 | 0,00 | −100,00 | −2,1376 | ||||
| VREX / Varex Imaging Corporation | 0,00 | −100,00 | 0,00 | −100,00 | −0,7590 | ||||
| NP / Neenah Inc | 0,00 | −100,00 | 0,00 | −100,00 | −1,2739 | ||||
| US4989042001 / Knoll Inc | 0,00 | −100,00 | 0,00 | −100,00 | −1,1531 |