Grundläggande statistik
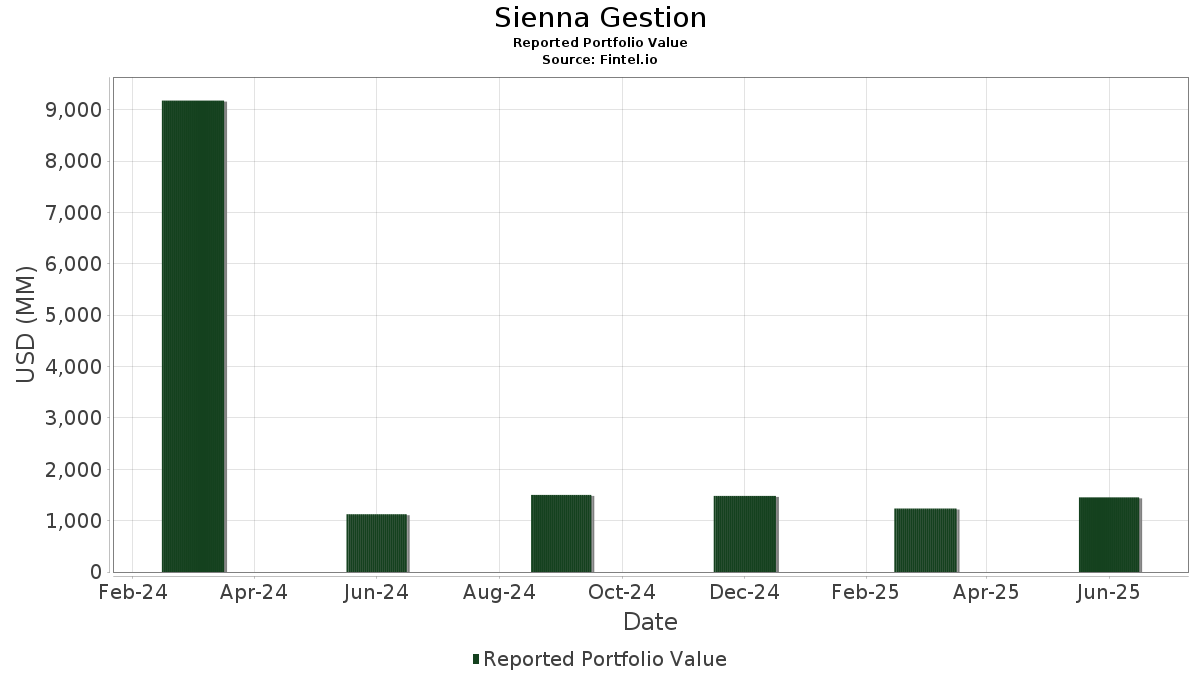
| Portföljvärde | $ 1 453 477 402 |
| Aktuella positioner | 159 |
Senaste innehav, resultat, förvaltat kapital (från 13F, 13D)
Sienna Gestion har redovisat 159 totala innehav i sina senaste SEC-arkiveringar. Det senaste portföljvärdet beräknas vara $ 1 453 477 402 USD. Faktiskt förvaltade tillgångar (AUM) är detta värde plus likvida medel (som inte redovisas). Sienna Gestions största innehav är NVIDIA Corporation (US:NVDA) , Microsoft Corporation (US:MSFT) , Apple Inc. (US:AAPL) , Amazon.com, Inc. (US:AMZN) , and Broadcom Inc. (US:AVGO) . Sienna Gestions nya positioner inkluderar BlackRock, Inc. (US:BLK) , International Business Machines Corporation (US:IBM) , Capital One Financial Corporation (US:COF) , .
Största ökningarna detta kvartal
Vi använder förändringen i portföljallokeringen eftersom det är det mest meningsfulla måttet. Förändringar kan bero på transaktioner eller förändringar i aktiekurser.
| Värdepapper | Aktier (MM) |
Värde (MM$) |
Portfölj % av | ΔPortfölj % av |
|---|---|---|---|---|
| 1,28 | 34,39 | 2,3664 | 2,3664 | |
| 0,71 | 102,98 | 7,0849 | 1,6413 | |
| 0,58 | 17,79 | 1,2239 | 1,2239 | |
| 0,02 | 14,45 | 0,9943 | 0,9943 | |
| 0,21 | 95,82 | 6,5926 | 0,8852 | |
| 0,15 | 38,59 | 2,6548 | 0,8236 | |
| 0,04 | 9,90 | 0,6810 | 0,6810 | |
| 0,05 | 9,72 | 0,6688 | 0,6688 | |
| 0,03 | 9,25 | 0,6362 | 0,1609 | |
| 0,04 | 8,07 | 0,5551 | 0,1512 |
Största minskningarna detta kvartal
Vi använder förändringen i portföljallokeringen eftersom det är det mest meningsfulla måttet. Förändringar kan bero på transaktioner eller förändringar i aktiepriser.
| Värdepapper | Aktier (MM) |
Värde (MM$) |
Portfölj % av | ΔPortfölj % av |
|---|---|---|---|---|
| 0,42 | 78,26 | 5,3841 | −1,4123 | |
| 0,03 | 7,64 | 0,5254 | −0,4779 | |
| 0,15 | 21,66 | 1,4901 | −0,3234 | |
| 0,13 | 18,14 | 1,2478 | −0,2956 | |
| 0,16 | 6,94 | 0,4774 | −0,2409 | |
| 0,07 | 18,92 | 1,3019 | −0,2342 | |
| 0,33 | 11,61 | 0,7990 | −0,2335 | |
| 0,07 | 23,18 | 1,5946 | −0,2115 | |
| 0,02 | 14,44 | 0,9935 | −0,2047 | |
| 0,03 | 9,51 | 0,6540 | −0,1514 |
13F- och fond arkiveringar
Denna blankett lämnades in den 2025-08-06 för rapporteringsperioden 2025-06-30. Klicka på länksymbolen för att se hela transaktionshistoriken.
Uppgradera för att låsa upp premiumdata och exportera till Excel![]() .
.
| Värdepapper | Typ | Genomsnittligt aktiepris | Aktier (MM) |
ΔAktier (%) |
ΔAktier (%) |
Värde ($MM) |
Portfölj (%) |
ΔPortfölj (%) |
|
|---|---|---|---|---|---|---|---|---|---|
| NVDA / NVIDIA Corporation | 0,71 | 11,76 | 102,98 | 53,02 | 7,0849 | 1,6413 | |||
| MSFT / Microsoft Corporation | 0,21 | 9,12 | 95,82 | 35,80 | 6,5926 | 0,8852 | |||
| AAPL / Apple Inc. | 0,42 | 7,36 | 78,26 | −6,86 | 5,3841 | −1,4123 | |||
| AMZN / Amazon.com, Inc. | 0,25 | 7,73 | 49,72 | 16,68 | 3,4207 | −0,0261 | |||
| AVGO / Broadcom Inc. | 0,15 | 10,22 | 38,59 | 70,44 | 2,6548 | 0,8236 | |||
| DB / Deutsche Bank Aktiengesellschaft | 1,28 | 34,39 | 2,3664 | 2,3664 | |||||
| JPM / JPMorgan Chase & Co. | 0,09 | 10,07 | 23,23 | 22,18 | 1,5984 | 0,0603 | |||
| HD / The Home Depot, Inc. | 0,07 | 10,47 | 23,18 | 3,80 | 1,5946 | −0,2115 | |||
| PG / The Procter & Gamble Company | 0,15 | 10,02 | 21,66 | −3,40 | 1,4901 | −0,3234 | |||
| CM / Canadian Imperial Bank of Commerce | 0,32 | 10,38 | 20,64 | 30,58 | 1,4201 | 0,1415 | |||
| BKNG / Booking Holdings Inc. | 0,00 | 10,48 | 19,56 | 30,40 | 1,3455 | 0,1324 | |||
| AMAT / Applied Materials, Inc. | 0,11 | 10,19 | 18,92 | 30,56 | 1,3020 | 0,1295 | |||
| ACN / Accenture plc | 0,07 | 10,76 | 18,92 | −0,35 | 1,3019 | −0,2342 | |||
| TD / The Toronto-Dominion Bank | 0,27 | 11,04 | 18,40 | 27,79 | 1,2660 | 0,1013 | |||
| INTU / Intuit Inc. | 0,03 | 10,00 | 18,30 | 32,55 | 1,2589 | 0,1422 | |||
| JNJ / Johnson & Johnson | 0,13 | 9,88 | 18,14 | −4,94 | 1,2478 | −0,2956 | |||
| UBS / UBS Group AG | 0,58 | 17,79 | 1,2239 | 1,2239 | |||||
| COST / Costco Wholesale Corporation | 0,02 | 10,53 | 17,14 | 8,67 | 1,1790 | −0,0966 | |||
| AXP / American Express Company | 0,06 | 10,72 | 16,09 | 23,29 | 1,1073 | 0,0514 | |||
| AMP / Ameriprise Financial, Inc. | 0,03 | 10,94 | 14,50 | 14,88 | 0,9974 | −0,0233 | |||
| BLK / BlackRock, Inc. | 0,02 | 14,45 | 0,9943 | 0,9943 | |||||
| LLY / Eli Lilly and Company | 0,02 | 9,97 | 14,44 | −2,52 | 0,9935 | −0,2047 | |||
| UBER / Uber Technologies, Inc. | 0,17 | 10,58 | 14,35 | 33,01 | 0,9870 | 0,1145 | |||
| CSCO / Cisco Systems, Inc. | 0,22 | 11,04 | 14,18 | 17,26 | 0,9757 | −0,0026 | |||
| CMI / Cummins Inc. | 0,04 | 9,86 | 13,30 | 7,81 | 0,9152 | −0,0828 | |||
| CRM / Salesforce, Inc. | 0,05 | 10,56 | 12,13 | 5,51 | 0,8347 | −0,0953 | |||
| FFIV / F5, Inc. | 0,04 | 11,04 | 11,74 | 15,28 | 0,8075 | −0,0160 | |||
| BR / Broadridge Financial Solutions, Inc. | 0,05 | 9,88 | 11,71 | 3,44 | 0,8058 | −0,1100 | |||
| BKR / Baker Hughes Company | 0,33 | 11,04 | 11,61 | −9,02 | 0,7990 | −0,2335 | |||
| CAT / Caterpillar Inc. | 0,03 | 10,12 | 11,57 | 21,75 | 0,7959 | 0,0273 | |||
| V / Visa Inc. | 0,03 | 11,04 | 11,34 | 5,66 | 0,7799 | −0,0879 | |||
| EBAY / eBay Inc. | 0,17 | 11,04 | 11,34 | 14,66 | 0,7799 | −0,0198 | |||
| SLF / Sun Life Financial Inc. | 0,19 | 11,02 | 11,30 | 21,01 | 0,7775 | 0,0221 | |||
| PNR / Pentair plc | 0,12 | 10,82 | 11,22 | 22,15 | 0,7717 | 0,0289 | |||
| CMCSA / Comcast Corporation | 0,34 | 11,04 | 11,20 | 0,87 | 0,7702 | −0,1275 | |||
| TT / Trane Technologies plc | 0,03 | 10,33 | 11,10 | 34,55 | 0,7639 | 0,0964 | |||
| MTB / M&T Bank Corporation | 0,06 | 11,04 | 10,83 | 13,19 | 0,7454 | −0,0289 | |||
| TROW / T. Rowe Price Group, Inc. | 0,12 | 10,17 | 10,72 | 8,69 | 0,7378 | −0,0602 | |||
| ISRG / Intuitive Surgical, Inc. | 0,02 | 10,25 | 10,60 | 13,61 | 0,7294 | −0,0254 | |||
| MCD / McDonald's Corporation | 0,04 | 11,04 | 10,49 | −2,44 | 0,7220 | −0,1482 | |||
| AEM / Agnico Eagle Mines Limited | 0,10 | 10,29 | 10,36 | 13,70 | 0,7126 | −0,0242 | |||
| IBM / International Business Machines Corporation | 0,04 | 9,90 | 0,6810 | 0,6810 | |||||
| VZ / Verizon Communications Inc. | 0,25 | 10,36 | 9,78 | −1,11 | 0,6731 | −0,1272 | |||
| TRV / The Travelers Companies, Inc. | 0,04 | 11,54 | 9,75 | 5,98 | 0,6710 | −0,0734 | |||
| AVB / AvalonBay Communities, Inc. | 0,05 | 11,04 | 9,73 | −1,11 | 0,6692 | −0,1264 | |||
| COF / Capital One Financial Corporation | 0,05 | 9,72 | 0,6688 | 0,6688 | |||||
| ATO / Atmos Energy Corporation | 0,07 | 8,97 | 9,60 | 2,04 | 0,6604 | −0,1005 | |||
| SNA / Snap-on Incorporated | 0,03 | 10,08 | 9,51 | −4,53 | 0,6540 | −0,1514 | |||
| ETR / Entergy Corporation | 0,12 | 9,99 | 9,27 | 0,43 | 0,6381 | −0,1088 | |||
| RCL / Royal Caribbean Cruises Ltd. | 0,03 | 9,93 | 9,25 | 57,38 | 0,6362 | 0,1609 | |||
| DIS / The Walt Disney Company | 0,08 | 11,04 | 9,05 | 31,04 | 0,6224 | 0,0640 | |||
| STT / State Street Corporation | 0,09 | 10,03 | 8,93 | 22,74 | 0,6142 | 0,0259 | |||
| ADBE / Adobe Inc. | 0,03 | 10,69 | 8,87 | 4,87 | 0,6105 | −0,0739 | |||
| PANW / Palo Alto Networks, Inc. | 0,05 | 10,17 | 8,70 | 24,10 | 0,5983 | 0,0315 | |||
| VLO / Valero Energy Corporation | 0,07 | 11,04 | 8,51 | 6,15 | 0,5856 | −0,0630 | |||
| A / Agilent Technologies, Inc. | 0,08 | 10,27 | 8,46 | 4,48 | 0,5821 | −0,0729 | |||
| MPC / Marathon Petroleum Corporation | 0,06 | 11,04 | 8,36 | 18,91 | 0,5751 | 0,0065 | |||
| EQR / Equity Residential | 0,13 | 11,04 | 8,27 | −1,66 | 0,5691 | −0,1113 | |||
| EXPD / Expeditors International of Washington, Inc. | 0,08 | 10,37 | 8,26 | −1,51 | 0,5685 | −0,1101 | |||
| ORCL / Oracle Corporation | 0,04 | 10,02 | 8,07 | 61,62 | 0,5551 | 0,1512 | |||
| KR / The Kroger Co. | 0,12 | 10,21 | 7,98 | 9,69 | 0,5493 | −0,0395 | |||
| QCOM / QUALCOMM Incorporated | 0,05 | 9,72 | 7,97 | 6,83 | 0,5485 | −0,0551 | |||
| WMT / Walmart Inc. | 0,09 | 11,04 | 7,89 | 16,16 | 0,5426 | −0,0066 | |||
| PYPL / PayPal Holdings, Inc. | 0,12 | 10,29 | 7,83 | 17,99 | 0,5389 | 0,0019 | |||
| CTSH / Cognizant Technology Solutions Corporation | 0,11 | 10,00 | 7,77 | 5,38 | 0,5349 | −0,0619 | |||
| FTNT / Fortinet, Inc. | 0,08 | 10,06 | 7,72 | 13,53 | 0,5312 | −0,0189 | |||
| UNH / UnitedHealth Group Incorporated | 0,03 | 10,05 | 7,64 | −38,43 | 0,5254 | −0,4779 | |||
| KMB / Kimberly-Clark Corporation | 0,06 | 11,04 | 7,57 | −5,46 | 0,5206 | −0,1268 | |||
| LRCX / Lam Research Corporation | 0,08 | 9,21 | 7,52 | 37,35 | 0,5177 | 0,0745 | |||
| HIG / The Hartford Insurance Group, Inc. | 0,06 | 9,85 | 7,48 | 5,78 | 0,5147 | −0,0573 | |||
| PAYX / Paychex, Inc. | 0,06 | 10,01 | 7,45 | −2,59 | 0,5128 | −0,1061 | |||
| AWK / American Water Works Company, Inc. | 0,06 | 11,04 | 7,43 | −1,64 | 0,5112 | −0,0999 | |||
| CMG / Chipotle Mexican Grill, Inc. | 0,14 | 11,04 | 7,39 | 16,64 | 0,5087 | −0,0041 | |||
| WM / Waste Management, Inc. | 0,03 | 10,76 | 7,18 | 2,82 | 0,4937 | −0,0708 | |||
| EME / EMCOR Group, Inc. | 0,01 | 11,04 | 7,18 | 50,93 | 0,4937 | 0,1091 | |||
| AMD / Advanced Micro Devices, Inc. | 0,05 | 11,04 | 7,12 | 44,05 | 0,4898 | 0,0900 | |||
| ANSS / ANSYS, Inc. | 0,02 | 10,32 | 7,06 | 14,97 | 0,4857 | −0,0110 | |||
| BMY / Bristol-Myers Squibb Company | 0,16 | 9,62 | 6,94 | −21,86 | 0,4774 | −0,2409 | |||
| CPRT / Copart, Inc. | 0,15 | 10,06 | 6,86 | −10,37 | 0,4720 | −0,1471 | |||
| RMD / ResMed Inc. | 0,03 | 10,06 | 6,84 | 19,15 | 0,4705 | 0,0062 | |||
| MKC / McCormick & Company, Incorporated | 0,09 | 11,04 | 6,43 | −3,93 | 0,4423 | −0,0990 | |||
| FOX / Fox Corporation | 0,13 | 9,65 | 6,28 | 0,87 | 0,4321 | −0,0715 | |||
| BBY / Best Buy Co., Inc. | 0,10 | 10,35 | 6,22 | −5,49 | 0,4279 | −0,1043 | |||
| HUBB / Hubbell Incorporated | 0,02 | 11,04 | 6,12 | 28,72 | 0,4209 | 0,0365 | |||
| SHOP / Shopify Inc. | 0,06 | 11,00 | 6,04 | 26,19 | 0,4158 | 0,0284 | |||
| ELV / Elevance Health, Inc. | 0,02 | 9,91 | 5,93 | −7,70 | 0,4083 | −0,1117 | |||
| KO / The Coca-Cola Company | 0,09 | 11,04 | 5,80 | 3,04 | 0,3991 | −0,0563 | |||
| GILD / Gilead Sciences, Inc. | 0,06 | 10,39 | 5,70 | 2,59 | 0,3918 | −0,0572 | |||
| AMGN / Amgen Inc. | 0,02 | 10,65 | 5,69 | −6,86 | 0,3913 | −0,1026 | |||
| JNPR / Juniper Networks, Inc. | 0,16 | 11,04 | 5,68 | 15,09 | 0,3910 | −0,0085 | |||
| MU / Micron Technology, Inc. | 0,05 | 0,00 | 5,64 | 33,24 | 0,3884 | 0,0456 | |||
| ANET / Arista Networks Inc | 0,06 | 0,00 | 5,64 | 24,03 | 0,3882 | 0,0202 | |||
| PFE / Pfizer Inc. | 0,25 | 11,04 | 5,61 | −0,23 | 0,3860 | −0,0689 | |||
| DAL / Delta Air Lines, Inc. | 0,12 | 11,40 | 5,56 | 18,01 | 0,3823 | 0,0015 | |||
| ED / Consolidated Edison, Inc. | 0,06 | 11,04 | 5,42 | −5,36 | 0,3728 | −0,0903 | |||
| PLD / Prologis, Inc. | 0,06 | 11,04 | 5,38 | −1,93 | 0,3703 | −0,0736 | |||
| CI / The Cigna Group | 0,02 | 11,04 | 5,31 | 4,80 | 0,3653 | −0,0445 | |||
| WBD / Warner Bros. Discovery, Inc. | 0,51 | 0,00 | 5,29 | 0,30 | 0,3639 | −0,0626 | |||
| JKHY / Jack Henry & Associates, Inc. | 0,03 | 11,04 | 5,25 | 2,90 | 0,3613 | −0,0515 | |||
| CNI / Canadian National Railway Company | 0,06 | 11,04 | 5,25 | 11,46 | 0,3612 | −0,0198 | |||
| DOCU / DocuSign, Inc. | 0,07 | 11,04 | 5,15 | −0,21 | 0,3541 | −0,0631 | |||
| GS / The Goldman Sachs Group, Inc. | 0,01 | 0,00 | 4,99 | 21,67 | 0,3434 | 0,0116 | |||
| MFC / Manulife Financial Corporation | 0,17 | 11,06 | 4,86 | 6,84 | 0,3342 | −0,0336 | |||
| REGN / Regeneron Pharmaceuticals, Inc. | 0,01 | 10,44 | 4,85 | −14,14 | 0,3338 | −0,1232 | |||
| GIB / CGI Inc. | 0,05 | 11,11 | 4,78 | 9,57 | 0,3292 | −0,0240 | |||
| VEEV / Veeva Systems Inc. | 0,02 | 0,00 | 4,62 | 16,77 | 0,3176 | −0,0022 | |||
| PSX / Phillips 66 | 0,04 | 0,00 | 4,49 | −9,25 | 0,3086 | −0,0912 | |||
| OKE / ONEOK, Inc. | 0,06 | 11,04 | 4,37 | −14,20 | 0,3009 | −0,1114 | |||
| GOOGL / Alphabet Inc. | 0,03 | 0,00 | 4,21 | 7,05 | 0,2895 | −0,0285 | |||
| SNPS / Synopsys, Inc. | 0,01 | 0,00 | 4,04 | 12,30 | 0,2782 | −0,0131 | |||
| STLD / Steel Dynamics, Inc. | 0,03 | 0,00 | 4,01 | −3,86 | 0,2756 | −0,0615 | |||
| IPG / The Interpublic Group of Companies, Inc. | 0,17 | 0,00 | 3,89 | −15,33 | 0,2676 | −0,1040 | |||
| GIS / General Mills, Inc. | 0,08 | 0,00 | 3,86 | −18,61 | 0,2657 | −0,1181 | |||
| META / Meta Platforms, Inc. | 0,01 | 0,00 | 3,59 | 20,27 | 0,2470 | 0,0056 | |||
| TMO / Thermo Fisher Scientific Inc. | 0,01 | 0,00 | 3,58 | −23,47 | 0,2466 | −0,1322 | |||
| LDOS / Leidos Holdings, Inc. | 0,02 | 0,00 | 3,15 | 9,80 | 0,2167 | −0,0153 | |||
| TEAM / Atlassian Corporation | 0,02 | 0,00 | 3,07 | −10,09 | 0,2115 | −0,0651 | |||
| DECK / Deckers Outdoor Corporation | 0,03 | 0,00 | 2,37 | −13,43 | 0,1633 | −0,0584 | |||
| TSLA / Tesla, Inc. | 0,01 | 20,12 | 2,16 | 38,36 | 0,1489 | 0,0223 | |||
| CCJ / Cameco Corporation | 0,03 | −10,92 | 2,07 | 50,98 | 0,1424 | 0,0314 | |||
| CCEP / Coca-Cola Europacific Partners PLC | 0,02 | 0,00 | 1,99 | 0,05 | 0,1368 | −0,0239 | |||
| MS / Morgan Stanley | 0,01 | 0,00 | 1,20 | 13,41 | 0,0827 | −0,0030 | |||
| NEM / Newmont Corporation | 0,02 | −22,93 | 1,04 | −12,66 | 0,0713 | −0,0247 | |||
| CSX / CSX Corporation | 0,03 | 0,00 | 0,98 | 4,17 | 0,0671 | −0,0087 | |||
| GD / General Dynamics Corporation | 0,00 | 0,00 | 0,92 | 0,55 | 0,0634 | −0,0108 | |||
| AFL / Aflac Incorporated | 0,01 | 0,00 | 0,88 | −10,89 | 0,0608 | −0,0195 | |||
| SPG / Simon Property Group, Inc. | 0,01 | 0,00 | 0,86 | −9,07 | 0,0593 | −0,0174 | |||
| ABBV / AbbVie Inc. | 0,00 | 0,00 | 0,84 | −16,75 | 0,0578 | −0,0239 | |||
| AMT / American Tower Corporation | 0,00 | 0,00 | 0,80 | −4,67 | 0,0549 | −0,0128 | |||
| EMR / Emerson Electric Co. | 0,01 | 0,00 | 0,73 | 14,20 | 0,0504 | −0,0015 | |||
| NFLX / Netflix, Inc. | 0,00 | 0,00 | 0,71 | 34,97 | 0,0491 | 0,0063 | |||
| SYF / Synchrony Financial | 0,01 | 0,00 | 0,71 | 18,50 | 0,0489 | 0,0003 | |||
| DRI / Darden Restaurants, Inc. | 0,00 | 0,00 | 0,70 | −1,54 | 0,0484 | −0,0093 | |||
| MCO / Moody's Corporation | 0,00 | 0,00 | 0,69 | 1,17 | 0,0477 | −0,0077 | |||
| CAH / Cardinal Health, Inc. | 0,00 | 0,00 | 0,66 | 14,51 | 0,0451 | −0,0012 | |||
| ZS / Zscaler, Inc. | 0,00 | 0,00 | 0,64 | 48,73 | 0,0444 | 0,0093 | |||
| LMT / Lockheed Martin Corporation | 0,00 | 0,00 | 0,63 | −2,64 | 0,0432 | −0,0090 | |||
| RPM / RPM International Inc. | 0,01 | 0,00 | 0,63 | −10,80 | 0,0432 | −0,0138 | |||
| EXPE / Expedia Group, Inc. | 0,00 | 0,00 | 0,60 | −5,83 | 0,0412 | −0,0102 | |||
| PLTR / Palantir Technologies Inc. | 0,00 | 0,00 | 0,59 | 51,93 | 0,0407 | 0,0092 | |||
| NDAQ / Nasdaq, Inc. | 0,01 | 0,00 | 0,58 | 10,73 | 0,0398 | −0,0025 | |||
| SSNC / SS&C Technologies Holdings, Inc. | 0,01 | 0,00 | 0,55 | −6,94 | 0,0379 | −0,0099 | |||
| ELS / Equity LifeStyle Properties, Inc. | 0,01 | 0,00 | 0,55 | −13,29 | 0,0378 | −0,0134 | |||
| KEYS / Keysight Technologies, Inc. | 0,00 | 0,00 | 0,54 | 2,86 | 0,0372 | −0,0054 | |||
| FTS / Fortis Inc. | 0,01 | 0,00 | 0,53 | −1,85 | 0,0365 | −0,0072 | |||
| ITW / Illinois Tool Works Inc. | 0,00 | 0,00 | 0,45 | −6,43 | 0,0311 | −0,0079 | |||
| OC / Owens Corning | 0,00 | 0,00 | 0,45 | −9,66 | 0,0309 | −0,0093 | |||
| HII / Huntington Ingalls Industries, Inc. | 0,00 | 0,00 | 0,43 | 11,31 | 0,0298 | −0,0017 | |||
| CF / CF Industries Holdings, Inc. | 0,01 | 0,00 | 0,42 | 10,53 | 0,0290 | −0,0018 | |||
| KHC / The Kraft Heinz Company | 0,02 | 0,00 | 0,41 | −20,39 | 0,0280 | −0,0133 | |||
| TFII / TFI International Inc. | 0,00 | 0,00 | 0,39 | 8,59 | 0,0270 | −0,0022 | |||
| PH / Parker-Hannifin Corporation | 0,00 | 0,00 | 0,39 | 8,10 | 0,0266 | −0,0024 | |||
| DD / DuPont de Nemours, Inc. | 0,01 | 0,00 | 0,36 | −13,81 | 0,0249 | −0,0091 | |||
| UHS / Universal Health Services, Inc. | 0,00 | 0,00 | 0,36 | −9,55 | 0,0248 | −0,0074 | |||
| TECH / Bio-Techne Corporation | 0,01 | 0,00 | 0,34 | −17,56 | 0,0233 | −0,0099 | |||
| AOS / A. O. Smith Corporation | 0,01 | 0,00 | 0,32 | −5,87 | 0,0221 | −0,0055 | |||
| ECL / Ecolab Inc. | 0,00 | 0,00 | 0,15 | 0,00 | 0,0100 | −0,0018 | |||
| RY / Royal Bank of Canada | 0,00 | 0,00 | 0,07 | 10,17 | 0,0045 | −0,0003 | |||
| PBA / Pembina Pipeline Corporation | 0,00 | 0,00 | 0,00 | 0,0001 | −0,0000 | ||||
| INTC / Intel Corporation | 0,00 | −100,00 | 0,00 | 0,0000 | |||||
| BKN / BlackRock Investment Quality Municipal Trust Inc. | 0,00 | −100,00 | 0,00 | 0,0000 | |||||
| DFS / Discover Financial Services | 0,00 | −100,00 | 0,00 | 0,0000 | |||||
| GOLD / Barrick Mining Corporation | 0,00 | −100,00 | 0,00 | 0,0000 | |||||
| HCA / HCA Healthcare, Inc. | 0,00 | −100,00 | 0,00 | 0,0000 |