Grundläggande statistik
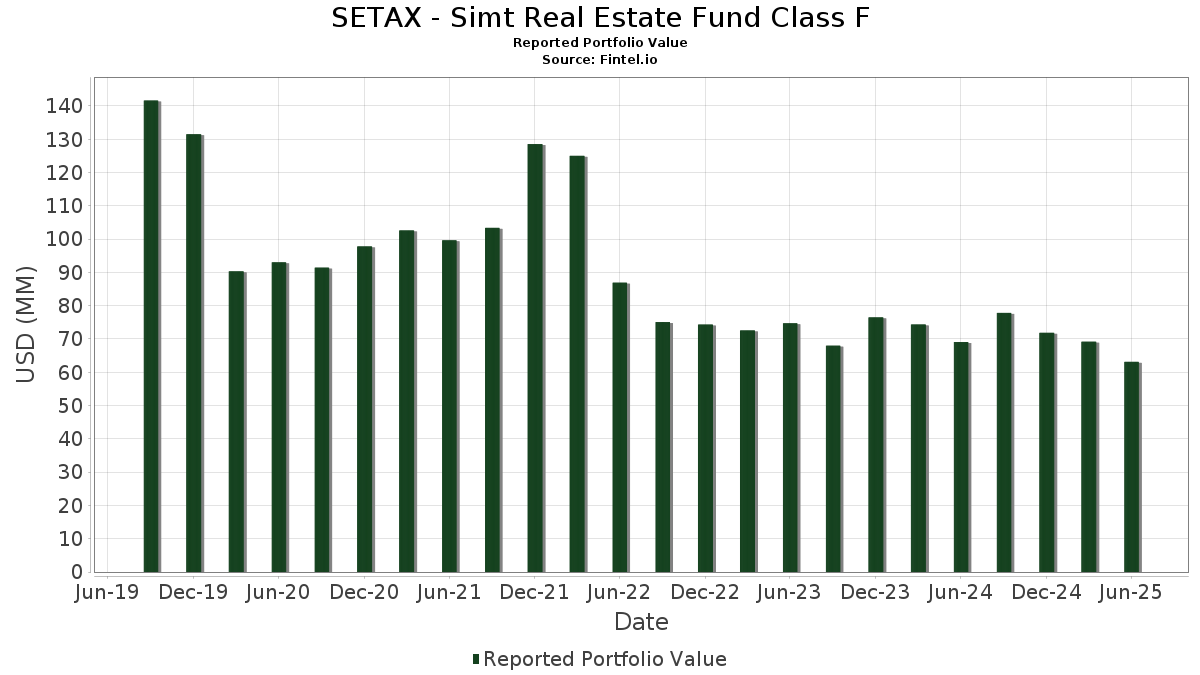
| Portföljvärde | $ 63 130 215 |
| Aktuella positioner | 59 |
Senaste innehav, resultat, förvaltat kapital (från 13F, 13D)
SETAX - Simt Real Estate Fund Class F har redovisat 59 totala innehav i sina senaste SEC-arkiveringar. Det senaste portföljvärdet beräknas vara $ 63 130 215 USD. Faktiskt förvaltade tillgångar (AUM) är detta värde plus likvida medel (som inte redovisas). SETAX - Simt Real Estate Fund Class Fs största innehav är American Tower Corporation (US:AMT) , Equinix, Inc. (US:EQIX) , Welltower Inc. (US:WELL) , Prologis, Inc. (US:PLD) , and Digital Realty Trust, Inc. (US:DLR) .
Största ökningarna detta kvartal
Vi använder förändringen i portföljallokeringen eftersom det är det mest meningsfulla måttet. Förändringar kan bero på transaktioner eller förändringar i aktiekurser.
| Värdepapper | Aktier (MM) |
Värde (MM$) |
Portfölj % av | ΔPortfölj % av |
|---|---|---|---|---|
| 1,62 | 1,62 | 2,5551 | 1,5326 | |
| 0,02 | 0,77 | 1,2140 | 0,6881 | |
| 0,02 | 2,87 | 4,5409 | 0,5331 | |
| 0,02 | 0,84 | 1,3256 | 0,4443 | |
| 0,03 | 0,49 | 0,7797 | 0,3910 | |
| 0,05 | 1,40 | 2,2141 | 0,3412 | |
| 0,06 | 1,35 | 2,1334 | 0,3007 | |
| 0,01 | 1,22 | 1,9331 | 0,2997 | |
| 0,02 | 0,77 | 1,2121 | 0,2957 | |
| 0,01 | 0,52 | 0,8188 | 0,2636 |
Största minskningarna detta kvartal
Vi använder förändringen i portföljallokeringen eftersom det är det mest meningsfulla måttet. Förändringar kan bero på transaktioner eller förändringar i aktiepriser.
| Värdepapper | Aktier (MM) |
Värde (MM$) |
Portfölj % av | ΔPortfölj % av |
|---|---|---|---|---|
| 0,04 | 1,18 | 1,8586 | −1,8254 | |
| 0,00 | 0,23 | 0,3605 | −0,6918 | |
| 0,03 | 3,30 | 5,2124 | −0,6671 | |
| 0,01 | 0,49 | 0,7703 | −0,6168 | |
| 0,00 | 0,84 | 1,3260 | −0,3625 | |
| 0,03 | 1,62 | 2,5662 | −0,3467 | |
| 0,02 | 0,77 | 1,2174 | −0,3423 | |
| 0,00 | 0,36 | 0,5636 | −0,3292 | |
| 0,01 | 0,61 | 0,9595 | −0,2960 | |
| 0,04 | 2,66 | 4,2011 | −0,2775 |
13F- och fond arkiveringar
Denna blankett lämnades in den 2025-08-28 för rapporteringsperioden 2025-06-30. Klicka på länksymbolen för att se hela transaktionshistoriken.
Uppgradera för att låsa upp premiumdata och exportera till Excel![]() .
.
| Värdepapper | Typ | Genomsnittligt aktiepris | Aktier (MM) |
ΔAktier (%) |
ΔAktier (%) |
Värde ($MM) |
Portfölj (%) |
ΔPortfölj (%) |
|
|---|---|---|---|---|---|---|---|---|---|
| AMT / American Tower Corporation | 0,02 | −11,49 | 4,14 | −10,10 | 6,5379 | −0,1028 | |||
| EQIX / Equinix, Inc. | 0,00 | −9,81 | 3,87 | −12,02 | 6,1215 | −0,2316 | |||
| WELL / Welltower Inc. | 0,02 | −6,38 | 3,68 | −6,06 | 5,8082 | 0,1620 | |||
| PLD / Prologis, Inc. | 0,03 | −13,91 | 3,30 | −19,05 | 5,2124 | −0,6671 | |||
| DLR / Digital Realty Trust, Inc. | 0,02 | −14,96 | 2,87 | 3,46 | 4,5409 | 0,5331 | |||
| VTR / Ventas, Inc. | 0,04 | −6,73 | 2,66 | −14,34 | 4,2011 | −0,2775 | |||
| EXR / Extra Space Storage Inc. | 0,02 | −7,50 | 2,35 | −8,14 | 3,7090 | 0,0216 | |||
| UDR / UDR, Inc. | 0,05 | −1,39 | 1,87 | −10,86 | 2,9582 | −0,0724 | |||
| CPT / Camden Property Trust | 0,02 | −6,78 | 1,72 | −14,10 | 2,7155 | −0,1715 | |||
| SBAC / SBA Communications Corporation | 0,01 | −7,56 | 1,69 | −1,34 | 2,6755 | 0,1994 | |||
| DOC / Healthpeak Properties, Inc. | 0,09 | 4,30 | 1,65 | −9,70 | 2,6054 | −0,0286 | |||
| O / Realty Income Corporation | 0,03 | −18,99 | 1,62 | −19,52 | 2,5662 | −0,3467 | |||
| US7839655930 / SEI DAILY INCOME TRUST GOVERNMENT FUND (#36) | 1,62 | 128,19 | 1,62 | 128,25 | 2,5551 | 1,5326 | |||
| EQR / Equity Residential | 0,02 | −2,43 | 1,41 | −8,03 | 2,2257 | 0,0164 | |||
| BRX / Brixmor Property Group Inc. | 0,05 | 10,06 | 1,40 | 7,94 | 2,2141 | 0,3412 | |||
| CCI / Crown Castle Inc. | 0,01 | −8,28 | 1,40 | −9,57 | 2,2109 | −0,0224 | |||
| SPG / Simon Property Group, Inc. | 0,01 | −13,28 | 1,36 | −16,06 | 2,1567 | −0,1894 | |||
| KIM / Kimco Realty Corporation | 0,06 | 7,41 | 1,35 | 6,30 | 2,1334 | 0,3007 | |||
| CBRE / CBRE Group, Inc. | 0,01 | −8,78 | 1,28 | −2,29 | 2,0237 | 0,1329 | |||
| ADC / Agree Realty Corporation | 0,02 | 8,03 | 1,26 | 2,19 | 1,9891 | 0,2126 | |||
| IRM / Iron Mountain Incorporated | 0,01 | −9,35 | 1,22 | 8,04 | 1,9331 | 0,2997 | |||
| INVH / Invitation Homes Inc. | 0,04 | −51,05 | 1,18 | −53,94 | 1,8586 | −1,8254 | |||
| HST / Host Hotels & Resorts, Inc. | 0,07 | −15,77 | 1,03 | −8,99 | 1,6337 | −0,0048 | |||
| KRG / Kite Realty Group Trust | 0,04 | 2,96 | 0,98 | 4,24 | 1,5562 | 0,1931 | |||
| CUZ / Cousins Properties Incorporated | 0,03 | −2,38 | 0,97 | −0,61 | 1,5370 | 0,1246 | |||
| WY / Weyerhaeuser Company | 0,03 | −6,82 | 0,86 | −18,23 | 1,3542 | −0,1583 | |||
| PSA / Public Storage | 0,00 | −26,85 | 0,84 | −28,29 | 1,3260 | −0,3625 | |||
| OHI / Omega Healthcare Investors, Inc. | 0,02 | 42,71 | 0,84 | 37,38 | 1,3256 | 0,4443 | |||
| CUBE / CubeSmart | 0,02 | 0,75 | 0,80 | 0,25 | 1,2673 | 0,1130 | |||
| AHR / American Healthcare REIT, Inc. | 0,02 | −13,46 | 0,77 | 4,88 | 1,2221 | 0,1586 | |||
| REXR / Rexford Industrial Realty, Inc. | 0,02 | −21,55 | 0,77 | −28,70 | 1,2174 | −0,3423 | |||
| AMH / American Homes 4 Rent | 0,02 | 120,95 | 0,77 | 110,99 | 1,2140 | 0,6881 | |||
| VICI / VICI Properties Inc. | 0,02 | 20,85 | 0,77 | 20,79 | 1,2121 | 0,2957 | |||
| VNO / Vornado Realty Trust | 0,02 | 3,96 | 0,72 | 7,43 | 1,1433 | 0,1718 | |||
| FRT / Federal Realty Investment Trust | 0,01 | −4,65 | 0,72 | −7,34 | 1,1378 | 0,0156 | |||
| BXP / Boston Properties, Inc. | 0,01 | −30,50 | 0,61 | −30,23 | 0,9595 | −0,2960 | |||
| FR / First Industrial Realty Trust, Inc. | 0,01 | −3,54 | 0,58 | −13,88 | 0,9119 | −0,0559 | |||
| NHI / National Health Investors, Inc. | 0,01 | 41,84 | 0,52 | 34,90 | 0,8188 | 0,2636 | |||
| BNL / Broadstone Net Lease, Inc. | 0,03 | 19,51 | 0,51 | 12,64 | 0,8029 | 0,1516 | |||
| HR / Healthcare Realty Trust Incorporated | 0,03 | 95,17 | 0,49 | 83,27 | 0,7797 | 0,3910 | |||
| NNN / NNN REIT, Inc. | 0,01 | −49,91 | 0,49 | −49,32 | 0,7703 | −0,6168 | |||
| NTST / NETSTREIT Corp. | 0,02 | −2,93 | 0,39 | 3,45 | 0,6178 | 0,0737 | |||
| SUI / Sun Communities, Inc. | 0,00 | −41,37 | 0,36 | −42,39 | 0,5636 | −0,3292 | |||
| DRH / DiamondRock Hospitality Company | 0,05 | 4,51 | 0,35 | 3,85 | 0,5549 | 0,0663 | |||
| LINE / Lineage, Inc. | 0,01 | −8,66 | 0,33 | −32,24 | 0,5220 | −0,1811 | |||
| MAC / The Macerich Company | 0,02 | 2,44 | 0,31 | −3,40 | 0,4950 | 0,0268 | |||
| ARE / Alexandria Real Estate Equities, Inc. | 0,00 | −9,57 | 0,29 | −29,06 | 0,4556 | −0,1304 | |||
| JLL / Jones Lang LaSalle Incorporated | 0,00 | −8,33 | 0,25 | −5,24 | 0,4001 | 0,0138 | |||
| IRT / Independence Realty Trust, Inc. | 0,01 | 32,51 | 0,24 | 45,24 | 0,3866 | 0,1608 | |||
| COLD / Americold Realty Trust, Inc. | 0,01 | −11,51 | 0,24 | −31,49 | 0,3718 | −0,1233 | |||
| LAMR / Lamar Advertising Company | 0,00 | −70,67 | 0,23 | −68,72 | 0,3605 | −0,6918 | |||
| ESRT / Empire State Realty Trust, Inc. | 0,03 | −0,34 | 0,21 | 2,93 | 0,3340 | 0,0382 | |||
| SHO / Sunstone Hotel Investors, Inc. | 0,02 | 84,31 | 0,20 | 69,75 | 0,3207 | 0,1484 | |||
| LXP / LXP Industrial Trust | 0,02 | −37,38 | 0,17 | −40,36 | 0,2652 | −0,1398 | |||
| DEI / Douglas Emmett, Inc. | 0,01 | −44,12 | 0,15 | −54,84 | 0,2441 | −0,2292 | |||
| FVR / FrontView REIT, Inc. | 0,01 | 49,76 | 0,15 | 40,57 | 0,2368 | 0,0829 | |||
| APLE / Apple Hospitality REIT, Inc. | 0,01 | −53,38 | 0,12 | −63,33 | 0,1914 | −0,2325 | |||
| ELME / Elme Communities | 0,01 | −60,18 | 0,12 | −54,65 | 0,1855 | −0,1607 | |||
| HPP / Hudson Pacific Properties, Inc. | 0,02 | 65,98 | 0,07 | −58,54 | 0,1082 | −0,1110 |