Grundläggande statistik
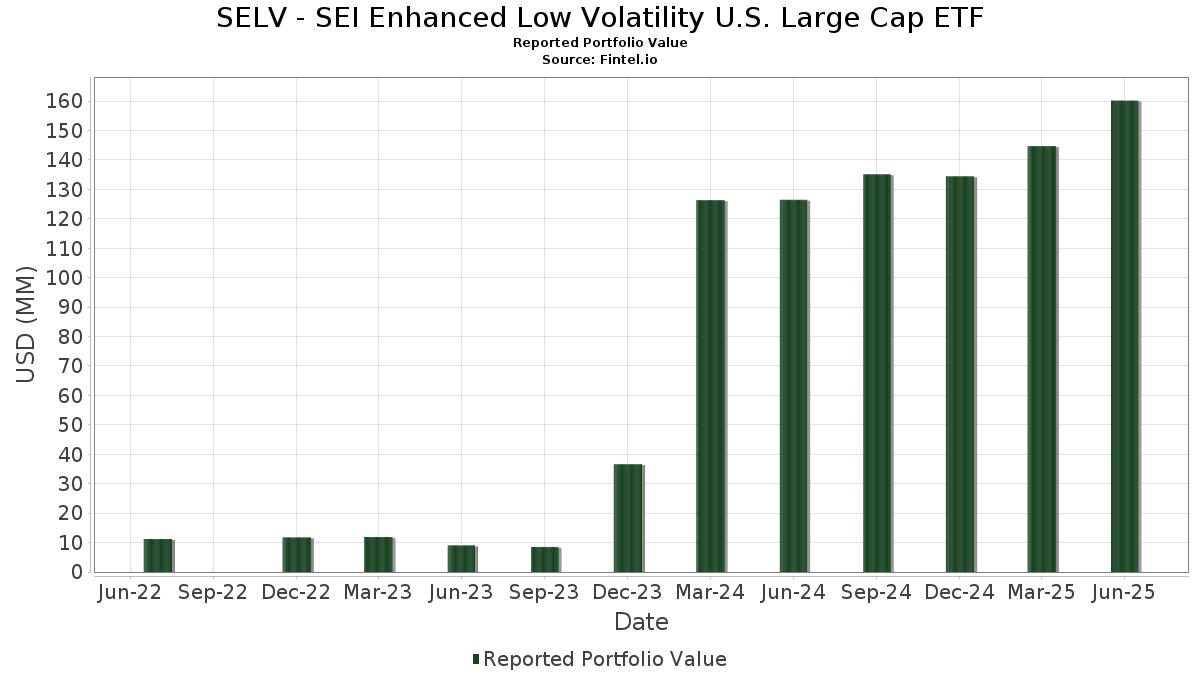
| Portföljvärde | $ 160 173 440 |
| Aktuella positioner | 80 |
Senaste innehav, resultat, förvaltat kapital (från 13F, 13D)
SELV - SEI Enhanced Low Volatility U.S. Large Cap ETF har redovisat 80 totala innehav i sina senaste SEC-arkiveringar. Det senaste portföljvärdet beräknas vara $ 160 173 440 USD. Faktiskt förvaltade tillgångar (AUM) är detta värde plus likvida medel (som inte redovisas). SELV - SEI Enhanced Low Volatility U.S. Large Cap ETFs största innehav är Microsoft Corporation (US:MSFT) , AT&T Inc. (US:T) , Apple Inc. (US:AAPL) , Walmart Inc. (US:WMT) , and Cardinal Health, Inc. (US:CAH) . SELV - SEI Enhanced Low Volatility U.S. Large Cap ETFs nya positioner inkluderar Cognizant Technology Solutions Corporation (US:CTSH) , International Business Machines Corporation (US:IBM) , Gartner, Inc. (US:IT) , .
Största ökningarna detta kvartal
Vi använder förändringen i portföljallokeringen eftersom det är det mest meningsfulla måttet. Förändringar kan bero på transaktioner eller förändringar i aktiekurser.
| Värdepapper | Aktier (MM) |
Värde (MM$) |
Portfölj % av | ΔPortfölj % av |
|---|---|---|---|---|
| 0,04 | 3,08 | 1,9094 | 1,9094 | |
| 0,02 | 3,46 | 2,1433 | 1,5423 | |
| 0,01 | 1,79 | 1,1114 | 1,0100 | |
| 0,00 | 0,97 | 0,6031 | 0,6031 | |
| 0,00 | 0,75 | 0,4656 | 0,4656 | |
| 0,03 | 4,63 | 2,8695 | 0,4561 | |
| 0,00 | 3,28 | 2,0350 | 0,3752 | |
| 0,05 | 3,13 | 1,9390 | 0,3148 | |
| 0,01 | 3,18 | 1,9740 | 0,2666 | |
| 0,06 | 4,28 | 2,6530 | 0,2336 |
Största minskningarna detta kvartal
Vi använder förändringen i portföljallokeringen eftersom det är det mest meningsfulla måttet. Förändringar kan bero på transaktioner eller förändringar i aktiepriser.
| Värdepapper | Aktier (MM) |
Värde (MM$) |
Portfölj % av | ΔPortfölj % av |
|---|---|---|---|---|
| 0,01 | 5,15 | 3,1932 | −1,7948 | |
| 0,02 | 4,89 | 3,0340 | −1,0055 | |
| 0,05 | 4,78 | 2,9626 | −0,3858 | |
| 0,02 | 2,79 | 1,7293 | −0,3401 | |
| 0,03 | 1,54 | 0,9517 | −0,3331 | |
| 0,03 | 4,08 | 2,5309 | −0,2873 | |
| 0,04 | 2,80 | 1,7376 | −0,2822 | |
| 0,00 | 0,00 | −0,2551 | ||
| 0,03 | 2,18 | 1,3506 | −0,2450 | |
| 0,03 | 2,96 | 1,8332 | −0,2372 |
13F- och fond arkiveringar
Denna blankett lämnades in den 2025-08-28 för rapporteringsperioden 2025-06-30. Klicka på länksymbolen för att se hela transaktionshistoriken.
Uppgradera för att låsa upp premiumdata och exportera till Excel![]() .
.
| Värdepapper | Typ | Genomsnittligt aktiepris | Aktier (MM) |
ΔAktier (%) |
ΔAktier (%) |
Värde ($MM) |
Portfölj (%) |
ΔPortfölj (%) |
|
|---|---|---|---|---|---|---|---|---|---|
| MSFT / Microsoft Corporation | 0,01 | −46,52 | 5,15 | −29,14 | 3,1932 | −1,7948 | |||
| T / AT&T Inc. | 0,17 | 4,50 | 5,03 | 6,95 | 3,1214 | −0,1095 | |||
| AAPL / Apple Inc. | 0,02 | −9,99 | 4,89 | −16,87 | 3,0340 | −1,0055 | |||
| WMT / Walmart Inc. | 0,05 | −12,06 | 4,78 | −2,07 | 2,9626 | −0,3858 | |||
| CAH / Cardinal Health, Inc. | 0,03 | 7,93 | 4,63 | 31,63 | 2,8695 | 0,4561 | |||
| RSG / Republic Services, Inc. | 0,02 | 3,20 | 4,42 | 5,09 | 2,7376 | −0,1459 | |||
| CSCO / Cisco Systems, Inc. | 0,06 | 7,97 | 4,28 | 21,39 | 2,6530 | 0,2336 | |||
| JNJ / Johnson & Johnson | 0,03 | 7,93 | 4,08 | −0,58 | 2,5309 | −0,2873 | |||
| MCK / McKesson Corporation | 0,01 | 7,77 | 3,87 | 17,34 | 2,3996 | 0,1360 | |||
| WRB / W. R. Berkley Corporation | 0,05 | 8,06 | 3,79 | 11,58 | 2,3482 | 0,0183 | |||
| GILD / Gilead Sciences, Inc. | 0,03 | 7,85 | 3,78 | 6,70 | 2,3415 | −0,0873 | |||
| PG / The Procter & Gamble Company | 0,02 | 8,05 | 3,72 | 1,01 | 2,3047 | −0,2210 | |||
| VZ / Verizon Communications Inc. | 0,08 | 8,00 | 3,62 | 3,02 | 2,2417 | −0,1670 | |||
| EA / Electronic Arts Inc. | 0,02 | 257,23 | 3,46 | 295,09 | 2,1433 | 1,5423 | |||
| VRSN / VeriSign, Inc. | 0,01 | 7,94 | 3,41 | 22,80 | 2,1140 | 0,2083 | |||
| ROP / Roper Technologies, Inc. | 0,01 | 8,06 | 3,41 | 3,90 | 2,1117 | −0,1384 | |||
| BKNG / Booking Holdings Inc. | 0,00 | 8,00 | 3,28 | 35,73 | 2,0350 | 0,3752 | |||
| VRSK / Verisk Analytics, Inc. | 0,01 | 8,01 | 3,24 | 13,06 | 2,0071 | 0,0418 | |||
| MSI / Motorola Solutions, Inc. | 0,01 | 33,26 | 3,18 | 27,97 | 1,9740 | 0,2666 | |||
| MO / Altria Group, Inc. | 0,05 | 35,28 | 3,13 | 32,16 | 1,9390 | 0,3148 | |||
| CTSH / Cognizant Technology Solutions Corporation | 0,04 | 3,08 | 1,9094 | 1,9094 | |||||
| ED / Consolidated Edison, Inc. | 0,03 | 8,01 | 2,96 | −1,99 | 1,8332 | −0,2372 | |||
| DUK / Duke Energy Corporation | 0,02 | 7,92 | 2,94 | 4,40 | 1,8230 | −0,1098 | |||
| WM / Waste Management, Inc. | 0,01 | 7,98 | 2,88 | 6,70 | 1,7879 | −0,0666 | |||
| MRK / Merck & Co., Inc. | 0,04 | 7,98 | 2,80 | −4,79 | 1,7376 | −0,2822 | |||
| CVX / Chevron Corporation | 0,02 | 8,07 | 2,79 | −7,50 | 1,7293 | −0,3401 | |||
| CL / Colgate-Palmolive Company | 0,03 | 8,11 | 2,67 | 4,88 | 1,6538 | −0,0917 | |||
| BRK.B / Berkshire Hathaway Inc. | 0,01 | 8,04 | 2,49 | −1,46 | 1,5452 | −0,1905 | |||
| FFIV / F5, Inc. | 0,01 | 8,02 | 2,44 | 19,40 | 1,5110 | 0,1102 | |||
| CB / Chubb Limited | 0,01 | 8,04 | 2,42 | 3,64 | 1,5007 | −0,1020 | |||
| GOOGL / Alphabet Inc. | 0,01 | 7,84 | 2,39 | 22,91 | 1,4800 | 0,1469 | |||
| GOOG / Alphabet Inc. | 0,01 | 7,83 | 2,36 | 22,41 | 1,4635 | 0,1403 | |||
| EXPD / Expeditors International of Washington, Inc. | 0,02 | 7,93 | 2,34 | 2,54 | 1,4499 | −0,1152 | |||
| MKL / Markel Group Inc. | 0,00 | 7,88 | 2,22 | 15,30 | 1,3733 | 0,0543 | |||
| OMC / Omnicom Group Inc. | 0,03 | 7,99 | 2,18 | −6,28 | 1,3506 | −0,2450 | |||
| COR / Cencora, Inc. | 0,01 | 7,92 | 2,07 | 16,36 | 1,2838 | 0,0626 | |||
| CMCSA / Comcast Corporation | 0,06 | 7,85 | 2,05 | 4,33 | 1,2711 | −0,0778 | |||
| ACN / Accenture plc | 0,01 | 7,94 | 1,95 | 3,40 | 1,2087 | −0,0854 | |||
| MCD / McDonald's Corporation | 0,01 | 7,91 | 1,89 | 0,96 | 1,1712 | −0,1133 | |||
| DOX / Amdocs Limited | 0,02 | 8,02 | 1,83 | 7,71 | 1,1348 | −0,0314 | |||
| PM / Philip Morris International Inc. | 0,01 | 957,25 | 1,79 | 1 119,05 | 1,1114 | 1,0100 | |||
| FOXA / Fox Corporation | 0,03 | 7,95 | 1,76 | 6,88 | 1,0886 | −0,0388 | |||
| DGX / Quest Diagnostics Incorporated | 0,01 | 7,96 | 1,65 | 14,62 | 1,0254 | 0,0351 | |||
| BMY / Bristol-Myers Squibb Company | 0,03 | 8,03 | 1,54 | −18,00 | 0,9517 | −0,3331 | |||
| TRV / The Travelers Companies, Inc. | 0,01 | 7,99 | 1,47 | 9,31 | 0,9103 | −0,0121 | |||
| KMI / Kinder Morgan, Inc. | 0,05 | 8,14 | 1,45 | 11,38 | 0,8983 | 0,0059 | |||
| V / Visa Inc. | 0,00 | 7,92 | 1,42 | 9,33 | 0,8792 | −0,0110 | |||
| GIS / General Mills, Inc. | 0,03 | 8,10 | 1,42 | −6,28 | 0,8791 | −0,1597 | |||
| HRB / H&R Block, Inc. | 0,02 | 7,92 | 1,37 | 7,82 | 0,8468 | −0,0221 | |||
| ARW / Arrow Electronics, Inc. | 0,01 | 7,98 | 1,31 | 32,59 | 0,8147 | 0,1342 | |||
| NFG / National Fuel Gas Company | 0,01 | 8,25 | 1,16 | 15,85 | 0,7206 | 0,0318 | |||
| ATO / Atmos Energy Corporation | 0,01 | 8,00 | 1,06 | 7,65 | 0,6552 | −0,0184 | |||
| ALL / The Allstate Corporation | 0,01 | 8,09 | 1,04 | 5,06 | 0,6437 | −0,0344 | |||
| TMUS / T-Mobile US, Inc. | 0,00 | 8,01 | 1,04 | −3,53 | 0,6434 | −0,0947 | |||
| IBM / International Business Machines Corporation | 0,00 | 0,97 | 0,6031 | 0,6031 | |||||
| DBX / Dropbox, Inc. | 0,03 | 7,95 | 0,96 | 15,56 | 0,5942 | 0,0251 | |||
| FOX / Fox Corporation | 0,02 | 7,91 | 0,96 | 5,74 | 0,5940 | −0,0281 | |||
| IT / Gartner, Inc. | 0,00 | 0,75 | 0,4656 | 0,4656 | |||||
| SLGN / Silgan Holdings Inc. | 0,01 | 7,99 | 0,75 | 14,57 | 0,4633 | 0,0152 | |||
| AVT / Avnet, Inc. | 0,01 | 8,00 | 0,74 | 19,16 | 0,4590 | 0,0328 | |||
| DLB / Dolby Laboratories, Inc. | 0,01 | 8,06 | 0,74 | −0,14 | 0,4585 | −0,0494 | |||
| PFE / Pfizer Inc. | 0,03 | 7,98 | 0,72 | 3,32 | 0,4438 | −0,0318 | |||
| RS / Reliance, Inc. | 0,00 | 11,35 | 0,63 | 21,11 | 0,3914 | 0,0335 | |||
| NEU / NewMarket Corporation | 0,00 | 8,02 | 0,62 | 31,99 | 0,3863 | 0,0617 | |||
| DTE / DTE Energy Company | 0,00 | 8,03 | 0,53 | 3,52 | 0,3282 | −0,0228 | |||
| WTM / White Mountains Insurance Group, Ltd. | 0,00 | 7,95 | 0,46 | 0,65 | 0,2872 | −0,0286 | |||
| MDLZ / Mondelez International, Inc. | 0,01 | 7,97 | 0,43 | 7,52 | 0,2661 | −0,0084 | |||
| SNA / Snap-on Incorporated | 0,00 | 7,89 | 0,43 | −0,23 | 0,2637 | −0,0293 | |||
| LMT / Lockheed Martin Corporation | 0,00 | 3,06 | 0,41 | 6,84 | 0,2518 | −0,0091 | |||
| MMM / 3M Company | 0,00 | 8,18 | 0,40 | 12,18 | 0,2459 | 0,0032 | |||
| L / Loews Corporation | 0,00 | 2,45 | 0,39 | 2,11 | 0,2403 | −0,0201 | |||
| MMC / Marsh & McLennan Companies, Inc. | 0,00 | 8,25 | 0,34 | −2,82 | 0,2134 | −0,0301 | |||
| G / Genpact Limited | 0,01 | 8,09 | 0,33 | −5,67 | 0,2068 | −0,0356 | |||
| YUM / Yum! Brands, Inc. | 0,00 | 2,34 | 0,32 | −3,57 | 0,2013 | −0,0299 | |||
| CHE / Chemed Corporation | 0,00 | 8,21 | 0,29 | −14,54 | 0,1790 | −0,0524 | |||
| NI / NiSource Inc. | 0,00 | 2,53 | 0,17 | 3,13 | 0,1025 | −0,0075 | |||
| FE / FirstEnergy Corp. | 0,00 | 2,47 | 0,16 | 1,88 | 0,1016 | −0,0086 | |||
| AMZN / Amazon.com, Inc. | 0,00 | 14,66 | 0,14 | 32,11 | 0,0894 | 0,0145 | |||
| SCI / Service Corporation International | 0,00 | 13,02 | 0,10 | 13,95 | 0,0613 | 0,0021 | |||
| CMS / CMS Energy Corporation | 0,00 | 2,96 | 0,09 | −5,32 | 0,0554 | −0,0092 | |||
| META / Meta Platforms, Inc. | 0,00 | −100,00 | 0,00 | −100,00 | −0,2551 |