Grundläggande statistik
| Portföljvärde | $ 358 834 |
| Aktuella positioner | 91 |
Senaste innehav, resultat, förvaltat kapital (från 13F, 13D)
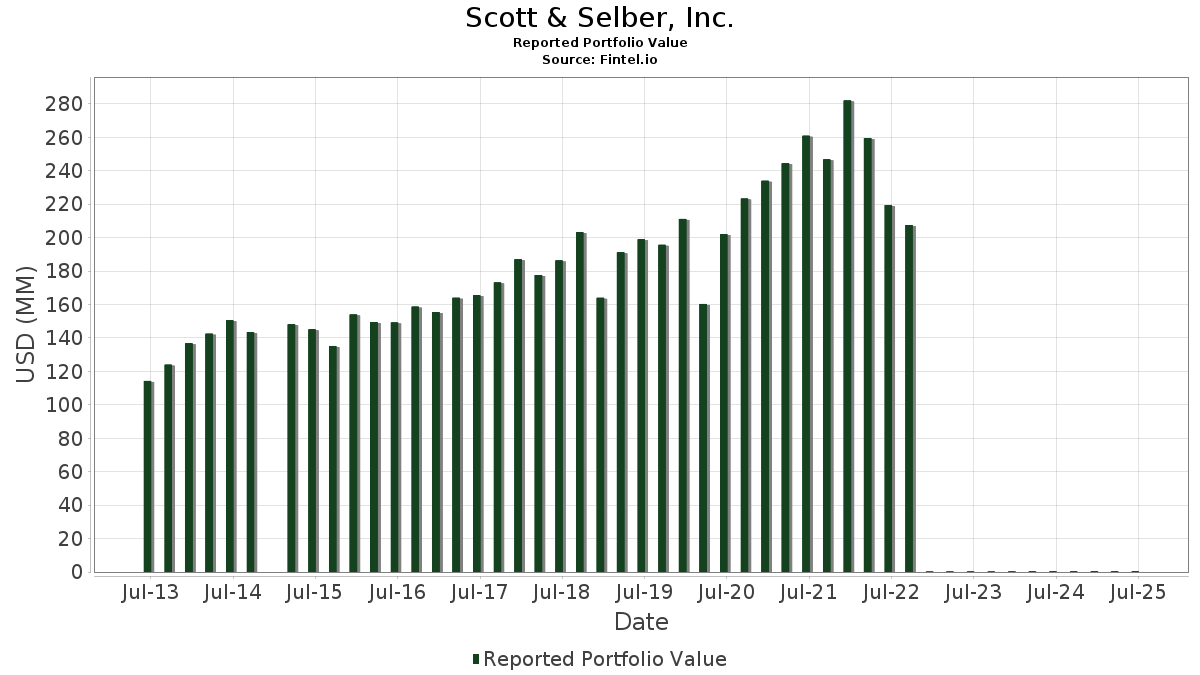
Scott & Selber, Inc. har redovisat 91 totala innehav i sina senaste SEC-arkiveringar. Det senaste portföljvärdet beräknas vara $ 358 834 USD. Faktiskt förvaltade tillgångar (AUM) är detta värde plus likvida medel (som inte redovisas). Scott & Selber, Inc.s största innehav är NVIDIA Corporation (US:NVDA) , Microsoft Corporation (US:MSFT) , Apple Inc. (US:AAPL) , Broadcom Inc. (US:AVGO) , and Amazon.com, Inc. (US:AMZN) . Scott & Selber, Inc.s nya positioner inkluderar Pinterest, Inc. (US:PINS) , Maplebear Inc. (US:CART) , Airbnb, Inc. (US:ABNB) , Devon Energy Corporation (US:DVN) , and Hilton Worldwide Holdings Inc. (US:HLT) .
Största ökningarna detta kvartal
Vi använder förändringen i portföljallokeringen eftersom det är det mest meningsfulla måttet. Förändringar kan bero på transaktioner eller förändringar i aktiekurser.
| Värdepapper | Aktier (MM) |
Värde (MM$) |
Portfölj % av | ΔPortfölj % av |
|---|---|---|---|---|
| 0,18 | 0,03 | 7,9895 | 1,2795 | |
| 0,07 | 0,02 | 5,3033 | 1,2241 | |
| 0,05 | 0,02 | 6,6256 | 0,9091 | |
| 0,05 | 0,01 | 1,5771 | 0,8141 | |
| 0,07 | 0,00 | 0,6995 | 0,6995 | |
| 0,05 | 0,00 | 0,6920 | 0,6920 | |
| 0,02 | 0,00 | 0,6883 | 0,6883 | |
| 0,08 | 0,00 | 0,6842 | 0,6842 | |
| 0,01 | 0,00 | 0,5306 | 0,5306 | |
| 0,02 | 0,00 | 0,8996 | 0,4645 |
Största minskningarna detta kvartal
Vi använder förändringen i portföljallokeringen eftersom det är det mest meningsfulla måttet. Förändringar kan bero på transaktioner eller förändringar i aktiepriser.
| Värdepapper | Aktier (MM) |
Värde (MM$) |
Portfölj % av | ΔPortfölj % av |
|---|---|---|---|---|
| 0,11 | 0,02 | 6,5454 | −1,5679 | |
| 0,01 | 0,00 | 0,4453 | −0,9109 | |
| 0,00 | 0,00 | 0,8865 | −0,6907 | |
| 0,00 | 0,00 | 0,0719 | −0,4871 | |
| 0,01 | 0,01 | 1,5868 | −0,3985 | |
| 0,04 | 0,00 | 1,3357 | −0,3477 | |
| 0,01 | 0,00 | 0,7017 | −0,2815 | |
| 0,12 | 0,00 | 0,6568 | −0,2665 | |
| 0,02 | 0,00 | 0,9361 | −0,2645 | |
| 0,04 | 0,00 | 0,5674 | −0,2449 |
13F- och fond arkiveringar
Denna blankett lämnades in den 2025-07-17 för rapporteringsperioden 2025-06-30. Klicka på länksymbolen för att se hela transaktionshistoriken.
Uppgradera för att låsa upp premiumdata och exportera till Excel![]() .
.
| Värdepapper | Typ | Genomsnittligt aktiepris | Aktier (MM) |
ΔAktier (%) |
ΔAktier (%) |
Värde ($MM) |
Portfölj (%) |
ΔPortfölj (%) |
|
|---|---|---|---|---|---|---|---|---|---|
| NVDA / NVIDIA Corporation | 0,18 | −6,16 | 0,03 | 40,00 | 7,9895 | 1,2795 | |||
| MSFT / Microsoft Corporation | 0,05 | 0,49 | 0,02 | 35,29 | 6,6256 | 0,9091 | |||
| AAPL / Apple Inc. | 0,11 | 0,35 | 0,02 | −8,00 | 6,5454 | −1,5679 | |||
| AVGO / Broadcom Inc. | 0,07 | −9,28 | 0,02 | 58,33 | 5,3033 | 1,2241 | |||
| AMZN / Amazon.com, Inc. | 0,06 | 0,74 | 0,01 | 18,18 | 3,7377 | 0,0414 | |||
| GOOG / Alphabet Inc. | 0,07 | 0,61 | 0,01 | 9,09 | 3,6136 | −0,0205 | |||
| META / Meta Platforms, Inc. | 0,01 | 1,08 | 0,01 | 28,57 | 2,5875 | 0,2913 | |||
| KMI / Kinder Morgan, Inc. | 0,27 | 0,85 | 0,01 | 0,00 | 2,1938 | −0,2315 | |||
| JPM / JPMorgan Chase & Co. | 0,03 | 0,08 | 0,01 | 16,67 | 2,0909 | 0,0601 | |||
| VUG / Vanguard Index Funds - Vanguard Growth ETF | 0,02 | −0,09 | 0,01 | 16,67 | 2,0764 | 0,0568 | |||
| C / Citigroup Inc. | 0,08 | 1,08 | 0,01 | 20,00 | 1,9332 | 0,1009 | |||
| WMB / The Williams Companies, Inc. | 0,10 | 0,69 | 0,01 | 0,00 | 1,7877 | −0,1531 | |||
| BRK.A / Berkshire Hathaway Inc. | 0,01 | 0,68 | 0,01 | −16,67 | 1,5868 | −0,3985 | |||
| HD / The Home Depot, Inc. | 0,02 | 0,58 | 0,01 | 0,00 | 1,5860 | −0,2249 | |||
| MU / Micron Technology, Inc. | 0,05 | 67,44 | 0,01 | 150,00 | 1,5771 | 0,8141 | |||
| CCL / Carnival Corporation & plc | 0,19 | 1,41 | 0,01 | 66,67 | 1,4845 | 0,3162 | |||
| VXUS / Vanguard STAR Funds - Vanguard Total International Stock ETF | 0,08 | 0,00 | 0,01 | 25,00 | 1,4544 | −0,0475 | |||
| RTX / RTX Corporation | 0,04 | 0,30 | 0,01 | 25,00 | 1,4249 | −0,0555 | |||
| BAC / Bank of America Corporation | 0,11 | 0,48 | 0,01 | 25,00 | 1,4140 | −0,0117 | |||
| VIG / Vanguard Specialized Funds - Vanguard Dividend Appreciation ETF | 0,02 | 0,00 | 0,00 | 0,00 | 1,3625 | −0,1212 | |||
| HON / Honeywell International Inc. | 0,02 | 0,18 | 0,00 | 0,00 | 1,3466 | −0,0577 | |||
| CSCO / Cisco Systems, Inc. | 0,07 | 0,83 | 0,00 | 0,00 | 1,3402 | −0,0180 | |||
| XOM / Exxon Mobil Corporation | 0,04 | 0,57 | 0,00 | −20,00 | 1,3357 | −0,3477 | |||
| GS / The Goldman Sachs Group, Inc. | 0,01 | 0,57 | 0,00 | 33,33 | 1,3257 | 0,1568 | |||
| Lam Research / COMM (512807108) | 0,05 | 0,00 | 0,0000 | ||||||
| AMAT / Applied Materials, Inc. | 0,02 | 1,53 | 0,00 | 33,33 | 1,1627 | 0,1199 | |||
| ORCL / Oracle Corporation | 0,02 | 0,46 | 0,00 | 100,00 | 1,1328 | 0,3042 | |||
| TSLA / Tesla, Inc. | 0,01 | 0,24 | 0,00 | 0,00 | 1,0551 | 0,0687 | |||
| V / Visa Inc. | 0,01 | 0,52 | 0,00 | 0,00 | 1,0495 | −0,1345 | |||
| ISRG / Intuitive Surgical, Inc. | 0,01 | 0,59 | 0,00 | 0,00 | 1,0281 | −0,0419 | |||
| WM / Waste Management, Inc. | 0,02 | 0,54 | 0,00 | 0,00 | 1,0230 | −0,1597 | |||
| ABBV / AbbVie Inc. | 0,02 | 1,11 | 0,00 | 0,00 | 0,9361 | −0,2645 | |||
| INTU / Intuit Inc. | 0,00 | 0,66 | 0,00 | 50,00 | 0,9308 | 0,1028 | |||
| GNRC / Generac Holdings Inc. | 0,02 | 110,00 | 0,00 | 200,00 | 0,8996 | 0,4645 | |||
| AZO / AutoZone, Inc. | 0,00 | −33,67 | 0,00 | −25,00 | 0,8865 | −0,6907 | |||
| ADBE / Adobe Inc. | 0,01 | 134,39 | 0,00 | 200,00 | 0,8831 | 0,4541 | |||
| MA / Mastercard Incorporated | 0,01 | 0,61 | 0,00 | 0,00 | 0,8266 | −0,0942 | |||
| SCHW / The Charles Schwab Corporation | 0,03 | 0,91 | 0,00 | 0,00 | 0,8241 | 0,0192 | |||
| VO / Vanguard Index Funds - Vanguard Mid-Cap ETF | 0,01 | 0,00 | 0,00 | 0,00 | 0,8093 | −0,0500 | |||
| VB / Vanguard Index Funds - Vanguard Small-Cap ETF | 0,01 | 0,00 | 0,00 | 0,00 | 0,7563 | −0,0566 | |||
| SCHD / Schwab Strategic Trust - Schwab U.S. Dividend Equity ETF | 0,10 | −1,14 | 0,00 | 0,00 | 0,7179 | −0,1626 | |||
| TMO / Thermo Fisher Scientific Inc. | 0,01 | 0,60 | 0,00 | −33,33 | 0,7017 | −0,2815 | |||
| PINS / Pinterest, Inc. | 0,07 | 0,00 | 0,6995 | 0,6995 | |||||
| CART / Maplebear Inc. | 0,05 | 0,00 | 0,6920 | 0,6920 | |||||
| PG / The Procter & Gamble Company | 0,02 | −1,25 | 0,00 | 0,00 | 0,6900 | −0,1687 | |||
| ABNB / Airbnb, Inc. | 0,02 | 0,00 | 0,6883 | 0,6883 | |||||
| DVN / Devon Energy Corporation | 0,08 | 0,00 | 0,6842 | 0,6842 | |||||
| WFC / Wells Fargo & Company | 0,03 | 0,56 | 0,00 | 0,00 | 0,6791 | −0,0159 | |||
| C.WSA / Citigroup, Inc. | 0,00 | 0,57 | 0,00 | 0,00 | 0,6752 | −0,0205 | |||
| SMG / The Scotts Miracle-Gro Company | 0,04 | 58,94 | 0,00 | 100,00 | 0,6747 | 0,2687 | |||
| COST / Costco Wholesale Corporation | 0,00 | 0,54 | 0,00 | 0,00 | 0,6722 | −0,0616 | |||
| JNJ / Johnson & Johnson | 0,02 | 0,60 | 0,00 | 0,00 | 0,6660 | −0,1597 | |||
| HAL / Halliburton Company | 0,12 | 1,76 | 0,00 | 0,00 | 0,6568 | −0,2665 | |||
| SBUX / Starbucks Corporation | 0,02 | 0,87 | 0,00 | 0,00 | 0,6351 | −0,1390 | |||
| KVUE / Kenvue Inc. | 0,11 | 0,89 | 0,00 | 0,00 | 0,6273 | −0,1914 | |||
| VNQ / Vanguard Specialized Funds - Vanguard Real Estate ETF | 0,02 | 0,00 | 0,00 | 0,00 | 0,6181 | −0,1039 | |||
| UNP / Union Pacific Corporation | 0,01 | 0,61 | 0,00 | 0,00 | 0,6050 | −0,1045 | |||
| COP / ConocoPhillips | 0,02 | 0,54 | 0,00 | 0,00 | 0,5891 | −0,1988 | |||
| ABT / Abbott Laboratories | 0,02 | 0,68 | 0,00 | 0,00 | 0,5794 | −0,0654 | |||
| TAP / Molson Coors Beverage Company | 0,04 | 1,58 | 0,00 | 0,00 | 0,5674 | −0,2449 | |||
| CMG / Chipotle Mexican Grill, Inc. | 0,04 | 0,73 | 0,00 | 100,00 | 0,5588 | −0,0111 | |||
| CVX / Chevron Corporation | 0,01 | 0,58 | 0,00 | −50,00 | 0,5317 | −0,1778 | |||
| ADI / Analog Devices, Inc. | 0,01 | 0,00 | 0,5306 | 0,5306 | |||||
| VV / Vanguard Index Funds - Vanguard Large-Cap ETF | 0,01 | 0,00 | 0,00 | 0,00 | 0,5217 | −0,0184 | |||
| ZTS / Zoetis Inc. | 0,01 | 0,58 | 0,00 | 0,00 | 0,5064 | −0,1042 | |||
| KO / The Coca-Cola Company | 0,02 | 0,99 | 0,00 | 0,00 | 0,4913 | −0,0744 | |||
| LLY / Eli Lilly and Company | 0,00 | 0,85 | 0,00 | 0,00 | 0,4646 | −0,0960 | |||
| UNH / UnitedHealth Group Incorporated | 0,01 | −36,65 | 0,00 | −75,00 | 0,4453 | −0,9109 | |||
| CRM / Salesforce, Inc. | 0,01 | 0,67 | 0,00 | 0,00 | 0,4445 | −0,0546 | |||
| AMD / Advanced Micro Devices, Inc. | 0,01 | 0,70 | 0,00 | 0,00 | 0,4138 | 0,0719 | |||
| MRK / Merck & Co., Inc. | 0,02 | 0,91 | 0,00 | 0,00 | 0,3447 | −0,1003 | |||
| GILD / Gilead Sciences, Inc. | 0,01 | 0,82 | 0,00 | 0,00 | 0,3419 | −0,0519 | |||
| AMGN / Amgen Inc. | 0,00 | 0,78 | 0,00 | 0,00 | 0,2823 | −0,0769 | |||
| QQQ / Invesco QQQ Trust, Series 1 | 0,00 | −4,98 | 0,00 | 0,2319 | −0,0063 | ||||
| YUM / Yum! Brands, Inc. | 0,00 | 0,00 | 0,00 | 0,1653 | −0,0361 | ||||
| SCHB / Schwab Strategic Trust - Schwab U.S. Broad Market ETF | 0,02 | 0,06 | 0,00 | 0,1647 | −0,0059 | ||||
| DGRO / iShares Trust - iShares Core Dividend Growth ETF | 0,01 | 0,02 | 0,00 | 0,1466 | −0,0164 | ||||
| VYM / Vanguard Whitehall Funds - Vanguard High Dividend Yield ETF | 0,00 | −2,19 | 0,00 | 0,1424 | −0,0193 | ||||
| JLL / Jones Lang LaSalle Incorporated | 0,00 | 0,00 | 0,00 | 0,1120 | −0,0125 | ||||
| BND / Vanguard Bond Index Funds - Vanguard Total Bond Market ETF | 0,00 | 6,40 | 0,00 | 0,1023 | −0,0079 | ||||
| TPST / Tempest Therapeutics, Inc. | 0,00 | 0,00 | 0,00 | 0,0931 | 0,0230 | ||||
| IGM / iShares Trust - iShares Expanded Tech Sector ETF | 0,00 | 0,00 | 0,00 | 0,0828 | 0,0059 | ||||
| WMT / Walmart Inc. | 0,00 | 1,88 | 0,00 | 0,0811 | −0,0009 | ||||
| PEP / PepsiCo, Inc. | 0,00 | −83,26 | 0,00 | −100,00 | 0,0719 | −0,4871 | |||
| VOO / Vanguard Index Funds - Vanguard S&P 500 ETF | 0,00 | 0,00 | 0,00 | 0,0686 | −0,0028 | ||||
| MCD / McDonald's Corporation | 0,00 | 0,00 | 0,00 | 0,0649 | −0,0151 | ||||
| ADP / Automatic Data Processing, Inc. | 0,00 | 0,00 | 0,00 | 0,0627 | −0,0087 | ||||
| CAT / Caterpillar Inc. | 0,00 | 0,00 | 0,0596 | 0,0596 | |||||
| HLT / Hilton Worldwide Holdings Inc. | 0,00 | 0,00 | 0,0569 | 0,0569 | |||||
| USMV / iShares Trust - iShares MSCI USA Min Vol Factor ETF | 0,00 | 0,05 | 0,00 | 0,0566 | −0,0081 | ||||
| SLI / Standard Lithium Ltd. | 0,01 | 0,00 | 0,0059 | 0,0059 | |||||
| DSX / Diana Shipping Inc. | 0,00 | −100,00 | 0,00 | 0,0000 | |||||
| ULTA / Ulta Beauty, Inc. | 0,00 | −100,00 | 0,00 | 0,0000 | |||||
| TXN / Texas Instruments Incorporated | 0,00 | −100,00 | 0,00 | 0,0000 | |||||
| YUMC / Yum China Holdings, Inc. | 0,00 | −100,00 | 0,00 | 0,0000 | |||||
| MMM / 3M Company | 0,00 | −100,00 | 0,00 | 0,0000 |