Grundläggande statistik
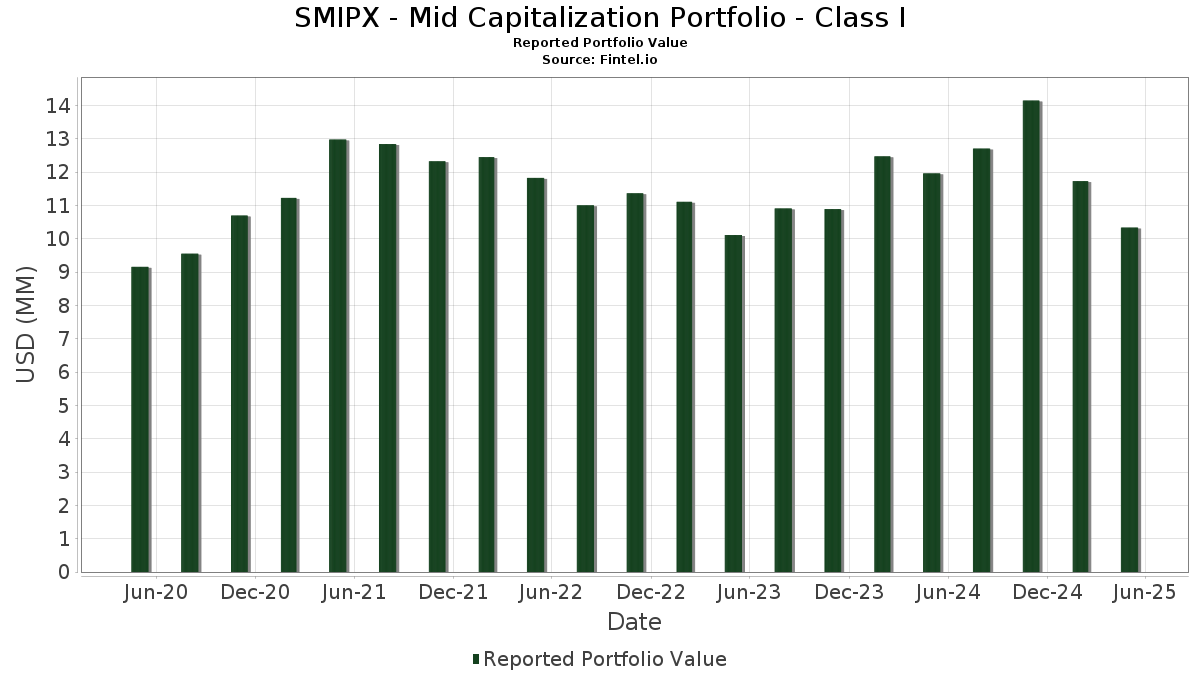
| Portföljvärde | $ 10 334 562 |
| Aktuella positioner | 60 |
Senaste innehav, resultat, förvaltat kapital (från 13F, 13D)
SMIPX - Mid Capitalization Portfolio - Class I har redovisat 60 totala innehav i sina senaste SEC-arkiveringar. Det senaste portföljvärdet beräknas vara $ 10 334 562 USD. Faktiskt förvaltade tillgångar (AUM) är detta värde plus likvida medel (som inte redovisas). SMIPX - Mid Capitalization Portfolio - Class Is största innehav är Tradeweb Markets Inc. (US:TW) , Hubbell Incorporated (US:HUBB) , Axon Enterprise, Inc. (US:AXON) , Westinghouse Air Brake Technologies Corporation (US:WAB) , and Burlington Stores, Inc. (US:BURL) . SMIPX - Mid Capitalization Portfolio - Class Is nya positioner inkluderar Burlington Stores, Inc. (US:BURL) , BJ's Wholesale Club Holdings, Inc. (US:BJ) , Coherent Corp. (US:COHR) , Parker-Hannifin Corporation (US:PH) , and Dreyfus Institutional Reserves Funds - Dreyfus Institutional Preferred Gov Money Market Fund Institutional (US:DSVXX) .
Största ökningarna detta kvartal
Vi använder förändringen i portföljallokeringen eftersom det är det mest meningsfulla måttet. Förändringar kan bero på transaktioner eller förändringar i aktiekurser.
| Värdepapper | Aktier (MM) |
Värde (MM$) |
Portfölj % av | ΔPortfölj % av |
|---|---|---|---|---|
| 0,00 | 0,31 | 2,9928 | 2,9928 | |
| 0,00 | 0,23 | 2,2346 | 2,2346 | |
| 0,00 | 0,32 | 3,0704 | 2,0660 | |
| 0,00 | 0,20 | 1,9032 | 1,9032 | |
| 0,00 | 0,33 | 3,1712 | 1,8860 | |
| 0,00 | 0,33 | 3,1806 | 1,6586 | |
| 0,00 | 0,16 | 1,5003 | 1,5003 | |
| 0,00 | 0,22 | 2,1579 | 1,3714 | |
| 0,00 | 0,21 | 2,0512 | 1,2072 | |
| 0,01 | 0,12 | 1,1869 | 1,1869 |
Största minskningarna detta kvartal
Vi använder förändringen i portföljallokeringen eftersom det är det mest meningsfulla måttet. Förändringar kan bero på transaktioner eller förändringar i aktiepriser.
| Värdepapper | Aktier (MM) |
Värde (MM$) |
Portfölj % av | ΔPortfölj % av |
|---|---|---|---|---|
| 0,00 | 0,18 | 1,7262 | −2,7673 | |
| 0,13 | 1,2143 | −2,7231 | ||
| 0,00 | 0,21 | 1,9695 | −2,0364 | |
| 0,01 | 0,13 | 1,2933 | −2,0046 | |
| 0,00 | 0,16 | 1,4951 | −1,5487 | |
| 0,00 | 0,00 | −1,1140 | ||
| 0,00 | 0,10 | 0,9554 | −0,9989 | |
| 0,00 | 0,26 | 2,5099 | −0,8283 | |
| 0,00 | 0,11 | 1,0158 | −0,7691 | |
| 0,00 | 0,10 | 0,9188 | −0,7492 |
13F- och fond arkiveringar
Denna blankett lämnades in den 2025-07-29 för rapporteringsperioden 2025-05-31. Klicka på länksymbolen för att se hela transaktionshistoriken.
Uppgradera för att låsa upp premiumdata och exportera till Excel![]() .
.
| Värdepapper | Typ | Genomsnittligt aktiepris | Aktier (MM) |
ΔAktier (%) |
ΔAktier (%) |
Värde ($MM) |
Portfölj (%) |
ΔPortfölj (%) |
|
|---|---|---|---|---|---|---|---|---|---|
| TW / Tradeweb Markets Inc. | 0,00 | −4,15 | 0,40 | 2,30 | 3,8432 | 0,5049 | |||
| HUBB / Hubbell Incorporated | 0,00 | 77,08 | 0,33 | 85,96 | 3,1806 | 1,6586 | |||
| AXON / Axon Enterprise, Inc. | 0,00 | 54,39 | 0,33 | 120,00 | 3,1712 | 1,8860 | |||
| WAB / Westinghouse Air Brake Technologies Corporation | 0,00 | 148,82 | 0,32 | 172,65 | 3,0704 | 2,0660 | |||
| BURL / Burlington Stores, Inc. | 0,00 | 0,31 | 2,9928 | 2,9928 | |||||
| VMC / Vulcan Materials Company | 0,00 | −17,27 | 0,30 | −11,37 | 2,9279 | −0,0054 | |||
| PFGC / Performance Food Group Company | 0,00 | 3,19 | 0,28 | 8,70 | 2,6452 | 0,4802 | |||
| RGA / Reinsurance Group of America, Incorporated | 0,00 | −27,57 | 0,27 | −27,27 | 2,6165 | −0,5832 | |||
| AZO / AutoZone, Inc. | 0,00 | −37,50 | 0,26 | −33,25 | 2,5099 | −0,8283 | |||
| BJ / BJ's Wholesale Club Holdings, Inc. | 0,00 | 0,23 | 2,2346 | 2,2346 | |||||
| GEV / GE Vernova Inc. | 0,00 | 72,73 | 0,22 | 143,48 | 2,1579 | 1,3714 | |||
| TYL / Tyler Technologies, Inc. | 0,00 | −11,76 | 0,22 | −16,28 | 2,0782 | −0,1282 | |||
| WEC / WEC Energy Group, Inc. | 0,00 | −10,16 | 0,21 | −9,75 | 2,0536 | 0,0371 | |||
| VST / Vistra Corp. | 0,00 | 79,73 | 0,21 | 117,35 | 2,0512 | 1,2072 | |||
| ERJ / Embraer S.A. - Depositary Receipt (Common Stock) | 0,00 | 6,79 | 0,21 | 3,52 | 1,9790 | 0,2733 | |||
| LNT / Alliant Energy Corporation | 0,00 | −54,71 | 0,21 | −56,29 | 1,9695 | −2,0364 | |||
| CMS / CMS Energy Corporation | 0,00 | −10,09 | 0,20 | −13,62 | 1,9528 | −0,0543 | |||
| EVRG / Evergy, Inc. | 0,00 | −10,16 | 0,20 | −13,30 | 1,9455 | −0,0508 | |||
| COHR / Coherent Corp. | 0,00 | 0,20 | 1,9032 | 1,9032 | |||||
| SSNC / SS&C Technologies Holdings, Inc. | 0,00 | −10,19 | 0,20 | −18,75 | 1,8822 | −0,1694 | |||
| ZION / Zions Bancorporation, National Association | 0,00 | 87,95 | 0,20 | 65,25 | 1,8810 | 0,8665 | |||
| FN / Fabrinet | 0,00 | 106,41 | 0,19 | 139,74 | 1,8005 | 1,1348 | |||
| CACI / CACI International Inc | 0,00 | 17,57 | 0,19 | 51,22 | 1,7883 | 0,7311 | |||
| WAL / Western Alliance Bancorporation | 0,00 | 88,89 | 0,18 | 57,26 | 1,7735 | 0,7722 | |||
| LECO / Lincoln Electric Holdings, Inc. | 0,00 | 0,00 | 0,18 | −6,67 | 1,7572 | 0,0905 | |||
| SYF / Synchrony Financial | 0,00 | −30,09 | 0,18 | −5,70 | 1,7498 | 0,1861 | |||
| EGP / EastGroup Properties, Inc. | 0,00 | −63,19 | 0,18 | −65,97 | 1,7262 | −2,7673 | |||
| DPZ / Domino's Pizza, Inc. | 0,00 | −32,73 | 0,18 | −34,94 | 1,6839 | −0,6144 | |||
| NDAQ / Nasdaq, Inc. | 0,00 | −10,41 | 0,17 | −9,47 | 1,6570 | 0,0288 | |||
| MRVL / Marvell Technology, Inc. | 0,00 | 138,40 | 0,17 | 57,41 | 1,6332 | 0,7048 | |||
| ROK / Rockwell Automation, Inc. | 0,00 | −26,43 | 0,16 | −19,40 | 1,5609 | −0,1543 | |||
| VRT / Vertiv Holdings Co | 0,00 | 126,56 | 0,16 | 160,00 | 1,5032 | 0,9834 | |||
| PH / Parker-Hannifin Corporation | 0,00 | 0,16 | 1,5003 | 1,5003 | |||||
| RSG / Republic Services, Inc. | 0,00 | −59,80 | 0,16 | −56,46 | 1,4951 | −1,5487 | |||
| CMA / Comerica Incorporated | 0,00 | 39,68 | 0,15 | 23,97 | 1,4476 | 0,4102 | |||
| FND / Floor & Decor Holdings, Inc. | 0,00 | 172,00 | 0,15 | 67,82 | 1,4047 | 0,6750 | |||
| HRI / Herc Holdings Inc. | 0,00 | 50,66 | 0,14 | 29,36 | 1,3637 | 0,4332 | |||
| CR / Crane Company | 0,00 | 0,62 | 0,14 | 5,34 | 1,3335 | 0,2139 | |||
| AME / AMETEK, Inc. | 0,00 | −10,59 | 0,14 | −15,62 | 1,3048 | −0,0682 | |||
| CWK / Cushman & Wakefield plc | 0,01 | −56,03 | 0,13 | −71,31 | 1,2933 | −2,0046 | |||
| DSVXX / Dreyfus Institutional Reserves Funds - Dreyfus Institutional Preferred Gov Money Market Fund Institutional | 0,13 | −72,67 | 1,2143 | −2,7231 | |||||
| OWL / Blue Owl Capital Inc. | 0,01 | 17,75 | 0,12 | 1,65 | 1,1905 | 0,1552 | |||
| AEO / American Eagle Outfitters, Inc. | 0,01 | 0,12 | 1,1869 | 1,1869 | |||||
| FLS / Flowserve Corporation | 0,00 | 6,86 | 0,11 | −3,45 | 1,0834 | 0,0901 | |||
| CDW / CDW Corporation | 0,00 | −37,44 | 0,11 | −36,42 | 1,0567 | −0,4258 | |||
| CIEN / Ciena Corporation | 0,00 | 0,11 | 1,0535 | 1,0535 | |||||
| FTI / TechnipFMC plc | 0,00 | −52,22 | 0,11 | −49,76 | 1,0158 | −0,7691 | |||
| EXR / Extra Space Storage Inc. | 0,00 | −39,11 | 0,10 | −39,77 | 0,9945 | −0,4700 | |||
| TOL / Toll Brothers, Inc. | 0,00 | 83,81 | 0,10 | 72,41 | 0,9663 | 0,4661 | |||
| RRC / Range Resources Corporation | 0,00 | −57,62 | 0,10 | −56,77 | 0,9554 | −0,9989 | |||
| ALLE / Allegion plc | 0,00 | −10,32 | 0,10 | 0,00 | 0,9526 | 0,1014 | |||
| MPWR / Monolithic Power Systems, Inc. | 0,00 | −38,30 | 0,10 | −28,57 | 0,9218 | −0,0198 | |||
| HLIO / Helios Technologies, Inc. | 0,00 | −36,33 | 0,10 | −51,28 | 0,9188 | −0,7492 | |||
| XPO / XPO, Inc. | 0,00 | −14,89 | 0,09 | −20,87 | 0,8747 | −0,1116 | |||
| A / Agilent Technologies, Inc. | 0,00 | −10,59 | 0,09 | −21,30 | 0,8170 | −0,1108 | |||
| ARES / Ares Management Corporation | 0,00 | −51,96 | 0,08 | −53,45 | 0,7789 | −0,7089 | |||
| TREX / Trex Company, Inc. | 0,00 | 0,08 | 0,7781 | 0,7781 | |||||
| DHI / D.R. Horton, Inc. | 0,00 | 21,28 | 0,07 | 13,56 | 0,6464 | 0,1378 | |||
| RCL / Royal Caribbean Cruises Ltd. | 0,00 | −10,20 | 0,06 | −6,67 | 0,5430 | 0,0285 | |||
| CCL / Carnival Corporation & plc | 0,00 | −10,18 | 0,05 | −12,07 | 0,4918 | −0,0095 | |||
| DKS / DICK'S Sporting Goods, Inc. | 0,00 | −100,00 | 0,00 | −100,00 | −1,1140 | ||||
| SITE / SiteOne Landscape Supply, Inc. | 0,00 | −100,00 | 0,00 | −100,00 | −0,4473 | ||||
| DREYFUS TREASURY OBLIGATIONS #0521 / STIV (N/A) | 0,00 | 0,00 | 0,0000 | 0,0000 |