Grundläggande statistik
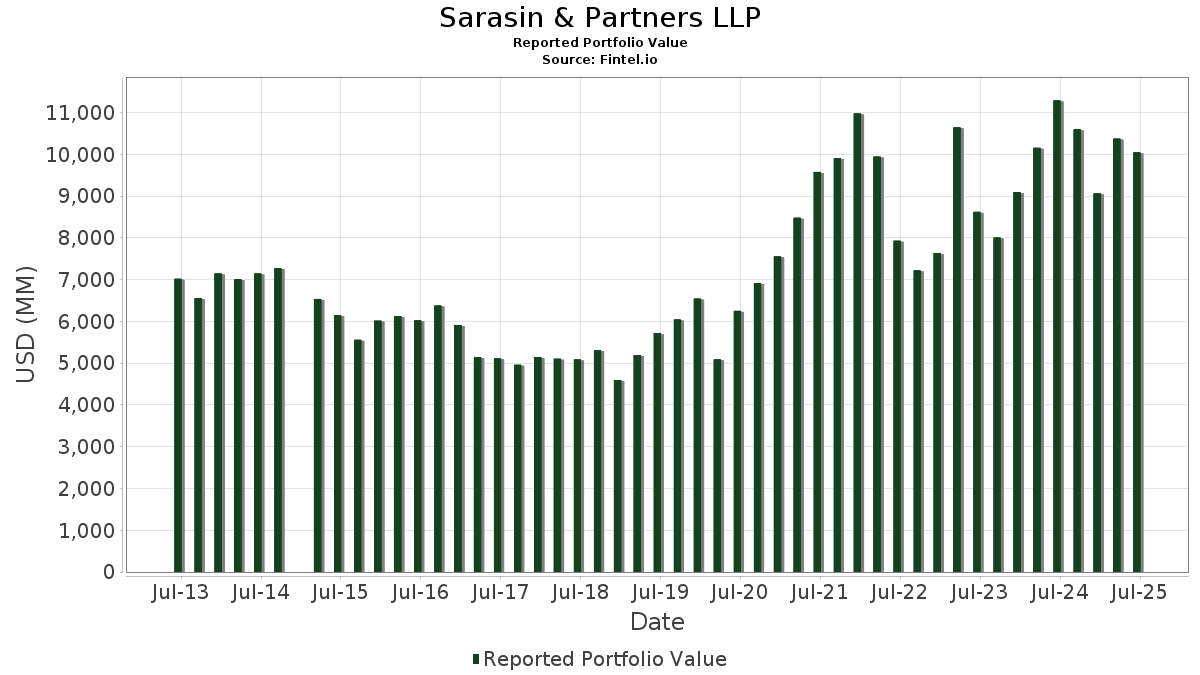
| Portföljvärde | $ 10 046 194 362 |
| Aktuella positioner | 80 |
Senaste innehav, resultat, förvaltat kapital (från 13F, 13D)
Sarasin & Partners LLP har redovisat 80 totala innehav i sina senaste SEC-arkiveringar. Det senaste portföljvärdet beräknas vara $ 10 046 194 362 USD. Faktiskt förvaltade tillgångar (AUM) är detta värde plus likvida medel (som inte redovisas). Sarasin & Partners LLPs största innehav är Microsoft Corporation (US:MSFT) , NVIDIA Corporation (US:NVDA) , Amazon.com, Inc. (US:AMZN) , Meta Platforms, Inc. (US:META) , and Alphabet Inc. (US:GOOGL) . Sarasin & Partners LLPs nya positioner inkluderar Marsh & McLennan Companies, Inc. (US:MMC) , Vanguard International Equity Index Funds - Vanguard FTSE Europe ETF (US:VGK) , Copart, Inc. (US:CPRT) , .
Största ökningarna detta kvartal
Vi använder förändringen i portföljallokeringen eftersom det är det mest meningsfulla måttet. Förändringar kan bero på transaktioner eller förändringar i aktiekurser.
| Värdepapper | Aktier (MM) |
Värde (MM$) |
Portfölj % av | ΔPortfölj % av |
|---|---|---|---|---|
| 2,10 | 1 044,20 | 10,3940 | 1,7575 | |
| 3,92 | 620,06 | 6,1721 | 1,6442 | |
| 0,56 | 122,29 | 1,2173 | 1,2173 | |
| 0,10 | 132,66 | 1,3205 | 1,1339 | |
| 0,81 | 223,53 | 2,2250 | 1,1076 | |
| 0,15 | 154,85 | 1,5414 | 0,8953 | |
| 0,08 | 199,43 | 1,9851 | 0,6924 | |
| 0,63 | 466,63 | 4,6448 | 0,6258 | |
| 2,42 | 322,38 | 3,2090 | 0,5616 | |
| 1,13 | 326,20 | 3,2470 | 0,3888 |
Största minskningarna detta kvartal
Vi använder förändringen i portföljallokeringen eftersom det är det mest meningsfulla måttet. Förändringar kan bero på transaktioner eller förändringar i aktiepriser.
| Värdepapper | Aktier (MM) |
Värde (MM$) |
Portfölj % av | ΔPortfölj % av |
|---|---|---|---|---|
| 1,40 | 286,60 | 2,8528 | −1,4442 | |
| 0,60 | 188,73 | 1,8786 | −1,2697 | |
| 0,26 | 104,04 | 1,0356 | −0,9938 | |
| 1,01 | 279,72 | 2,7843 | −0,5891 | |
| 0,71 | 397,46 | 3,9563 | −0,5599 | |
| 3,58 | 354,63 | 3,5300 | −0,5461 | |
| 1,08 | 139,82 | 1,3918 | −0,4813 | |
| 0,40 | 204,34 | 2,0340 | −0,2840 | |
| 1,61 | 251,33 | 2,5017 | −0,2727 | |
| 4,10 | 372,94 | 3,7123 | −0,2248 |
13F- och fond arkiveringar
Denna blankett lämnades in den 2025-07-09 för rapporteringsperioden 2025-06-30. Klicka på länksymbolen för att se hela transaktionshistoriken.
Uppgradera för att låsa upp premiumdata och exportera till Excel![]() .
.
| Värdepapper | Typ | Genomsnittligt aktiepris | Aktier (MM) |
ΔAktier (%) |
ΔAktier (%) |
Värde ($MM) |
Portfölj (%) |
ΔPortfölj (%) |
|
|---|---|---|---|---|---|---|---|---|---|
| MSFT / Microsoft Corporation | 2,10 | −1,05 | 1 044,20 | 31,11 | 10,3940 | 1,7575 | |||
| NVDA / NVIDIA Corporation | 3,92 | 1,87 | 620,06 | 48,50 | 6,1721 | 1,6442 | |||
| AMZN / Amazon.com, Inc. | 2,54 | 1,00 | 556,52 | 16,46 | 5,5396 | 0,3576 | |||
| META / Meta Platforms, Inc. | 0,63 | −1,68 | 466,63 | 25,91 | 4,6448 | 0,6258 | |||
| GOOGL / Alphabet Inc. | 2,50 | −2,43 | 440,61 | 11,19 | 4,3858 | 0,0886 | |||
| MA / Mastercard Incorporated | 0,71 | −6,91 | 397,46 | −4,56 | 3,9563 | −0,5599 | |||
| CL / Colgate-Palmolive Company | 4,10 | 5,89 | 372,94 | 2,72 | 3,7123 | −0,2248 | |||
| OTIS / Otis Worldwide Corporation | 3,58 | −1,67 | 354,63 | −5,65 | 3,5300 | −0,5461 | |||
| JPM / JPMorgan Chase & Co. | 1,13 | 4,72 | 326,20 | 23,76 | 3,2470 | 0,3888 | |||
| EMR / Emerson Electric Co. | 2,42 | 8,59 | 322,38 | 32,05 | 3,2090 | 0,5616 | |||
| FTNT / Fortinet, Inc. | 2,81 | 12,61 | 296,94 | 23,68 | 2,9557 | 0,3522 | |||
| AAPL / Apple Inc. | 1,40 | −21,69 | 286,60 | −27,67 | 2,8528 | −1,4442 | |||
| CME / CME Group Inc. | 1,01 | −13,45 | 279,72 | −10,08 | 2,7843 | −0,5891 | |||
| ZTS / Zoetis Inc. | 1,61 | 3,71 | 251,33 | −1,77 | 2,5017 | −0,2727 | |||
| HD / The Home Depot, Inc. | 0,67 | 0,97 | 245,90 | 1,01 | 2,4477 | −0,1923 | |||
| COST / Costco Wholesale Corporation | 0,24 | −0,08 | 235,44 | 4,58 | 2,3436 | −0,0977 | |||
| BLK / BlackRock, Inc. | 0,22 | −8,56 | 234,24 | 1,37 | 2,3316 | −0,1742 | |||
| AVGO / Broadcom Inc. | 0,81 | 31,76 | 223,53 | 116,92 | 2,2250 | 1,1076 | |||
| MCO / Moody's Corporation | 0,42 | −5,77 | 210,80 | 1,49 | 2,0983 | −0,1540 | |||
| DE / Deere & Company | 0,40 | −11,76 | 204,34 | −4,41 | 2,0340 | −0,2840 | |||
| MELI / MercadoLibre, Inc. | 0,08 | 24,88 | 199,43 | 67,30 | 1,9851 | 0,6924 | |||
| UNH / UnitedHealth Group Incorporated | 0,60 | 9,14 | 188,73 | −34,99 | 1,8786 | −1,2697 | |||
| LLY / Eli Lilly and Company | 0,24 | 4,27 | 185,37 | −1,59 | 1,8451 | −0,1974 | |||
| AMT / American Tower Corporation | 0,78 | −3,51 | 171,63 | −2,00 | 1,7084 | −0,1907 | |||
| AMGN / Amgen Inc. | 0,61 | 9,79 | 170,91 | −1,61 | 1,7012 | −0,1824 | |||
| TTEK / Tetra Tech, Inc. | 4,68 | 1,19 | 168,42 | 24,40 | 1,6765 | 0,2083 | |||
| NOW / ServiceNow, Inc. | 0,15 | 101,28 | 154,85 | 159,92 | 1,5414 | 0,8953 | |||
| CMG / Chipotle Mexican Grill, Inc. | 2,54 | 2,23 | 142,49 | 14,33 | 1,4184 | 0,0668 | |||
| KMB / Kimberly-Clark Corporation | 1,08 | −10,70 | 139,82 | −19,05 | 1,3918 | −0,4813 | |||
| NFLX / Netflix, Inc. | 0,10 | 436,68 | 132,66 | 670,71 | 1,3205 | 1,1339 | |||
| CSCO / Cisco Systems, Inc. | 1,80 | 2,60 | 125,21 | 15,35 | 1,2463 | 0,0692 | |||
| MMC / Marsh & McLennan Companies, Inc. | 0,56 | 122,29 | 1,2173 | 1,2173 | |||||
| TMO / Thermo Fisher Scientific Inc. | 0,26 | −31,77 | 104,04 | −44,41 | 1,0356 | −0,9938 | |||
| PLD / Prologis, Inc. | 0,80 | −7,84 | 84,04 | −13,34 | 0,8365 | −0,2151 | |||
| AOS / A. O. Smith Corporation | 1,19 | 4,77 | 77,97 | 5,11 | 0,7761 | −0,0283 | |||
| MRK / Merck & Co., Inc. | 0,95 | 2,21 | 74,97 | −9,86 | 0,7463 | −0,1557 | |||
| ROST / Ross Stores, Inc. | 0,46 | 0,54 | 59,14 | 0,38 | 0,5887 | −0,0502 | |||
| MS / Morgan Stanley | 0,37 | 0,47 | 51,77 | 21,30 | 0,5153 | 0,0525 | |||
| PFE / Pfizer Inc. | 1,45 | −1,25 | 35,26 | −5,53 | 0,3509 | −0,0538 | |||
| GGG / Graco Inc. | 0,31 | 0,72 | 26,45 | 3,69 | 0,2633 | −0,0134 | |||
| TXN / Texas Instruments Incorporated | 0,13 | −0,41 | 26,40 | 15,06 | 0,2628 | 0,0140 | |||
| SNA / Snap-on Incorporated | 0,08 | 5,68 | 25,72 | −2,42 | 0,2560 | −0,0298 | |||
| GLD / SPDR Gold Trust | 0,06 | −3,26 | 18,23 | 2,34 | 0,1815 | −0,0117 | |||
| ECL / Ecolab Inc. | 0,06 | 8,36 | 15,52 | 15,17 | 0,1545 | 0,0083 | |||
| GOOGL / Alphabet Inc. | 0,08 | −16,73 | 13,86 | −5,44 | 0,1380 | −0,0210 | |||
| WY / Weyerhaeuser Company | 0,51 | 8,95 | 13,11 | −4,41 | 0,1305 | −0,0182 | |||
| WELL / Welltower Inc. | 0,07 | 5,77 | 10,69 | 6,13 | 0,1064 | −0,0028 | |||
| PSA / Public Storage | 0,03 | 50,62 | 9,46 | 47,67 | 0,0942 | 0,0247 | |||
| EQIX / Equinix, Inc. | 0,01 | 0,16 | 8,49 | −2,28 | 0,0845 | −0,0097 | |||
| PWR / Quanta Services, Inc. | 0,02 | 11,86 | 8,07 | 66,40 | 0,0803 | 0,0277 | |||
| DOC / Healthpeak Properties, Inc. | 0,44 | 0,00 | 7,73 | −13,41 | 0,0770 | −0,0199 | |||
| VTR / Ventas, Inc. | 0,12 | 0,00 | 7,33 | −8,17 | 0,0730 | −0,0136 | |||
| EVR / Evercore Inc. | 0,03 | 0,00 | 6,75 | 35,19 | 0,0672 | 0,0130 | |||
| ELF / e.l.f. Beauty, Inc. | 0,05 | 110,41 | 6,54 | 317,08 | 0,0651 | 0,0481 | |||
| ARMK / Aramark | 0,15 | −0,01 | 6,47 | 21,28 | 0,0644 | 0,0066 | |||
| EQR / Equity Residential | 0,09 | −4,48 | 6,24 | −9,94 | 0,0621 | −0,0130 | |||
| DLR / Digital Realty Trust, Inc. | 0,03 | 5,57 | 0,0555 | 0,0555 | |||||
| SPG / Simon Property Group, Inc. | 0,03 | 5,52 | 0,0549 | 0,0549 | |||||
| AVB / AvalonBay Communities, Inc. | 0,03 | −3,63 | 5,19 | −8,62 | 0,0516 | −0,0099 | |||
| WMT / Walmart Inc. | 0,05 | −16,66 | 4,89 | −7,17 | 0,0487 | −0,0085 | |||
| BND / Vanguard Bond Index Funds - Vanguard Total Bond Market ETF | 0,06 | −6,69 | 4,52 | −6,46 | 0,0450 | −0,0074 | |||
| ESS / Essex Property Trust, Inc. | 0,02 | 0,00 | 4,32 | −7,56 | 0,0430 | −0,0077 | |||
| VWO / Vanguard International Equity Index Funds - Vanguard FTSE Emerging Markets ETF | 0,09 | 46,78 | 4,28 | 60,38 | 0,0426 | 0,0137 | |||
| MAR / Marriott International, Inc. | 0,02 | 2,60 | 4,22 | 17,69 | 0,0420 | 0,0031 | |||
| VT / Vanguard International Equity Index Funds - Vanguard Total World Stock ETF | 0,03 | 27,97 | 3,85 | 41,84 | 0,0383 | 0,0089 | |||
| CPT / Camden Property Trust | 0,03 | 0,00 | 3,49 | −7,85 | 0,0347 | −0,0063 | |||
| ARE / Alexandria Real Estate Equities, Inc. | 0,04 | 0,00 | 2,86 | −21,50 | 0,0285 | −0,0110 | |||
| BRBR / BellRing Brands, Inc. | 0,04 | −10,00 | 2,61 | −30,00 | 0,0259 | −0,0144 | |||
| HDB / HDFC Bank Limited - Depositary Receipt (Common Stock) | 0,03 | −26,94 | 2,16 | −15,68 | 0,0215 | −0,0063 | |||
| FMX / Fomento Económico Mexicano, S.A.B. de C.V. - Depositary Receipt (Common Stock) | 0,02 | 0,00 | 2,06 | 5,54 | 0,0205 | −0,0007 | |||
| MDLZ / Mondelez International, Inc. | 0,03 | 0,00 | 2,02 | −0,59 | 0,0201 | −0,0019 | |||
| KRC / Kilroy Realty Corporation | 0,06 | 0,00 | 2,00 | 4,76 | 0,0199 | −0,0008 | |||
| VGK / Vanguard International Equity Index Funds - Vanguard FTSE Europe ETF | 0,02 | 1,57 | 0,0156 | 0,0156 | |||||
| FRPT / Freshpet, Inc. | 0,02 | 0,00 | 1,53 | −18,28 | 0,0152 | −0,0051 | |||
| CPRT / Copart, Inc. | 0,03 | 1,42 | 0,0141 | 0,0141 | |||||
| AGCO / AGCO Corporation | 0,01 | −32,50 | 1,39 | −24,80 | 0,0139 | −0,0062 | |||
| ABNB / Airbnb, Inc. | 0,01 | 0,00 | 1,37 | 10,75 | 0,0136 | 0,0002 | |||
| CCI / Crown Castle Inc. | 0,01 | −68,12 | 1,13 | −68,59 | 0,0112 | −0,0277 | |||
| BXP / Boston Properties, Inc. | 0,02 | −4,66 | 1,06 | −4,25 | 0,0105 | −0,0015 | |||
| KIM / Kimco Realty Corporation | 0,03 | 0,62 | 0,0062 | 0,0062 | |||||
| EQNR / Equinor ASA - Depositary Receipt (Common Stock) | 0,00 | −100,00 | 0,00 | −100,00 | −0,1337 | ||||
| DOCS / Doximity, Inc. | 0,00 | −100,00 | 0,00 | 0,0000 | |||||
| DIS / The Walt Disney Company | 0,00 | −100,00 | 0,00 | 0,0000 | |||||
| BAC / Bank of America Corporation | 0,00 | −100,00 | 0,00 | 0,0000 | |||||
| LW / Lamb Weston Holdings, Inc. | 0,00 | −100,00 | 0,00 | −100,00 | −0,0125 | ||||
| NKE / NIKE, Inc. | 0,00 | −100,00 | 0,00 | 0,0000 | |||||
| OXY / Occidental Petroleum Corporation | 0,00 | −100,00 | 0,00 | 0,0000 | |||||
| TSM / Taiwan Semiconductor Manufacturing Company Limited - Depositary Receipt (Common Stock) | 0,00 | −100,00 | 0,00 | 0,0000 | |||||
| MAA / Mid-America Apartment Communities, Inc. | 0,00 | −100,00 | 0,00 | 0,0000 | |||||
| ADM / Archer-Daniels-Midland Company | 0,00 | −100,00 | 0,00 | −100,00 | −0,0144 |