Grundläggande statistik
| Portföljvärde | $ 109 249 000 |
| Aktuella positioner | 72 |
Senaste innehav, resultat, förvaltat kapital (från 13F, 13D)
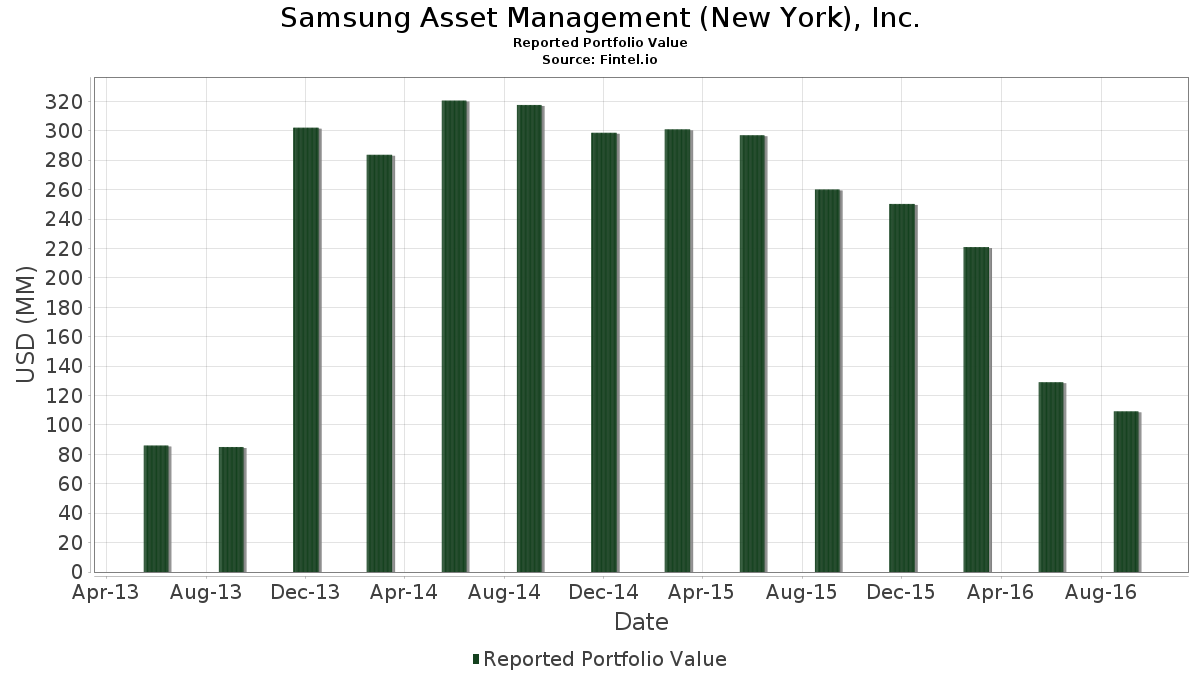
Samsung Asset Management (New York), Inc. har redovisat 72 totala innehav i sina senaste SEC-arkiveringar. Det senaste portföljvärdet beräknas vara $ 109 249 000 USD. Faktiskt förvaltade tillgångar (AUM) är detta värde plus likvida medel (som inte redovisas). Samsung Asset Management (New York), Inc.s största innehav är Apple Inc. (US:AAPL) , The Procter & Gamble Company (US:PG) , Alphabet Inc. (US:GOOGL) , Biogen Inc. (US:BIIB) , and Meta Platforms, Inc. (US:META) .
Största ökningarna detta kvartal
Vi använder förändringen i portföljallokeringen eftersom det är det mest meningsfulla måttet. Förändringar kan bero på transaktioner eller förändringar i aktiekurser.
| Värdepapper | Aktier (MM) |
Värde (MM$) |
Portfölj % av | ΔPortfölj % av |
|---|---|---|---|---|
| 0,03 | 1,24 | 1,1350 | 1,1350 | |
| 0,01 | 4,07 | 3,7218 | 0,7463 | |
| 0,02 | 0,79 | 0,7240 | 0,7240 | |
| 0,04 | 4,66 | 4,2673 | 0,5325 | |
| 0,01 | 4,40 | 4,0257 | 0,3838 | |
| 0,03 | 3,10 | 2,8330 | 0,2961 | |
| 0,03 | 3,90 | 3,5707 | 0,2784 | |
| 0,01 | 1,28 | 1,1726 | 0,2350 | |
| 0,02 | 1,28 | 1,1698 | 0,2322 | |
| 0,00 | 1,94 | 1,7785 | 0,2094 |
Största minskningarna detta kvartal
Vi använder förändringen i portföljallokeringen eftersom det är det mest meningsfulla måttet. Förändringar kan bero på transaktioner eller förändringar i aktiepriser.
| Värdepapper | Aktier (MM) |
Värde (MM$) |
Portfölj % av | ΔPortfölj % av |
|---|---|---|---|---|
| 0,01 | 1,37 | 1,2568 | −1,1221 | |
| 0,01 | 1,01 | 0,9282 | −0,8548 | |
| 0,07 | 2,64 | 2,4147 | −0,4205 | |
| 0,04 | 3,36 | 3,0719 | −0,2778 | |
| 0,05 | 2,20 | 2,0128 | −0,2141 | |
| 0,08 | 2,68 | 2,4522 | −0,1870 | |
| 0,04 | 2,03 | 1,8563 | −0,1707 | |
| 0,05 | 3,33 | 3,0444 | −0,1464 | |
| 0,05 | 1,45 | 1,3291 | −0,1323 | |
| 0,03 | 2,62 | 2,3991 | −0,1293 |
13F- och fond arkiveringar
Denna blankett lämnades in den 2016-11-10 för rapporteringsperioden 2016-09-30. Klicka på länksymbolen för att se hela transaktionshistoriken.
Uppgradera för att låsa upp premiumdata och exportera till Excel![]() .
.
| Värdepapper | Typ | Genomsnittligt aktiepris | Aktier (MM) |
ΔAktier (%) |
ΔAktier (%) |
Värde ($MM) |
Portfölj (%) |
ΔPortfölj (%) |
|
|---|---|---|---|---|---|---|---|---|---|
| AAPL / Apple Inc. | 0,04 | −18,21 | 4,66 | −3,28 | 4,2673 | 0,5325 | |||
| PG / The Procter & Gamble Company | 0,05 | −18,21 | 4,63 | −13,30 | 4,2426 | 0,1002 | |||
| GOOGL / Alphabet Inc. | 0,01 | −18,11 | 4,40 | −6,43 | 4,0257 | 0,3838 | |||
| BIIB / Biogen Inc. | 0,01 | −18,20 | 4,07 | 5,89 | 3,7218 | 0,7463 | |||
| META / Meta Platforms, Inc. | 0,03 | −18,21 | 3,90 | −8,19 | 3,5707 | 0,2784 | |||
| DIS / The Walt Disney Company | 0,04 | −18,22 | 3,36 | −22,37 | 3,0719 | −0,2778 | |||
| WMT / Walmart Inc. | 0,05 | −18,21 | 3,33 | −19,23 | 3,0444 | −0,1464 | |||
| MRK / Merck & Co., Inc. | 0,05 | −18,23 | 3,31 | −11,40 | 3,0298 | 0,1349 | |||
| MA / Mastercard Incorporated | 0,03 | −18,21 | 3,10 | −5,47 | 2,8330 | 0,2961 | |||
| PFE / Pfizer Inc. | 0,08 | −18,22 | 2,68 | −21,34 | 2,4522 | −0,1870 | |||
| US00C4U1L353 / Mylan N.V. | 0,07 | −18,21 | 2,64 | −27,90 | 2,4147 | −0,4205 | |||
| CVX / Chevron Corporation | 0,03 | −18,18 | 2,62 | −19,68 | 2,3991 | −0,1293 | |||
| UPS / United Parcel Service, Inc. | 0,02 | −18,23 | 2,42 | −16,99 | 2,2179 | −0,0439 | |||
| EMR / Emerson Electric Co. | 0,04 | −18,21 | 2,35 | −14,50 | 2,1474 | 0,0212 | |||
| WFC / Wells Fargo & Company | 0,05 | −18,21 | 2,20 | −23,49 | 2,0128 | −0,2141 | |||
| CSCO / Cisco Systems, Inc. | 0,07 | −18,22 | 2,10 | −9,58 | 1,9268 | 0,1229 | |||
| SBUX / Starbucks Corporation | 0,04 | −18,23 | 2,03 | −22,48 | 1,8563 | −0,1707 | |||
| BRK.B / Berkshire Hathaway Inc. | 0,01 | −18,19 | 1,96 | −18,36 | 1,7904 | −0,0662 | |||
| AMZN / Amazon.com, Inc. | 0,00 | −18,02 | 1,94 | −4,05 | 1,7785 | 0,2094 | |||
| AXP / American Express Company | 0,03 | −18,23 | 1,79 | −13,80 | 1,6357 | 0,0294 | |||
| AMG / Affiliated Managers Group, Inc. | 0,01 | −18,19 | 1,78 | −15,90 | 1,6266 | −0,0107 | |||
| UNH / UnitedHealth Group Incorporated | 0,01 | −18,21 | 1,77 | −18,88 | 1,6238 | −0,0708 | |||
| ORCL / Oracle Corporation | 0,04 | −18,22 | 1,61 | −21,55 | 1,4764 | −0,1167 | |||
| RTX / RTX Corporation | 0,02 | −18,19 | 1,53 | −18,96 | 1,3968 | −0,0622 | |||
| BAC / Bank of America Corporation | 0,10 | −18,22 | 1,50 | −3,59 | 1,3767 | 0,1679 | |||
| HON / Honeywell International Inc. | 0,01 | −18,21 | 1,50 | −18,00 | 1,3758 | −0,0446 | |||
| PNC / The PNC Financial Services Group, Inc. | 0,02 | −18,22 | 1,50 | −9,50 | 1,3693 | 0,0885 | |||
| GE / General Electric Company | 0,05 | −18,21 | 1,45 | −23,01 | 1,3291 | −0,1323 | |||
| MSFT / Microsoft Corporation | 0,02 | −18,21 | 1,43 | −7,93 | 1,3071 | 0,1053 | |||
| UNP / Union Pacific Corporation | 0,01 | −59,99 | 1,37 | −55,28 | 1,2568 | −1,1221 | |||
| C / Citigroup Inc. | 0,03 | −18,21 | 1,36 | −8,86 | 1,2430 | 0,0885 | |||
| ILMN / Illumina, Inc. | 0,01 | −18,21 | 1,28 | 5,87 | 1,1726 | 0,2350 | |||
| PRU / Prudential Financial, Inc. | 0,02 | −18,17 | 1,28 | −6,37 | 1,1707 | 0,1123 | |||
| STT / State Street Corporation | 0,02 | −18,23 | 1,28 | 5,62 | 1,1698 | 0,2322 | |||
| URI / United Rentals, Inc. | 0,02 | −18,23 | 1,26 | −4,31 | 1,1570 | 0,1334 | |||
| CCEP / Coca-Cola Europacific Partners PLC | 0,03 | −18,19 | 1,24 | −8,55 | 1,1350 | 1,1350 | |||
| HD / The Home Depot, Inc. | 0,01 | −18,16 | 1,13 | −17,51 | 1,0352 | −0,0271 | |||
| JPM / JPMorgan Chase & Co. | 0,02 | −18,23 | 1,13 | −12,41 | 1,0334 | 0,0346 | |||
| CVS / CVS Health Corporation | 0,01 | −18,16 | 1,11 | −23,92 | 1,0133 | −0,1141 | |||
| PHM / PulteGroup, Inc. | 0,06 | −18,21 | 1,10 | −15,87 | 1,0096 | −0,0062 | |||
| STI / Solidion Technology, Inc. | 0,03 | −18,21 | 1,10 | −12,75 | 1,0087 | 0,0301 | |||
| BWA / BorgWarner Inc. | 0,03 | −18,22 | 1,08 | −2,52 | 0,9913 | 0,1304 | |||
| CAT / Caterpillar Inc. | 0,01 | −18,19 | 1,03 | −4,26 | 0,9465 | 0,1096 | |||
| 61166W101 / Monsanto Co. | 0,01 | −18,24 | 1,02 | −19,16 | 0,9309 | −0,0439 | |||
| EOG / EOG Resources, Inc. | 0,01 | −61,97 | 1,01 | −55,93 | 0,9282 | −0,8548 | |||
| MET / MetLife, Inc. | 0,02 | −18,19 | 0,95 | −8,77 | 0,8668 | 0,0625 | |||
| AMGN / Amgen Inc. | 0,01 | −18,07 | 0,92 | −10,22 | 0,8439 | 0,0482 | |||
| GOOG / Alphabet Inc. | 0,00 | −18,01 | 0,92 | −7,91 | 0,8421 | 0,0680 | |||
| GS / The Goldman Sachs Group, Inc. | 0,01 | −18,05 | 0,91 | −11,07 | 0,8311 | 0,0400 | |||
| XOM / Exxon Mobil Corporation | 0,01 | −18,17 | 0,89 | −23,83 | 0,8165 | −0,0909 | |||
| INTC / Intel Corporation | 0,02 | −18,19 | 0,83 | −5,76 | 0,7634 | 0,0776 | |||
| VZ / Verizon Communications Inc. | 0,02 | −18,20 | 0,81 | −23,89 | 0,7378 | −0,0828 | |||
| EQT / EQT Corporation | 0,01 | −18,20 | 0,80 | −23,22 | 0,7323 | −0,0751 | |||
| BHI / Baker Hughes Inc. | 0,02 | −18,17 | 0,79 | −8,45 | 0,7240 | 0,7240 | |||
| IBM / International Business Machines Corporation | 0,00 | −18,26 | 0,72 | −14,42 | 0,6572 | 0,0071 | |||
| DOW / Dow Inc. | 0,01 | −18,14 | 0,68 | −15,37 | 0,6197 | −0,0002 | |||
| SO / The Southern Company | 0,01 | −18,20 | 0,67 | −21,79 | 0,6142 | −0,0506 | |||
| VLO / Valero Energy Corporation | 0,01 | −18,25 | 0,66 | −14,99 | 0,6023 | 0,0026 | |||
| T / AT&T Inc. | 0,02 | −18,19 | 0,62 | −23,10 | 0,5638 | −0,0568 | |||
| MJN / Mead Johnson Nutrition Co. | 0,01 | −18,19 | 0,61 | −28,74 | 0,5629 | −0,1058 | |||
| NKE / NIKE, Inc. | 0,01 | −18,19 | 0,61 | −22,01 | 0,5611 | −0,0479 | |||
| DUK / Duke Energy Corporation | 0,01 | −18,18 | 0,58 | −23,69 | 0,5336 | −0,0583 | |||
| COP / ConocoPhillips | 0,01 | −18,19 | 0,57 | −18,48 | 0,5208 | −0,0200 | |||
| KMI / Kinder Morgan, Inc. | 0,02 | −18,20 | 0,55 | 1,10 | 0,5034 | 0,0819 | |||
| BBBY / Bed Bath & Beyond, Inc. | 0,01 | −18,22 | 0,46 | −18,34 | 0,4238 | −0,0155 | |||
| GILD / Gilead Sciences, Inc. | 0,01 | −18,11 | 0,43 | −22,26 | 0,3963 | −0,0353 | |||
| PYPL / PayPal Holdings, Inc. | 0,01 | −18,22 | 0,40 | −8,20 | 0,3689 | 0,0287 | |||
| UAA / Under Armour, Inc. | 0,01 | −18,19 | 0,40 | −21,16 | 0,3616 | −0,0266 | |||
| UA / Under Armour, Inc. | 0,01 | −18,27 | 0,35 | −24,02 | 0,3185 | −0,0363 | |||
| ARNC / Arconic Corporation | 0,03 | −18,21 | 0,34 | −10,53 | 0,3112 | 0,0168 | |||
| EBAY / eBay Inc. | 0,01 | −18,22 | 0,32 | 14,95 | 0,2957 | 0,0779 | |||
| NEE / NextEra Energy, Inc. | 0,00 | −17,70 | 0,11 | −22,45 | 0,1043 | −0,0096 |