Grundläggande statistik
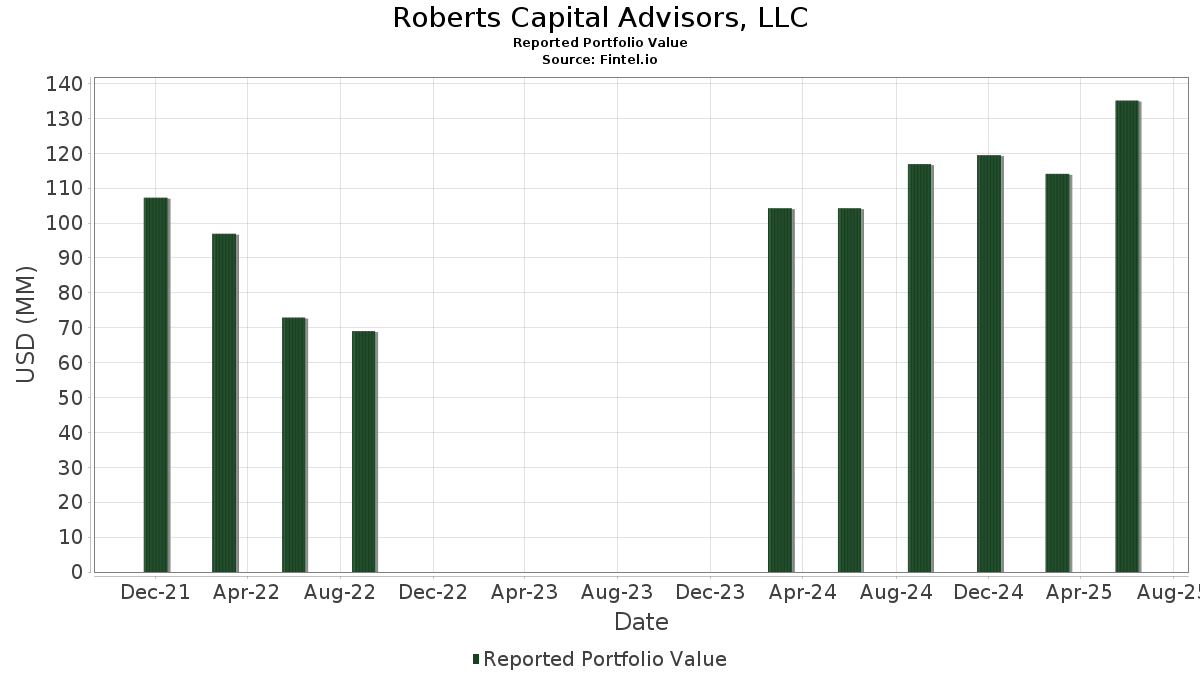
| Portföljvärde | $ 135 098 364 |
| Aktuella positioner | 78 |
Senaste innehav, resultat, förvaltat kapital (från 13F, 13D)
Roberts Capital Advisors, LLC har redovisat 78 totala innehav i sina senaste SEC-arkiveringar. Det senaste portföljvärdet beräknas vara $ 135 098 364 USD. Faktiskt förvaltade tillgångar (AUM) är detta värde plus likvida medel (som inte redovisas). Roberts Capital Advisors, LLCs största innehav är Microsoft Corporation (US:MSFT) , NVIDIA Corporation (US:NVDA) , Apple Inc. (US:AAPL) , Amazon.com, Inc. (US:AMZN) , and Meta Platforms, Inc. (US:META) .
Största ökningarna detta kvartal
Vi använder förändringen i portföljallokeringen eftersom det är det mest meningsfulla måttet. Förändringar kan bero på transaktioner eller förändringar i aktiekurser.
| Värdepapper | Aktier (MM) |
Värde (MM$) |
Portfölj % av | ΔPortfölj % av |
|---|---|---|---|---|
| 0,02 | 5,00 | 3,7043 | 1,6514 | |
| 0,07 | 11,67 | 8,6363 | 1,6215 | |
| 0,02 | 11,83 | 8,7543 | 0,9316 | |
| 0,01 | 2,42 | 1,7936 | 0,5744 | |
| 0,00 | 3,53 | 2,6129 | 0,4585 | |
| 0,01 | 2,06 | 1,5257 | 0,3705 | |
| 0,01 | 6,30 | 4,6657 | 0,3518 | |
| 0,00 | 2,63 | 1,9483 | 0,3511 | |
| 0,01 | 1,51 | 1,1164 | 0,2980 | |
| 0,01 | 0,88 | 0,6513 | 0,2177 |
Största minskningarna detta kvartal
Vi använder förändringen i portföljallokeringen eftersom det är det mest meningsfulla måttet. Förändringar kan bero på transaktioner eller förändringar i aktiepriser.
| Värdepapper | Aktier (MM) |
Värde (MM$) |
Portfölj % av | ΔPortfölj % av |
|---|---|---|---|---|
| 0,05 | 9,97 | 7,3774 | −2,0799 | |
| 0,01 | 1,04 | 0,7690 | −0,2836 | |
| 0,00 | 1,08 | 0,7993 | −0,2601 | |
| 0,01 | 2,07 | 1,5327 | −0,2586 | |
| 0,00 | 1,15 | 0,8481 | −0,2394 | |
| 0,01 | 2,97 | 2,2013 | −0,2024 | |
| 0,00 | 1,57 | 1,1651 | −0,1805 | |
| 0,00 | 1,80 | 1,3343 | −0,1751 | |
| 0,00 | 1,20 | 0,8880 | −0,1555 | |
| 0,03 | 7,45 | 5,5168 | −0,1480 |
13F- och fond arkiveringar
Denna blankett lämnades in den 2025-08-13 för rapporteringsperioden 2025-06-30. Klicka på länksymbolen för att se hela transaktionshistoriken.
Uppgradera för att låsa upp premiumdata och exportera till Excel![]() .
.
| Värdepapper | Typ | Genomsnittligt aktiepris | Aktier (MM) |
ΔAktier (%) |
ΔAktier (%) |
Värde ($MM) |
Portfölj (%) |
ΔPortfölj (%) |
|
|---|---|---|---|---|---|---|---|---|---|
| MSFT / Microsoft Corporation | 0,02 | 0,00 | 11,83 | 32,50 | 8,7543 | 0,9316 | |||
| NVDA / NVIDIA Corporation | 0,07 | 0,00 | 11,67 | 45,78 | 8,6363 | 1,6215 | |||
| AAPL / Apple Inc. | 0,05 | 0,00 | 9,97 | −7,64 | 7,3774 | −2,0799 | |||
| AMZN / Amazon.com, Inc. | 0,03 | 0,00 | 7,45 | 15,32 | 5,5168 | −0,1480 | |||
| META / Meta Platforms, Inc. | 0,01 | 0,00 | 6,30 | 28,06 | 4,6657 | 0,3518 | |||
| AVGO / Broadcom Inc. | 0,02 | 29,77 | 5,00 | 113,66 | 3,7043 | 1,6514 | |||
| TSLA / Tesla, Inc. | 0,01 | 0,00 | 3,62 | 22,57 | 2,6779 | 0,0911 | |||
| NFLX / Netflix, Inc. | 0,00 | 0,00 | 3,53 | 43,57 | 2,6129 | 0,4585 | |||
| GOOG / Alphabet Inc. | 0,02 | 0,00 | 3,23 | 13,56 | 2,3934 | −0,1025 | |||
| GOOGL / Alphabet Inc. | 0,02 | 0,00 | 3,21 | 13,94 | 2,3729 | −0,0925 | |||
| CTAS / Cintas Corporation | 0,01 | 0,00 | 2,97 | 8,42 | 2,2013 | −0,2024 | |||
| GS / The Goldman Sachs Group, Inc. | 0,00 | 11,48 | 2,63 | 44,46 | 1,9483 | 0,3511 | |||
| JPM / JPMorgan Chase & Co. | 0,01 | 47,38 | 2,42 | 74,19 | 1,7936 | 0,5744 | |||
| V / Visa Inc. | 0,01 | 0,00 | 2,07 | 1,32 | 1,5327 | −0,2586 | |||
| ORCL / Oracle Corporation | 0,01 | 0,00 | 2,06 | 56,37 | 1,5257 | 0,3705 | |||
| PH / Parker-Hannifin Corporation | 0,00 | 0,00 | 2,02 | 14,91 | 1,4947 | −0,0455 | |||
| CLH / Clean Harbors, Inc. | 0,01 | 0,00 | 1,86 | 17,25 | 1,3787 | −0,0131 | |||
| COST / Costco Wholesale Corporation | 0,00 | 0,00 | 1,80 | 4,65 | 1,3343 | −0,1751 | |||
| MS / Morgan Stanley | 0,01 | 17,59 | 1,67 | 42,03 | 1,2336 | 0,2048 | |||
| MA / Mastercard Incorporated | 0,00 | 0,00 | 1,57 | 2,48 | 1,1651 | −0,1805 | |||
| PLTR / Palantir Technologies Inc. | 0,01 | 0,00 | 1,51 | 61,63 | 1,1164 | 0,2980 | |||
| LRCX / Lam Research Corporation | 0,01 | 0,00 | 1,39 | 33,95 | 1,0253 | 0,1186 | |||
| LIN / Linde plc | 0,00 | 0,00 | 1,20 | 0,76 | 0,8880 | −0,1555 | |||
| APH / Amphenol Corporation | 0,01 | 0,00 | 1,16 | 50,65 | 0,8612 | 0,1839 | |||
| INTU / Intuit Inc. | 0,00 | 0,00 | 1,16 | 28,27 | 0,8570 | 0,0660 | |||
| SNA / Snap-on Incorporated | 0,00 | 0,00 | 1,15 | −7,66 | 0,8481 | −0,2394 | |||
| CME / CME Group Inc. | 0,00 | 0,00 | 1,12 | 3,88 | 0,8324 | −0,1163 | |||
| BLK / BlackRock, Inc. | 0,00 | 0,00 | 1,10 | 10,89 | 0,8147 | −0,0555 | |||
| KLAC / KLA Corporation | 0,00 | 0,00 | 1,10 | 31,77 | 0,8142 | 0,0826 | |||
| MCO / Moody's Corporation | 0,00 | 0,00 | 1,09 | 7,68 | 0,8105 | −0,0805 | |||
| TMUS / T-Mobile US, Inc. | 0,00 | 0,00 | 1,08 | −10,68 | 0,7993 | −0,2601 | |||
| ABBV / AbbVie Inc. | 0,01 | −2,36 | 1,04 | −13,50 | 0,7690 | −0,2836 | |||
| MU / Micron Technology, Inc. | 0,01 | 0,00 | 1,00 | 41,82 | 0,7387 | 0,1221 | |||
| BKNG / Booking Holdings Inc. | 0,00 | 0,00 | 0,99 | 25,67 | 0,7328 | 0,0423 | |||
| SPGI / S&P Global Inc. | 0,00 | 0,00 | 0,99 | 3,78 | 0,7314 | −0,1031 | |||
| WMT / Walmart Inc. | 0,01 | 0,00 | 0,99 | 11,43 | 0,7292 | −0,0460 | |||
| SSNC / SS&C Technologies Holdings, Inc. | 0,01 | 0,00 | 0,97 | −0,92 | 0,7207 | −0,1402 | |||
| SHOP / Shopify Inc. | 0,01 | 0,00 | 0,97 | 20,77 | 0,7192 | 0,0143 | |||
| ISRG / Intuitive Surgical, Inc. | 0,00 | 0,00 | 0,93 | 9,76 | 0,6910 | −0,0547 | |||
| QCOM / QUALCOMM Incorporated | 0,01 | 0,00 | 0,92 | 3,71 | 0,6834 | −0,0971 | |||
| CVNA / Carvana Co. | 0,00 | 0,00 | 0,92 | 61,19 | 0,6832 | 0,1812 | |||
| NRG / NRG Energy, Inc. | 0,01 | 0,00 | 0,91 | 68,32 | 0,6773 | 0,2006 | |||
| HD / The Home Depot, Inc. | 0,00 | 0,00 | 0,91 | 0,11 | 0,6714 | −0,1232 | |||
| ADSK / Autodesk, Inc. | 0,00 | 0,00 | 0,90 | 18,24 | 0,6673 | −0,0009 | |||
| CRM / Salesforce, Inc. | 0,00 | 0,00 | 0,89 | 1,60 | 0,6584 | −0,1088 | |||
| VST / Vistra Corp. | 0,00 | 0,00 | 0,88 | 65,17 | 0,6535 | 0,1846 | |||
| VRT / Vertiv Holdings Co | 0,01 | 0,00 | 0,88 | 77,94 | 0,6513 | 0,2177 | |||
| RCL / Royal Caribbean Cruises Ltd. | 0,00 | 0,00 | 0,87 | 52,45 | 0,6458 | 0,1441 | |||
| CDNS / Cadence Design Systems, Inc. | 0,00 | 0,00 | 0,84 | 21,15 | 0,6238 | 0,0142 | |||
| DVA / DaVita Inc. | 0,01 | 43,49 | 0,84 | 33,60 | 0,6185 | 0,0705 | |||
| MSI / Motorola Solutions, Inc. | 0,00 | 0,00 | 0,79 | −4,00 | 0,5860 | −0,1365 | |||
| DASH / DoorDash, Inc. | 0,00 | 0,00 | 0,77 | 34,90 | 0,5724 | 0,0699 | |||
| AMAT / Applied Materials, Inc. | 0,00 | 0,00 | 0,77 | 26,11 | 0,5689 | 0,0349 | |||
| APP / AppLovin Corporation | 0,00 | 0,00 | 0,76 | 32,11 | 0,5608 | 0,0582 | |||
| ADBE / Adobe Inc. | 0,00 | 0,00 | 0,76 | 0,93 | 0,5599 | −0,0973 | |||
| EME / EMCOR Group, Inc. | 0,00 | 0,00 | 0,75 | 44,70 | 0,5563 | 0,1011 | |||
| SPOT / Spotify Technology S.A. | 0,00 | 0,00 | 0,75 | 39,63 | 0,5532 | 0,0837 | |||
| MSCI / MSCI Inc. | 0,00 | 0,00 | 0,75 | 1,92 | 0,5520 | −0,0889 | |||
| ACN / Accenture plc | 0,00 | 0,00 | 0,73 | −4,31 | 0,5431 | −0,1283 | |||
| AXP / American Express Company | 0,00 | 0,00 | 0,72 | 18,59 | 0,5343 | 0,0007 | |||
| JEF / Jefferies Financial Group Inc. | 0,01 | 0,00 | 0,69 | 2,08 | 0,5098 | −0,0815 | |||
| PANW / Palo Alto Networks, Inc. | 0,00 | 0,00 | 0,66 | 20,00 | 0,4887 | 0,0062 | |||
| CART / Maplebear Inc. | 0,01 | 0,00 | 0,63 | 13,44 | 0,4687 | −0,0206 | |||
| FFIV / F5, Inc. | 0,00 | 0,00 | 0,62 | 10,70 | 0,4597 | −0,0327 | |||
| FTNT / Fortinet, Inc. | 0,01 | 0,00 | 0,62 | 9,77 | 0,4579 | −0,0358 | |||
| JLL / Jones Lang LaSalle Incorporated | 0,00 | 0,00 | 0,62 | 3,17 | 0,4578 | −0,0676 | |||
| SCI / Service Corporation International | 0,01 | 0,00 | 0,61 | 1,51 | 0,4497 | −0,0749 | |||
| ADP / Automatic Data Processing, Inc. | 0,00 | 0,00 | 0,61 | 1,00 | 0,4490 | −0,0777 | |||
| ABNB / Airbnb, Inc. | 0,00 | 0,00 | 0,60 | 10,74 | 0,4429 | −0,0305 | |||
| NTAP / NetApp, Inc. | 0,01 | 0,00 | 0,60 | 21,30 | 0,4428 | 0,0106 | |||
| FICO / Fair Isaac Corporation | 0,00 | 0,00 | 0,59 | −0,83 | 0,4397 | −0,0855 | |||
| ROP / Roper Technologies, Inc. | 0,00 | 0,00 | 0,58 | −3,81 | 0,4296 | −0,0995 | |||
| DKS / DICK'S Sporting Goods, Inc. | 0,00 | 0,00 | 0,54 | −1,82 | 0,4000 | −0,0826 | |||
| VEEV / Veeva Systems Inc. | 0,00 | 0,00 | 0,54 | 24,36 | 0,3973 | 0,0189 | |||
| BKR / Baker Hughes Company | 0,01 | 0,00 | 0,53 | −12,89 | 0,3908 | −0,1396 | |||
| NXPI / NXP Semiconductors N.V. | 0,00 | 0,00 | 0,48 | 14,96 | 0,3584 | −0,0107 | |||
| VRTX / Vertex Pharmaceuticals Incorporated | 0,00 | −15,51 | 0,22 | −22,66 | 0,1598 | −0,0841 | |||
| AMD / Advanced Micro Devices, Inc. | 0,00 | 0,21 | 0,1577 | 0,1577 | |||||
| ABT / Abbott Laboratories | 0,00 | −100,00 | 0,00 | 0,0000 | |||||
| COO / The Cooper Companies, Inc. | 0,00 | −100,00 | 0,00 | 0,0000 | |||||
| HCA / HCA Healthcare, Inc. | 0,00 | −100,00 | 0,00 | 0,0000 | |||||
| GILD / Gilead Sciences, Inc. | 0,00 | −100,00 | 0,00 | 0,0000 | |||||
| MRK / Merck & Co., Inc. | 0,00 | −100,00 | 0,00 | 0,0000 | |||||
| JNJ / Johnson & Johnson | 0,00 | −100,00 | 0,00 | 0,0000 |