Grundläggande statistik
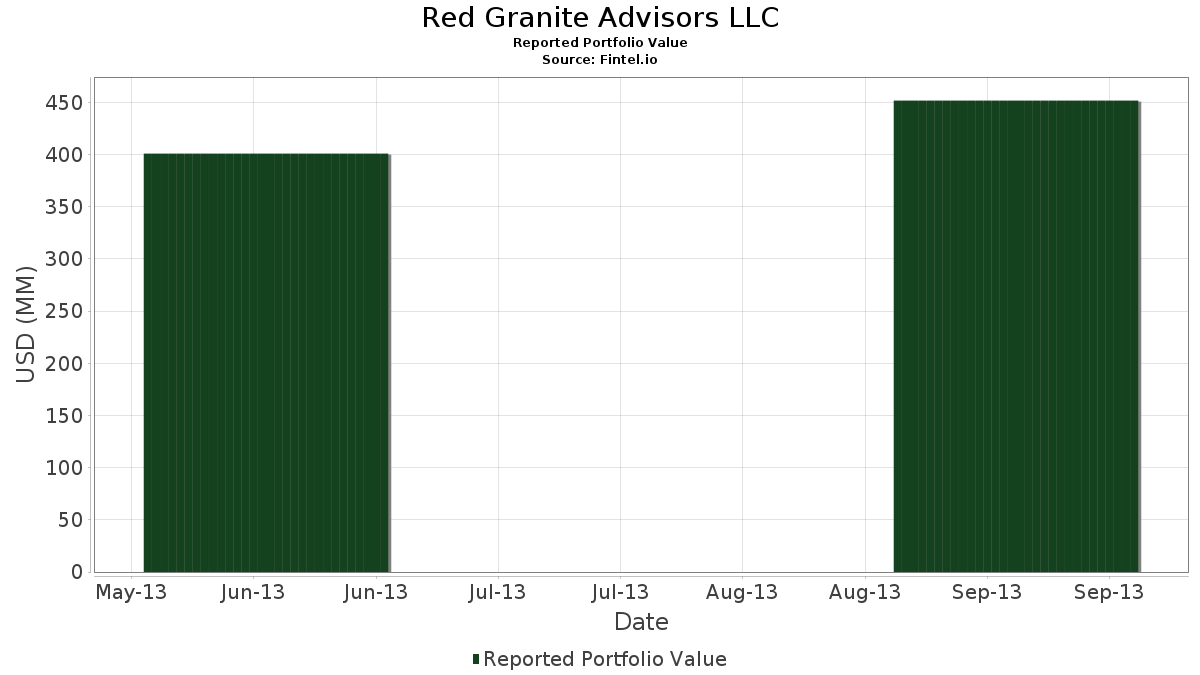
| Portföljvärde | $ 451 598 000 |
| Aktuella positioner | 61 |
Senaste innehav, resultat, förvaltat kapital (från 13F, 13D)
Red Granite Advisors LLC har redovisat 61 totala innehav i sina senaste SEC-arkiveringar. Det senaste portföljvärdet beräknas vara $ 451 598 000 USD. Faktiskt förvaltade tillgångar (AUM) är detta värde plus likvida medel (som inte redovisas). Red Granite Advisors LLCs största innehav är Biogen Inc. (US:BIIB) , Celgene Corp. (US:CELG) , Apple Inc. (US:AAPL) , Alphabet Inc. (US:GOOGL) , and Gilead Sciences, Inc. (US:GILD) . Red Granite Advisors LLCs nya positioner inkluderar DICK'S Sporting Goods, Inc. (US:DKS) , Intuitive Surgical, Inc. (US:ISRG) , Robert Half Inc. (US:RHI) , Informatica Inc. (US:INFA) , and .
Största ökningarna detta kvartal
Vi använder förändringen i portföljallokeringen eftersom det är det mest meningsfulla måttet. Förändringar kan bero på transaktioner eller förändringar i aktiekurser.
| Värdepapper | Aktier (MM) |
Värde (MM$) |
Portfölj % av | ΔPortfölj % av |
|---|---|---|---|---|
| 0,19 | 10,40 | 2,3036 | 2,3036 | |
| 0,03 | 10,22 | 2,2640 | 2,2640 | |
| 0,23 | 9,15 | 2,0270 | 2,0270 | |
| 0,23 | 8,78 | 1,9440 | 1,9440 | |
| 0,29 | 14,56 | 3,2245 | 1,3940 | |
| 0,19 | 9,82 | 2,1743 | 0,8200 | |
| 0,11 | 17,34 | 3,8393 | 0,5075 | |
| 0,24 | 15,31 | 3,3906 | 0,2886 | |
| 0,18 | 11,68 | 2,5870 | 0,2473 | |
| 0,04 | 17,17 | 3,8023 | 0,2325 |
Största minskningarna detta kvartal
Vi använder förändringen i portföljallokeringen eftersom det är det mest meningsfulla måttet. Förändringar kan bero på transaktioner eller förändringar i aktiepriser.
| Värdepapper | Aktier (MM) |
Värde (MM$) |
Portfölj % av | ΔPortfölj % av |
|---|---|---|---|---|
| 0,01 | 0,74 | 0,1641 | −2,3703 | |
| 0,01 | 0,96 | 0,2130 | −1,8316 | |
| 0,01 | 0,98 | 0,2172 | −1,6163 | |
| 0,01 | 0,58 | 0,1284 | −1,3204 | |
| 0,01 | 9,04 | 2,0029 | −0,7977 | |
| 0,29 | 10,80 | 2,3906 | −0,5447 | |
| 0,02 | 16,50 | 3,6530 | −0,5138 | |
| 0,12 | 11,48 | 2,5421 | −0,4219 | |
| 0,18 | 13,90 | 3,0782 | −0,4048 | |
| 0,19 | 11,46 | 2,5374 | −0,3108 |
13F- och fond arkiveringar
Denna blankett lämnades in den 2013-11-06 för rapporteringsperioden 2013-09-30. Klicka på länksymbolen för att se hela transaktionshistoriken.
Uppgradera för att låsa upp premiumdata och exportera till Excel![]() .
.
| Värdepapper | Typ | Genomsnittligt aktiepris | Aktier (MM) |
ΔAktier (%) |
ΔAktier (%) |
Värde ($MM) |
Portfölj (%) |
ΔPortfölj (%) |
|
|---|---|---|---|---|---|---|---|---|---|
| BIIB / Biogen Inc. | 0,07 | −1,53 | 17,41 | 10,17 | 3,8559 | −0,0877 | |||
| CELG / Celgene Corp. | 0,11 | −1,47 | 17,34 | 29,83 | 3,8393 | 0,5075 | |||
| AAPL / Apple Inc. | 0,04 | −0,19 | 17,17 | 20,01 | 3,8023 | 0,2325 | |||
| GOOGL / Alphabet Inc. | 0,02 | −0,72 | 16,50 | −1,22 | 3,6530 | −0,5138 | |||
| GILD / Gilead Sciences, Inc. | 0,24 | 0,43 | 15,31 | 23,16 | 3,3906 | 0,2886 | |||
| META / Meta Platforms, Inc. | 0,29 | −1,70 | 14,56 | 98,47 | 3,2245 | 1,3940 | |||
| FAST / Fastenal Company | 0,29 | −0,37 | 14,55 | 9,37 | 3,2219 | −0,0972 | |||
| AXP / American Express Company | 0,18 | −1,42 | 13,90 | −0,42 | 3,0782 | −0,4048 | |||
| AMZN / Amazon.com, Inc. | 0,04 | −0,68 | 13,40 | 11,82 | 2,9675 | −0,0225 | |||
| EMR / Emerson Electric Co. | 0,20 | −0,97 | 13,16 | 17,48 | 2,9143 | 0,1192 | |||
| WAG / | 0,24 | −0,89 | 12,79 | 20,65 | 2,8324 | 0,1872 | |||
| QCOM / QUALCOMM Incorporated | 0,19 | −1,28 | 12,50 | 8,79 | 2,7686 | −0,0988 | |||
| SBUX / Starbucks Corporation | 0,16 | 1,10 | 12,30 | 18,79 | 2,7248 | 0,1402 | |||
| TRMB / Trimble Inc. | 0,40 | 0,20 | 11,96 | 14,54 | 2,6484 | 0,0431 | |||
| LVS / Las Vegas Sands Corp. | 0,18 | −0,73 | 11,68 | 24,58 | 2,5870 | 0,2473 | |||
| MCD / McDonald's Corporation | 0,12 | −0,57 | 11,48 | −3,37 | 2,5421 | −0,4219 | |||
| ESRX / Express Scripts Holding Co. | 0,19 | 0,28 | 11,46 | 0,38 | 2,5374 | −0,3108 | |||
| SRCL / Stericycle, Inc. | 0,10 | −1,39 | 11,27 | 3,04 | 2,4954 | −0,2331 | |||
| GS / The Goldman Sachs Group, Inc. | 0,07 | −0,74 | 10,89 | 3,82 | 2,4108 | −0,2054 | |||
| KO / The Coca-Cola Company | 0,29 | −2,83 | 10,80 | −8,24 | 2,3906 | −0,5447 | |||
| CERN / Cerner Corp. | 0,20 | −1,42 | 10,63 | 7,83 | 2,3550 | −0,1058 | |||
| LKQ / LKQ Corporation | 0,33 | −0,20 | 10,51 | 23,52 | 2,3273 | 0,2043 | |||
| COST / Costco Wholesale Corporation | 0,09 | −1,65 | 10,50 | 2,44 | 2,3257 | −0,2323 | |||
| DKS / DICK'S Sporting Goods, Inc. | 0,19 | 10,40 | 2,3036 | 2,3036 | |||||
| V / Visa Inc. | 0,05 | −0,51 | 10,37 | 4,03 | 2,2963 | −0,1907 | |||
| FDX / FedEx Corporation | 0,09 | 2,33 | 10,27 | 18,44 | 2,2739 | 0,1108 | |||
| ISRG / Intuitive Surgical, Inc. | 0,03 | 10,22 | 2,2640 | 2,2640 | |||||
| CRM / Salesforce, Inc. | 0,19 | 33,04 | 9,82 | 80,90 | 2,1743 | 0,8200 | |||
| 61166W101 / Monsanto Co. | 0,09 | −1,16 | 9,45 | 4,42 | 2,0932 | −0,1655 | |||
| CVX / Chevron Corporation | 0,08 | −1,10 | 9,44 | 1,54 | 2,0895 | −0,2291 | |||
| 74005P104 / Praxair, Inc. | 0,08 | −0,96 | 9,20 | 3,38 | 2,0379 | −0,1831 | |||
| RHI / Robert Half Inc. | 0,23 | 9,15 | 2,0270 | 2,0270 | |||||
| BKNG / Booking Holdings Inc. | 0,01 | −34,11 | 9,04 | −19,42 | 2,0029 | −0,7977 | |||
| INFA / Informatica Inc. | 0,23 | 8,78 | 1,9440 | 1,9440 | |||||
| EMC / Global X Funds - Global X Emerging Markets Great Consumer ETF | 0,31 | −0,49 | 7,93 | 7,68 | 1,7562 | −0,0813 | |||
| COP / ConocoPhillips | 0,11 | −1,02 | 7,80 | 13,72 | 1,7272 | 0,0159 | |||
| YUM / Yum! Brands, Inc. | 0,07 | 2,84 | 5,31 | 5,88 | 1,1756 | −0,0754 | |||
| TPR / Tapestry, Inc. | 0,10 | −1,77 | 5,20 | −6,18 | 1,1504 | −0,2311 | |||
| XOM / Exxon Mobil Corporation | 0,03 | −1,45 | 2,34 | −6,17 | 0,5186 | −0,1041 | |||
| KMB / Kimberly-Clark Corporation | 0,01 | −1,68 | 1,38 | −4,63 | 0,3056 | −0,0554 | |||
| GSK / GSK plc - Depositary Receipt (Common Stock) | 0,03 | −4,66 | 1,28 | −4,25 | 0,2843 | −0,0503 | |||
| NVS / Novartis AG - Depositary Receipt (Common Stock) | 0,01 | −1,70 | 1,11 | 6,62 | 0,2460 | −0,0140 | |||
| VZ / Verizon Communications Inc. | 0,02 | 5,27 | 1,03 | −2,37 | 0,2283 | −0,0352 | |||
| ABBV / AbbVie Inc. | 0,02 | −1,66 | 1,02 | 6,48 | 0,2256 | −0,0131 | |||
| JNJ / Johnson & Johnson | 0,01 | −6,46 | 1,01 | −5,51 | 0,2241 | −0,0431 | |||
| IBM / International Business Machines Corporation | 0,01 | −86,22 | 0,98 | −86,65 | 0,2172 | −1,6163 | |||
| INTU / Intuit Inc. | 0,01 | −89,19 | 0,96 | −88,26 | 0,2130 | −1,8316 | |||
| FIS / Fidelity National Information Services, Inc. | 0,02 | 0,00 | 0,84 | 8,40 | 0,1858 | −0,0073 | |||
| ABT / Abbott Laboratories | 0,02 | −4,24 | 0,74 | −8,92 | 0,1650 | −0,0391 | |||
| DE / Deere & Company | 0,01 | −92,72 | 0,74 | −92,71 | 0,1641 | −2,3703 | |||
| PG / The Procter & Gamble Company | 0,01 | 0,00 | 0,61 | −1,76 | 0,1357 | −0,0199 | |||
| SYY / Sysco Corporation | 0,02 | 4,43 | 0,60 | −2,59 | 0,1331 | −0,0209 | |||
| CL / Colgate-Palmolive Company | 0,01 | −90,35 | 0,58 | −90,01 | 0,1284 | −1,3204 | |||
| WMT / Walmart Inc. | 0,00 | 0,00 | 0,35 | −0,86 | 0,0766 | −0,0105 | |||
| BMY / Bristol-Myers Squibb Company | 0,01 | −1,99 | 0,32 | 1,59 | 0,0706 | −0,0077 | |||
| CLX / The Clorox Company | 0,00 | 0,00 | 0,25 | −1,59 | 0,0547 | −0,0079 | |||
| APH / Amphenol Corporation | 0,00 | 0,00 | 0,22 | −0,45 | 0,0489 | −0,0065 | |||
| TEG / Integrys Energy Group, Inc. | 0,00 | −10,24 | 0,22 | −14,40 | 0,0487 | −0,0154 | |||
| MRK / Merck & Co., Inc. | 0,00 | −11,43 | 0,21 | −9,21 | 0,0458 | −0,0110 | |||
| UNP / Union Pacific Corporation | 0,00 | 0,00 | 0,20 | 0,49 | 0,0452 | −0,0055 | |||
| NKTR / Nektar Therapeutics | 0,01 | −12,58 | 0,12 | −21,09 | 0,0257 | −0,0110 |