Grundläggande statistik
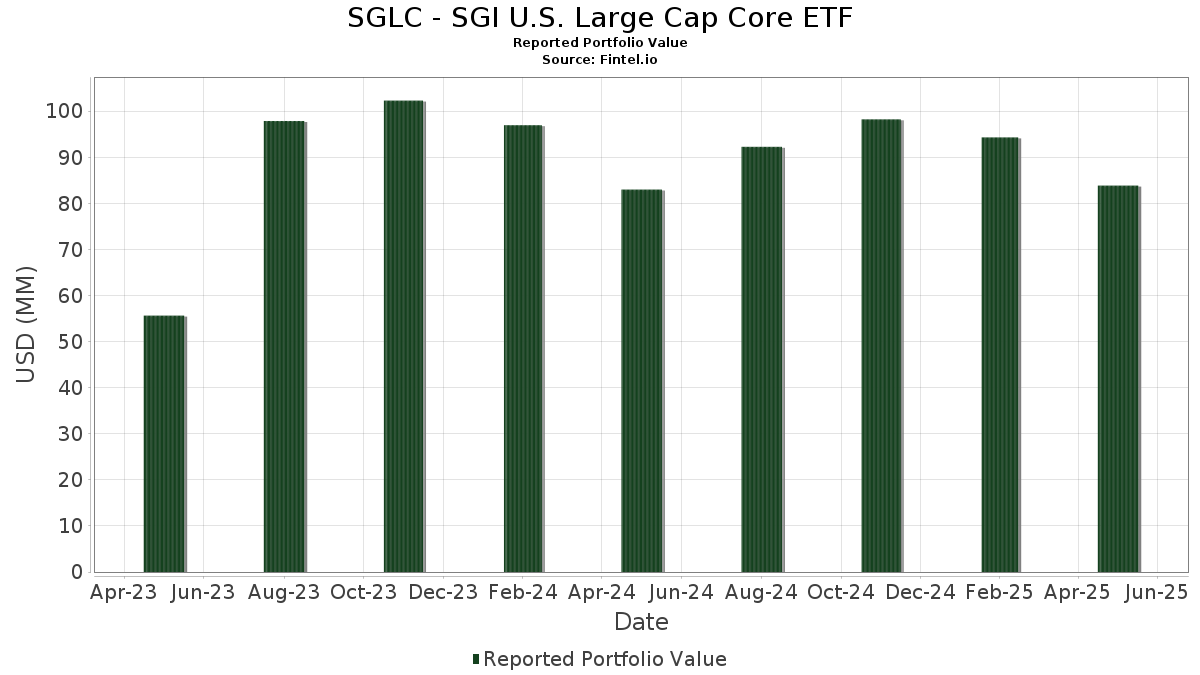
| Portföljvärde | $ 83 855 786 |
| Aktuella positioner | 128 |
Senaste innehav, resultat, förvaltat kapital (från 13F, 13D)
SGLC - SGI U.S. Large Cap Core ETF har redovisat 128 totala innehav i sina senaste SEC-arkiveringar. Det senaste portföljvärdet beräknas vara $ 83 855 786 USD. Faktiskt förvaltade tillgångar (AUM) är detta värde plus likvida medel (som inte redovisas). SGLC - SGI U.S. Large Cap Core ETFs största innehav är NVIDIA Corporation (US:NVDA) , Microsoft Corporation (US:MSFT) , Alphabet Inc. (US:GOOGL) , Meta Platforms, Inc. (US:META) , and Amazon.com, Inc. (US:AMZN) . SGLC - SGI U.S. Large Cap Core ETFs nya positioner inkluderar NiSource Inc. (US:NI) , Expand Energy Corporation (US:EXE) , Verisk Analytics, Inc. (US:VRSK) , VeriSign, Inc. (US:VRSN) , and Aon plc (US:AON) .
Största ökningarna detta kvartal
Vi använder förändringen i portföljallokeringen eftersom det är det mest meningsfulla måttet. Förändringar kan bero på transaktioner eller förändringar i aktiekurser.
| Värdepapper | Aktier (MM) |
Värde (MM$) |
Portfölj % av | ΔPortfölj % av |
|---|---|---|---|---|
| 0,06 | 2,26 | 2,6909 | 2,6909 | |
| 0,00 | 1,78 | 2,1261 | 0,8786 | |
| 0,04 | 5,63 | 6,7174 | 0,8750 | |
| 0,01 | 0,90 | 1,0706 | 0,8590 | |
| 0,01 | 0,65 | 0,7740 | 0,7740 | |
| 0,00 | 0,81 | 0,9647 | 0,7551 | |
| 0,00 | 0,77 | 0,9156 | 0,6951 | |
| 0,00 | 0,45 | 0,5330 | 0,5330 | |
| 0,00 | 0,41 | 0,4847 | 0,4847 | |
| 0,00 | 0,41 | 0,4832 | 0,4832 |
Största minskningarna detta kvartal
Vi använder förändringen i portföljallokeringen eftersom det är det mest meningsfulla måttet. Förändringar kan bero på transaktioner eller förändringar i aktiepriser.
| Värdepapper | Aktier (MM) |
Värde (MM$) |
Portfölj % av | ΔPortfölj % av |
|---|---|---|---|---|
| 0,02 | 3,21 | 3,8333 | −1,9686 | |
| 0,00 | 0,15 | 0,1795 | −1,6994 | |
| 0,00 | 0,28 | 0,3320 | −1,4630 | |
| 0,01 | 2,65 | 3,1608 | −1,3612 | |
| 0,00 | 1,78 | 2,1232 | −1,3054 | |
| 0,00 | 0,47 | 0,5629 | −0,9597 | |
| 0,00 | 0,31 | 0,3708 | −0,9208 | |
| 0,00 | 0,00 | −0,7100 | ||
| 0,01 | 2,03 | 2,4238 | −0,6675 | |
| 0,00 | 0,17 | 0,1991 | −0,6216 |
13F- och fond arkiveringar
Denna blankett lämnades in den 2025-07-29 för rapporteringsperioden 2025-05-31. Klicka på länksymbolen för att se hela transaktionshistoriken.
Uppgradera för att låsa upp premiumdata och exportera till Excel![]() .
.
| Värdepapper | Typ | Genomsnittligt aktiepris | Aktier (MM) |
ΔAktier (%) |
ΔAktier (%) |
Värde ($MM) |
Portfölj (%) |
ΔPortfölj (%) |
|
|---|---|---|---|---|---|---|---|---|---|
| NVDA / NVIDIA Corporation | 0,04 | −5,50 | 5,63 | 2,23 | 6,7174 | 0,8750 | |||
| MSFT / Microsoft Corporation | 0,01 | −22,26 | 4,90 | −9,86 | 5,8455 | 0,0807 | |||
| GOOGL / Alphabet Inc. | 0,02 | −19,05 | 4,05 | −18,36 | 4,8328 | −0,4297 | |||
| META / Meta Platforms, Inc. | 0,01 | −11,67 | 3,73 | −14,41 | 4,4490 | −0,1720 | |||
| AMZN / Amazon.com, Inc. | 0,02 | −39,18 | 3,21 | −41,26 | 3,8333 | −1,9686 | |||
| AAPL / Apple Inc. | 0,01 | −25,17 | 2,65 | −37,87 | 3,1608 | −1,3612 | |||
| MA / Mastercard Incorporated | 0,00 | −11,29 | 2,53 | −9,85 | 3,0112 | 0,0412 | |||
| NI / NiSource Inc. | 0,06 | 2,26 | 2,6909 | 2,6909 | |||||
| CL / Colgate-Palmolive Company | 0,02 | −2,72 | 2,25 | −0,84 | 2,6788 | 0,2773 | |||
| QCOM / QUALCOMM Incorporated | 0,01 | −24,55 | 2,03 | −30,29 | 2,4238 | −0,6675 | |||
| HD / The Home Depot, Inc. | 0,00 | 63,16 | 1,78 | 51,53 | 2,1261 | 0,8786 | |||
| BRK.B / Berkshire Hathaway Inc. | 0,00 | −43,87 | 1,78 | −44,96 | 2,1232 | −1,3054 | |||
| BKNG / Booking Holdings Inc. | 0,00 | −13,66 | 1,53 | −5,02 | 1,8296 | 0,1173 | |||
| PNC / The PNC Financial Services Group, Inc. | 0,01 | 9,61 | 1,49 | −0,73 | 1,7821 | 0,1861 | |||
| JPM / JPMorgan Chase & Co. | 0,00 | 31,80 | 1,22 | 31,46 | 1,4510 | 0,4698 | |||
| AVGO / Broadcom Inc. | 0,00 | −6,32 | 1,17 | 13,74 | 1,3917 | 0,3036 | |||
| ANET / Arista Networks Inc | 0,01 | 1,97 | 1,15 | −5,05 | 1,3668 | 0,0869 | |||
| TSN / Tyson Foods, Inc. | 0,02 | −23,77 | 1,07 | −30,21 | 1,2813 | −0,3509 | |||
| CBRE / CBRE Group, Inc. | 0,01 | −9,76 | 0,93 | −20,50 | 1,1107 | −0,1317 | |||
| LRCX / Lam Research Corporation | 0,01 | −6,07 | 0,93 | −1,07 | 1,1072 | 0,1117 | |||
| UHS / Universal Health Services, Inc. | 0,00 | −19,22 | 0,93 | −12,22 | 1,1057 | −0,0147 | |||
| BAC / Bank of America Corporation | 0,02 | 2,50 | 0,91 | −1,83 | 1,0859 | 0,1020 | |||
| FI / Fiserv, Inc. | 0,01 | 551,12 | 0,90 | 350,75 | 1,0706 | 0,8590 | |||
| LMT / Lockheed Martin Corporation | 0,00 | −22,60 | 0,82 | −12,81 | 0,9750 | 0,0085 | |||
| ADSK / Autodesk, Inc. | 0,00 | 278,92 | 0,81 | 310,15 | 0,9647 | 0,7551 | |||
| APH / Amphenol Corporation | 0,01 | 2,01 | 0,80 | 37,76 | 0,9529 | 0,3379 | |||
| UNP / Union Pacific Corporation | 0,00 | −24,63 | 0,78 | −32,31 | 0,9251 | −0,2894 | |||
| TMUS / T-Mobile US, Inc. | 0,00 | 261,46 | 0,77 | 255,09 | 0,9156 | 0,6951 | |||
| ECL / Ecolab Inc. | 0,00 | −12,20 | 0,75 | −6,29 | 0,8888 | 0,0796 | |||
| COST / Costco Wholesale Corporation | 0,00 | 54,46 | 0,72 | 53,30 | 0,8584 | 0,3603 | |||
| GLW / Corning Incorporated | 0,01 | 47,70 | 0,71 | 46,20 | 0,8498 | 0,3325 | |||
| NOC / Northrop Grumman Corporation | 0,00 | −19,67 | 0,65 | −15,67 | 0,7769 | −0,0420 | |||
| FOX / Fox Corporation | 0,01 | −6,03 | 0,65 | −12,53 | 0,7741 | −0,0134 | |||
| EXE / Expand Energy Corporation | 0,01 | 0,65 | 0,7740 | 0,7740 | |||||
| ABBV / AbbVie Inc. | 0,00 | 156,92 | 0,57 | 143,83 | 0,6842 | 0,4290 | |||
| BX / Blackstone Inc. | 0,00 | 200,37 | 0,57 | 159,09 | 0,6799 | 0,4462 | |||
| ZBRA / Zebra Technologies Corporation | 0,00 | 7,76 | 0,55 | −0,91 | 0,6527 | 0,0672 | |||
| MRK / Merck & Co., Inc. | 0,01 | −31,41 | 0,54 | −42,95 | 0,6425 | −0,3573 | |||
| VRTX / Vertex Pharmaceuticals Incorporated | 0,00 | −7,85 | 0,53 | −15,09 | 0,6310 | −0,0298 | |||
| ALL / The Allstate Corporation | 0,00 | −56,30 | 0,53 | −53,94 | 0,6274 | −0,5839 | |||
| FCX / Freeport-McMoRan Inc. | 0,01 | 179,10 | 0,52 | 192,18 | 0,6243 | 0,4336 | |||
| ADBE / Adobe Inc. | 0,00 | −16,78 | 0,51 | −21,23 | 0,6113 | −0,0787 | |||
| KEYS / Keysight Technologies, Inc. | 0,00 | 106,70 | 0,51 | 138,50 | 0,6069 | 0,3990 | |||
| PKG / Packaging Corporation of America | 0,00 | 212,89 | 0,51 | 184,27 | 0,6040 | 0,4147 | |||
| TT / Trane Technologies plc | 0,00 | −17,31 | 0,49 | 0,61 | 0,5860 | 0,0681 | |||
| AMGN / Amgen Inc. | 0,00 | −16,46 | 0,48 | −21,90 | 0,5705 | −0,0785 | |||
| UNH / UnitedHealth Group Incorporated | 0,00 | 360,41 | 0,47 | 193,79 | 0,5652 | 0,3935 | |||
| UPS / United Parcel Service, Inc. | 0,00 | −59,89 | 0,47 | −67,20 | 0,5629 | −0,9597 | |||
| ETR / Entergy Corporation | 0,01 | −7,90 | 0,47 | −12,17 | 0,5595 | −0,0067 | |||
| ISRG / Intuitive Surgical, Inc. | 0,00 | −49,18 | 0,46 | −51,06 | 0,5506 | −0,4489 | |||
| ICE / Intercontinental Exchange, Inc. | 0,00 | 0,45 | 0,5330 | 0,5330 | |||||
| 8AMMF0A92 / US Bank MM Deposit Account Global Fund | 0,44 | 843,97 | 0,44 | 844,68 | 0,5295 | 0,4796 | |||
| PEP / PepsiCo, Inc. | 0,00 | 308,48 | 0,44 | 212,14 | 0,5212 | 0,3517 | |||
| INCY / Incyte Corporation | 0,01 | 161,48 | 0,43 | 132,09 | 0,5187 | 0,3195 | |||
| VRSK / Verisk Analytics, Inc. | 0,00 | 0,41 | 0,4847 | 0,4847 | |||||
| VRSN / VeriSign, Inc. | 0,00 | 0,41 | 0,4832 | 0,4832 | |||||
| HLT / Hilton Worldwide Holdings Inc. | 0,00 | 119,24 | 0,40 | 105,67 | 0,4761 | 0,2702 | |||
| PLTR / Palantir Technologies Inc. | 0,00 | −2,61 | 0,39 | 51,54 | 0,4700 | 0,1935 | |||
| ADP / Automatic Data Processing, Inc. | 0,00 | −13,16 | 0,39 | −10,39 | 0,4635 | 0,0041 | |||
| GILD / Gilead Sciences, Inc. | 0,00 | 44,27 | 0,38 | 38,91 | 0,4564 | 0,1644 | |||
| AON / Aon plc | 0,00 | 0,37 | 0,4424 | 0,4424 | |||||
| DIS / The Walt Disney Company | 0,00 | −10,19 | 0,35 | −10,86 | 0,4217 | 0,0014 | |||
| CRM / Salesforce, Inc. | 0,00 | −11,46 | 0,34 | −21,02 | 0,4082 | −0,0519 | |||
| COP / ConocoPhillips | 0,00 | 8,93 | 0,34 | −6,09 | 0,4046 | 0,0210 | |||
| NOW / ServiceNow, Inc. | 0,00 | −54,68 | 0,34 | −50,80 | 0,4027 | −0,3238 | |||
| CNC / Centene Corporation | 0,01 | 133,07 | 0,33 | 66,67 | 0,3947 | 0,1798 | |||
| NEM / Newmont Corporation | 0,01 | −17,62 | 0,33 | 1,25 | 0,3887 | 0,0478 | |||
| VOO / Vanguard Index Funds - Vanguard S&P 500 ETF | 0,00 | −74,26 | 0,31 | −74,55 | 0,3708 | −0,9208 | |||
| YUM / Yum! Brands, Inc. | 0,00 | −26,20 | 0,31 | −17,30 | 0,3651 | −0,3011 | |||
| GM / General Motors Company | 0,01 | −9,52 | 0,30 | −8,51 | 0,3591 | 0,0097 | |||
| MS / Morgan Stanley | 0,00 | −2,69 | 0,29 | −6,43 | 0,3476 | 0,0174 | |||
| SPGI / S&P Global Inc. | 0,00 | −4,33 | 0,28 | −7,82 | 0,3376 | 0,0111 | |||
| PGR / The Progressive Corporation | 0,00 | −85,10 | 0,28 | −84,23 | 0,3320 | −1,4630 | |||
| CCL / Carnival Corporation & plc | 0,01 | −61,57 | 0,27 | −62,69 | 0,3211 | −0,4443 | |||
| PG / The Procter & Gamble Company | 0,00 | 23,14 | 0,26 | 32,00 | 0,3148 | 0,1081 | |||
| WAB / Westinghouse Air Brake Technologies Corporation | 0,00 | 0,26 | 0,3110 | 0,3110 | |||||
| FANG / Diamondback Energy, Inc. | 0,00 | 14,43 | 0,26 | −2,99 | 0,3105 | 0,0255 | |||
| SPG / Simon Property Group, Inc. | 0,00 | −7,15 | 0,23 | −18,88 | 0,2777 | −0,0257 | |||
| KLAC / KLA Corporation | 0,00 | 6,60 | 0,23 | 13,73 | 0,2771 | 0,0607 | |||
| ORLY / O'Reilly Automotive, Inc. | 0,00 | 26,32 | 0,23 | 84,68 | 0,2740 | 0,1465 | |||
| AMAT / Applied Materials, Inc. | 0,00 | −4,87 | 0,23 | −5,76 | 0,2738 | 0,0158 | |||
| LOW / Lowe's Companies, Inc. | 0,00 | 3,54 | 0,22 | −2,68 | 0,2600 | 0,0286 | |||
| NFLX / Netflix, Inc. | 0,00 | −40,20 | 0,21 | −26,55 | 0,2548 | −0,0529 | |||
| DHR / Danaher Corporation | 0,00 | 38,95 | 0,21 | 4,46 | 0,2520 | 0,0431 | |||
| HCA / HCA Healthcare, Inc. | 0,00 | −24,73 | 0,21 | −6,22 | 0,2520 | 0,0130 | |||
| C / Citigroup Inc. | 0,00 | −1,91 | 0,21 | −7,52 | 0,2493 | 0,0095 | |||
| GEV / GE Vernova Inc. | 0,00 | 0,21 | 0,2476 | 0,2476 | |||||
| MU / Micron Technology, Inc. | 0,00 | 0,20 | 0,2430 | 0,2430 | |||||
| FDX / FedEx Corporation | 0,00 | 39,10 | 0,20 | 0,00 | 0,2406 | 0,0357 | |||
| EQIX / Equinix, Inc. | 0,00 | −10,44 | 0,20 | −12,00 | 0,2364 | −0,0024 | |||
| WELL / Welltower Inc. | 0,00 | −11,36 | 0,19 | −10,95 | 0,2239 | 0,0004 | |||
| BSX / Boston Scientific Corporation | 0,00 | 0,18 | 0,2205 | 0,2205 | |||||
| RL / Ralph Lauren Corporation | 0,00 | −9,93 | 0,18 | −8,04 | 0,2185 | 0,0072 | |||
| URI / United Rentals, Inc. | 0,00 | 0,18 | 0,2171 | 0,2171 | |||||
| STT / State Street Corporation | 0,00 | −22,37 | 0,18 | 1,69 | 0,2160 | 0,0319 | |||
| FTNT / Fortinet, Inc. | 0,00 | −1,60 | 0,18 | −7,18 | 0,2159 | 0,0089 | |||
| CTAS / Cintas Corporation | 0,00 | −14,01 | 0,18 | −6,25 | 0,2155 | 0,0114 | |||
| CPAY / Corpay, Inc. | 0,00 | 3,18 | 0,18 | −8,67 | 0,2140 | 0,0058 | |||
| AXP / American Express Company | 0,00 | −22,29 | 0,18 | −25,10 | 0,2139 | −0,0295 | |||
| TJX / The TJX Companies, Inc. | 0,00 | −17,05 | 0,18 | −15,64 | 0,2128 | −0,0114 | |||
| GDDY / GoDaddy Inc. | 0,00 | −3,24 | 0,17 | −2,26 | 0,2074 | 0,0196 | |||
| MTB / M&T Bank Corporation | 0,00 | 0,17 | 0,2073 | 0,2073 | |||||
| ZTS / Zoetis Inc. | 0,00 | 0,17 | 0,2069 | 0,2069 | |||||
| ADI / Analog Devices, Inc. | 0,00 | 40,84 | 0,17 | 70,30 | 0,2059 | 0,0230 | |||
| NEE / NextEra Energy, Inc. | 0,00 | −13,21 | 0,17 | −12,69 | 0,2053 | −0,0036 | |||
| CAT / Caterpillar Inc. | 0,00 | 0,17 | 0,2050 | 0,2050 | |||||
| AMP / Ameriprise Financial, Inc. | 0,00 | −26,16 | 0,17 | −30,17 | 0,2022 | −0,0547 | |||
| MCO / Moody's Corporation | 0,00 | −38,93 | 0,17 | −19,52 | 0,2018 | −0,0041 | |||
| UAL / United Airlines Holdings, Inc. | 0,00 | −50,41 | 0,17 | −57,96 | 0,2017 | −0,2253 | |||
| KMB / Kimberly-Clark Corporation | 0,00 | −42,79 | 0,17 | −42,07 | 0,2006 | −0,1073 | |||
| MPWR / Monolithic Power Systems, Inc. | 0,00 | −48,48 | 0,17 | −44,19 | 0,2005 | −0,1189 | |||
| WMT / Walmart Inc. | 0,00 | −78,46 | 0,17 | −78,55 | 0,1991 | −0,6216 | |||
| USB / U.S. Bancorp | 0,00 | −1,89 | 0,17 | −8,84 | 0,1973 | 0,0049 | |||
| GD / General Dynamics Corporation | 0,00 | −17,83 | 0,16 | −16,33 | 0,1959 | −0,0062 | |||
| MMC / Marsh & McLennan Companies, Inc. | 0,00 | −16,55 | 0,16 | −18,09 | 0,1953 | −0,0165 | |||
| TRGP / Targa Resources Corp. | 0,00 | 11,16 | 0,16 | −13,30 | 0,1951 | −0,0042 | |||
| DXCM / DexCom, Inc. | 0,00 | −13,36 | 0,16 | −16,06 | 0,1938 | −0,0110 | |||
| SYY / Sysco Corporation | 0,00 | −13,33 | 0,16 | −16,67 | 0,1919 | −0,0118 | |||
| MSCI / MSCI Inc. | 0,00 | −6,56 | 0,16 | −11,11 | 0,1917 | 0,0007 | |||
| CMG / Chipotle Mexican Grill, Inc. | 0,00 | 6 284,00 | 0,16 | 1,92 | 0,1906 | 0,0021 | |||
| REGN / Regeneron Pharmaceuticals, Inc. | 0,00 | −10,17 | 0,16 | −37,25 | 0,1859 | −0,0763 | |||
| DVN / Devon Energy Corporation | 0,01 | −37,07 | 0,16 | −61,15 | 0,1849 | −0,2965 | |||
| MSI / Motorola Solutions, Inc. | 0,00 | −2,87 | 0,15 | −8,33 | 0,1843 | 0,0055 | |||
| OKE / ONEOK, Inc. | 0,00 | 3,84 | 0,15 | −16,39 | 0,1827 | −0,0116 | |||
| KIM / Kimco Realty Corporation | 0,01 | −16,18 | 0,15 | −19,68 | 0,1809 | −0,0185 | |||
| LLY / Eli Lilly and Company | 0,00 | −89,40 | 0,15 | −91,53 | 0,1795 | −1,6994 | |||
| ELV / Elevance Health, Inc. | 0,00 | −52,88 | 0,15 | −55,59 | 0,1758 | −0,1618 | |||
| LDOS / Leidos Holdings, Inc. | 0,00 | −25,34 | 0,14 | −15,00 | 0,1633 | −0,0069 | |||
| CMCSA / Comcast Corporation | 0,00 | −100,00 | 0,00 | −100,00 | −0,3621 | ||||
| FICO / Fair Isaac Corporation | 0,00 | −100,00 | 0,00 | −100,00 | −0,7100 | ||||
| ROP / Roper Technologies, Inc. | 0,00 | −100,00 | 0,00 | −100,00 | −0,2262 | ||||
| KMI / Kinder Morgan, Inc. | 0,00 | −100,00 | 0,00 | −100,00 | −0,3576 |