Grundläggande statistik
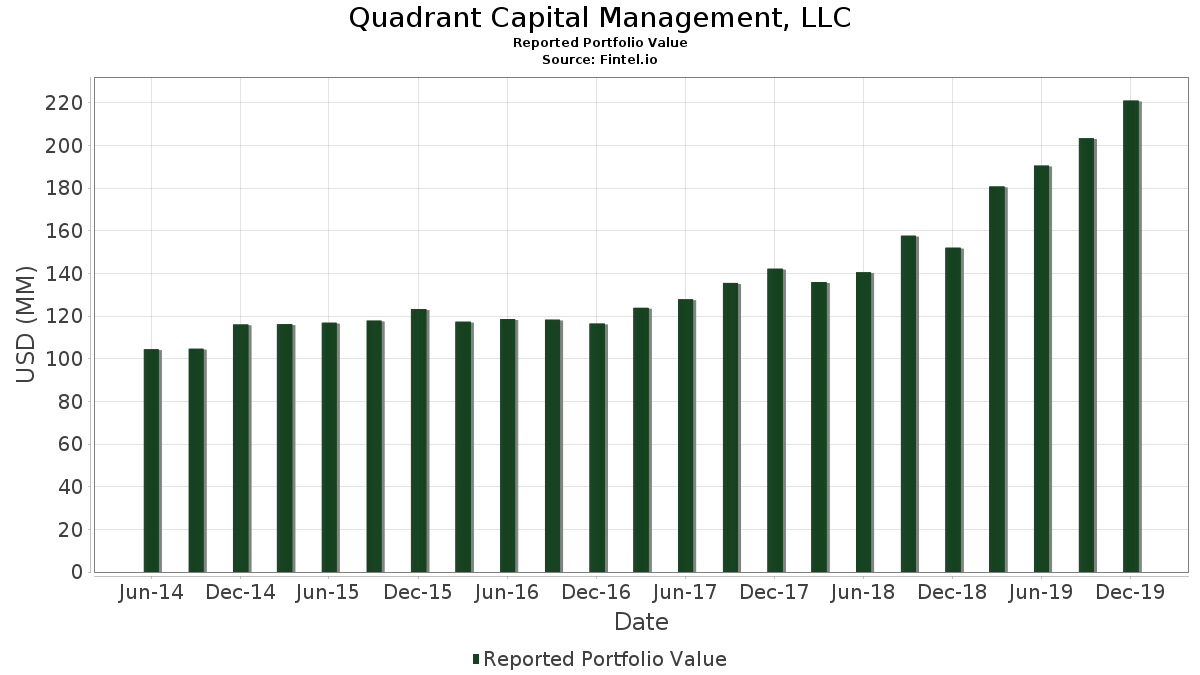
| Portföljvärde | $ 221 033 000 |
| Aktuella positioner | 86 |
Senaste innehav, resultat, förvaltat kapital (från 13F, 13D)
Quadrant Capital Management, LLC har redovisat 86 totala innehav i sina senaste SEC-arkiveringar. Det senaste portföljvärdet beräknas vara $ 221 033 000 USD. Faktiskt förvaltade tillgångar (AUM) är detta värde plus likvida medel (som inte redovisas). Quadrant Capital Management, LLCs största innehav är Schwab Strategic Trust - Schwab International Equity ETF (US:SCHF) , Apple Inc. (US:AAPL) , Vanguard International Equity Index Funds - Vanguard FTSE All-World ex-US Small-Cap ETF (US:VSS) , iShares, Inc. - iShares Core MSCI Emerging Markets ETF (US:IEMG) , and Alphabet Inc. (US:GOOG) . Quadrant Capital Management, LLCs nya positioner inkluderar VICI Properties Inc. (US:VICI) , Brookfield Asset Management Ltd. (US:BAM) , Peapack-Gladstone Financial Corporation (US:PGC) , Citigroup, Inc. (US:C.WSA) , and .
Största ökningarna detta kvartal
Vi använder förändringen i portföljallokeringen eftersom det är det mest meningsfulla måttet. Förändringar kan bero på transaktioner eller förändringar i aktiekurser.
| Värdepapper | Aktier (MM) |
Värde (MM$) |
Portfölj % av | ΔPortfölj % av |
|---|---|---|---|---|
| 0,04 | 2,98 | 1,3464 | 1,0873 | |
| 0,05 | 1,65 | 0,7442 | 0,7442 | |
| 0,06 | 1,64 | 0,7415 | 0,7415 | |
| 0,02 | 1,31 | 0,5909 | 0,5909 | |
| 0,02 | 4,50 | 2,0345 | 0,4066 | |
| 0,03 | 8,22 | 3,7189 | 0,3948 | |
| 0,02 | 0,71 | 0,3226 | 0,3226 | |
| 0,01 | 0,69 | 0,3135 | 0,3135 | |
| 0,04 | 2,42 | 1,0944 | 0,2689 | |
| 0,04 | 2,28 | 1,0333 | 0,1429 |
Största minskningarna detta kvartal
Vi använder förändringen i portföljallokeringen eftersom det är det mest meningsfulla måttet. Förändringar kan bero på transaktioner eller förändringar i aktiepriser.
| Värdepapper | Aktier (MM) |
Värde (MM$) |
Portfölj % av | ΔPortfölj % av |
|---|---|---|---|---|
| 0,04 | 4,91 | 2,2209 | −2 320 148,0308 | |
| 0,00 | 0,00 | −0,4813 | ||
| 0,02 | 4,14 | 1,8753 | −0,3913 | |
| 0,00 | 0,00 | −0,3663 | ||
| 0,04 | 3,18 | 1,4369 | −0,2825 | |
| 0,05 | 3,23 | 1,4627 | −0,2508 | |
| 0,00 | 1,57 | 0,7112 | −0,1915 | |
| 0,02 | 2,86 | 1,2930 | −0,1874 | |
| 0,01 | 3,58 | 1,6188 | −0,1822 | |
| 0,00 | 0,00 | −0,1809 |
13F- och fond arkiveringar
Denna blankett lämnades in den 2020-01-29 för rapporteringsperioden 2019-12-31. Klicka på länksymbolen för att se hela transaktionshistoriken.
Uppgradera för att låsa upp premiumdata och exportera till Excel![]() .
.
| Värdepapper | Typ | Genomsnittligt aktiepris | Aktier (MM) |
ΔAktier (%) |
ΔAktier (%) |
Värde ($MM) |
Portfölj (%) |
ΔPortfölj (%) |
|
|---|---|---|---|---|---|---|---|---|---|
| SCHF / Schwab Strategic Trust - Schwab International Equity ETF | 0,32 | 2,09 | 10,71 | 7,76 | 4,8436 | −0,0410 | |||
| AAPL / Apple Inc. | 0,03 | −7,27 | 8,22 | 21,58 | 3,7189 | 0,3948 | |||
| VSS / Vanguard International Equity Index Funds - Vanguard FTSE All-World ex-US Small-Cap ETF | 0,07 | 0,57 | 7,34 | 9,59 | 3,3203 | 0,0277 | |||
| IEMG / iShares, Inc. - iShares Core MSCI Emerging Markets ETF | 0,11 | 2,11 | 6,08 | 11,98 | 2,7521 | 0,0814 | |||
| GOOG / Alphabet Inc. | 0,00 | 0,34 | 5,16 | 10,05 | 2,3340 | 0,0291 | |||
| XLY / The Select Sector SPDR Trust - The Consumer Discretionary Select Sector SPDR Fund | 0,04 | −0,35 | 5,05 | 3,54 | 2,2865 | −0,1133 | |||
| VSIIX / Vanguard Index Funds - Vanguard Small-Cap Value Index Fund Institutional | 0,04 | −2,20 | 4,91 | 4,03 | 2,2209 | −2 320 148,0308 | |||
| BDX / Becton, Dickinson and Company | 0,02 | 0,25 | 4,91 | 7,78 | 2,2196 | −0,0185 | |||
| UNH / UnitedHealth Group Incorporated | 0,02 | 0,39 | 4,50 | 35,82 | 2,0345 | 0,4066 | |||
| ACN / Accenture plc | 0,02 | 0,50 | 4,48 | 10,04 | 2,0282 | 0,0252 | |||
| V / Visa Inc. | 0,02 | −6,96 | 4,48 | 1,63 | 2,0268 | −0,1404 | |||
| HD / The Home Depot, Inc. | 0,02 | −4,47 | 4,14 | −10,09 | 1,8753 | −0,3913 | |||
| TMO / Thermo Fisher Scientific Inc. | 0,01 | 0,02 | 4,01 | 11,57 | 1,8156 | 0,0471 | |||
| PNC / The PNC Financial Services Group, Inc. | 0,02 | 0,35 | 3,89 | 14,30 | 1,7608 | 0,0867 | |||
| JPM / JPMorgan Chase & Co. | 0,03 | −0,47 | 3,70 | 17,92 | 1,6735 | 0,1312 | |||
| META / Meta Platforms, Inc. | 0,02 | −1,02 | 3,63 | 14,08 | 1,6418 | 0,0779 | |||
| MSFT / Microsoft Corporation | 0,02 | −1,38 | 3,61 | 11,84 | 1,6323 | 0,0462 | |||
| COST / Costco Wholesale Corporation | 0,01 | −4,25 | 3,58 | −2,32 | 1,6188 | −0,1822 | |||
| CMCSA / Comcast Corporation | 0,08 | −1,49 | 3,54 | −1,72 | 1,6029 | −0,1695 | |||
| VOE / Vanguard Index Funds - Vanguard Mid-Cap Value ETF | 0,03 | 6,63 | 3,49 | 12,44 | 1,5789 | 0,0528 | |||
| XLF / The Select Sector SPDR Trust - The Financial Select Sector SPDR Fund | 0,11 | 0,00 | 3,46 | 9,94 | 1,5667 | 0,0180 | |||
| MDT / Medtronic plc | 0,03 | 0,30 | 3,46 | 4,75 | 1,5663 | −0,0587 | |||
| BXP / Boston Properties, Inc. | 0,02 | 2,45 | 3,42 | 8,94 | 1,5495 | 0,0038 | |||
| CHD / Church & Dwight Co., Inc. | 0,05 | −0,78 | 3,23 | −7,23 | 1,4627 | −0,2508 | |||
| CCI / Crown Castle Inc. | 0,02 | 0,87 | 3,22 | 3,17 | 1,4572 | −0,0777 | |||
| WELL / Welltower Inc. | 0,04 | 0,68 | 3,18 | −9,18 | 1,4369 | −0,2825 | |||
| O / Realty Income Corporation | 0,04 | 1,64 | 3,08 | −2,41 | 1,3939 | −0,1583 | |||
| AER / AerCap Holdings N.V. | 0,05 | 0,09 | 3,07 | 12,40 | 1,3898 | 0,0461 | |||
| NVS / Novartis AG - Depositary Receipt (Common Stock) | 0,03 | 2,69 | 3,05 | 11,92 | 1,3803 | 0,0401 | |||
| CVX / Chevron Corporation | 0,03 | −0,98 | 3,02 | 0,60 | 1,3659 | −0,1096 | |||
| NKE / NIKE, Inc. | 0,03 | −1,24 | 2,99 | 6,56 | 1,3532 | −0,0269 | |||
| XOM / Exxon Mobil Corporation | 0,04 | 471,12 | 2,98 | 464,71 | 1,3464 | 1,0873 | |||
| ORCL / Oracle Corporation | 0,06 | 0,00 | 2,97 | −3,72 | 1,3450 | −0,1732 | |||
| T / AT&T Inc. | 0,08 | 0,88 | 2,94 | 4,18 | 1,3297 | −0,0573 | |||
| GD / General Dynamics Corporation | 0,02 | −1,64 | 2,86 | −5,08 | 1,2930 | −0,1874 | |||
| TJX / The TJX Companies, Inc. | 0,05 | 0,27 | 2,82 | 9,81 | 1,2758 | 0,0132 | |||
| AMT / American Tower Corporation | 0,01 | 5,23 | 2,73 | 9,38 | 1,2347 | 0,0080 | |||
| BAC / Bank of America Corporation | 0,08 | −0,30 | 2,67 | 20,36 | 1,2062 | 0,1171 | |||
| ARE / Alexandria Real Estate Equities, Inc. | 0,02 | 1,80 | 2,58 | 6,77 | 1,1695 | −0,0208 | |||
| ESS / Essex Property Trust, Inc. | 0,01 | 4,45 | 2,54 | −3,78 | 1,1505 | −0,1490 | |||
| SPG / Simon Property Group, Inc. | 0,02 | −1,52 | 2,52 | −5,75 | 1,1419 | −0,1748 | |||
| BMY / Bristol-Myers Squibb Company | 0,04 | 13,86 | 2,42 | 44,07 | 1,0944 | 0,2689 | |||
| HCC / Warrior Met Coal, Inc. | 0,02 | 3,11 | 2,39 | 4,60 | 1,0799 | −0,0420 | |||
| RTX / RTX Corporation | 0,02 | −0,65 | 2,29 | 8,98 | 1,0374 | 0,0029 | |||
| AMAT / Applied Materials, Inc. | 0,04 | 3,09 | 2,28 | 26,12 | 1,0333 | 0,1429 | |||
| APD / Air Products and Chemicals, Inc. | 0,01 | 0,19 | 2,28 | 6,10 | 1,0302 | −0,0249 | |||
| WM / Waste Management, Inc. | 0,02 | 3,12 | 2,21 | 2,17 | 0,9989 | −0,0635 | |||
| PLD / Prologis, Inc. | 0,02 | 2,75 | 2,21 | 7,45 | 0,9980 | −0,0113 | |||
| PYPL / PayPal Holdings, Inc. | 0,02 | 0,54 | 2,12 | 5,01 | 0,9582 | −0,0335 | |||
| HON / Honeywell International Inc. | 0,01 | 0,67 | 2,12 | 5,32 | 0,9578 | −0,0305 | |||
| CMI / Cummins Inc. | 0,01 | 14,94 | 2,10 | 26,43 | 0,9501 | 0,1334 | |||
| BKNG / Booking Holdings Inc. | 0,00 | 0,80 | 2,08 | 5,47 | 0,9419 | −0,0286 | |||
| DLR / Digital Realty Trust, Inc. | 0,02 | 3,42 | 2,04 | −4,58 | 0,9234 | −0,1283 | |||
| FR / First Industrial Realty Trust, Inc. | 0,05 | 1,63 | 1,97 | 6,66 | 0,8908 | −0,0168 | |||
| CHKP / Check Point Software Technologies Ltd. | 0,02 | −8,04 | 1,97 | −6,82 | 0,8895 | −0,1479 | |||
| IRM / Iron Mountain Incorporated | 0,05 | 2,13 | 1,75 | 0,52 | 0,7908 | −0,0642 | |||
| EXR / Extra Space Storage Inc. | 0,02 | 2,21 | 1,74 | −7,61 | 0,7854 | −0,1384 | |||
| CUBE / CubeSmart | 0,05 | 3,85 | 1,67 | −6,33 | 0,7560 | −0,1211 | |||
| HTA / Healthcare Realty Trust Inc - Class A | 0,05 | 2,70 | 1,65 | 5,86 | 0,7442 | 0,7442 | |||
| VICI / VICI Properties Inc. | 0,06 | 1,64 | 0,7415 | 0,7415 | |||||
| BA / The Boeing Company | 0,00 | 0,00 | 1,57 | −14,38 | 0,7112 | −0,1915 | |||
| AVY / Avery Dennison Corporation | 0,01 | 6,88 | 1,51 | 23,09 | 0,6850 | 0,0802 | |||
| STAG / STAG Industrial, Inc. | 0,05 | 4,68 | 1,42 | 12,13 | 0,6442 | 0,0198 | |||
| BAM / Brookfield Asset Management Ltd. | 0,02 | 1,31 | 0,5909 | 0,5909 | |||||
| IWN / iShares Trust - iShares Russell 2000 Value ETF | 0,01 | −0,25 | 1,30 | 7,46 | 0,5863 | −0,0066 | |||
| IWM / iShares Trust - iShares Russell 2000 ETF | 0,01 | 0,20 | 1,25 | 9,67 | 0,5642 | 0,0052 | |||
| VNQ / Vanguard Specialized Funds - Vanguard Real Estate ETF | 0,01 | 10,66 | 1,20 | 10,16 | 0,5447 | 0,0073 | |||
| VB / Vanguard Index Funds - Vanguard Small-Cap ETF | 0,01 | 0,00 | 1,11 | 7,59 | 0,5004 | −0,0051 | |||
| IWD / iShares Trust - iShares Russell 1000 Value ETF | 0,01 | 0,00 | 1,06 | 6,44 | 0,4787 | −0,0100 | |||
| EFV / iShares Trust - iShares MSCI EAFE Value ETF | 0,02 | 0,00 | 1,00 | 5,35 | 0,4547 | −0,0144 | |||
| EFA / iShares Trust - iShares MSCI EAFE ETF | 0,01 | 0,00 | 0,91 | 6,43 | 0,4122 | −0,0087 | |||
| GILD / Gilead Sciences, Inc. | 0,01 | −0,45 | 0,72 | 1,97 | 0,3271 | −0,0215 | |||
| PGC / Peapack-Gladstone Financial Corporation | 0,02 | 0,71 | 0,3226 | 0,3226 | |||||
| JPST / J.P. Morgan Exchange-Traded Fund Trust - JPMorgan Ultra-Short Income ETF | 0,01 | 46,85 | 0,69 | 46,82 | 0,3135 | 0,3135 | |||
| IWF / iShares Trust - iShares Russell 1000 Growth ETF | 0,00 | −0,27 | 0,65 | 9,83 | 0,2932 | 0,0031 | |||
| CSCO / Cisco Systems, Inc. | 0,01 | −24,82 | 0,49 | −27,08 | 0,2217 | −0,1087 | |||
| LORL / Loral Space & Communications Inc | 0,01 | 0,00 | 0,45 | −21,91 | 0,2031 | −0,0796 | |||
| EEM / iShares, Inc. - iShares MSCI Emerging Markets ETF | 0,01 | 0,00 | 0,39 | 9,86 | 0,1764 | 0,0019 | |||
| ALC / Alcon Inc. | 0,01 | 0,00 | 0,31 | −2,80 | 0,1416 | −0,0167 | |||
| SCHX / Schwab Strategic Trust - Schwab U.S. Large-Cap ETF | 0,00 | 0,26 | 0,29 | 8,58 | 0,1317 | −0,0001 | |||
| SPY / SPDR S&P 500 ETF | 0,00 | 25,07 | 0,28 | 36,06 | 0,1280 | 0,0258 | |||
| IVV / iShares Trust - iShares Core S&P 500 ETF | 0,00 | −3,01 | 0,28 | 5,22 | 0,1276 | −0,0042 | |||
| XLV / The Select Sector SPDR Trust - The Health Care Select Sector SPDR Fund | 0,00 | 0,00 | 0,28 | 13,17 | 0,1244 | 0,0049 | |||
| VZ / Verizon Communications Inc. | 0,00 | 0,10 | 0,26 | 1,58 | 0,1163 | −0,0081 | |||
| C.WSA / Citigroup, Inc. | 0,00 | 0,23 | 0,1063 | 0,1063 | |||||
| WTW / Willis Towers Watson Public Limited Company | 0,00 | −16,67 | 0,20 | −12,93 | 0,0914 | −0,0227 | |||
| OXY / Occidental Petroleum Corporation | 0,00 | −100,00 | 0,00 | −100,00 | −0,4813 | ||||
| CLDT / Chatham Lodging Trust | 0,00 | −100,00 | 0,00 | −100,00 | −0,3663 | ||||
| SCHW / The Charles Schwab Corporation | 0,00 | −100,00 | 0,00 | −100,00 | −0,1809 |