Grundläggande statistik
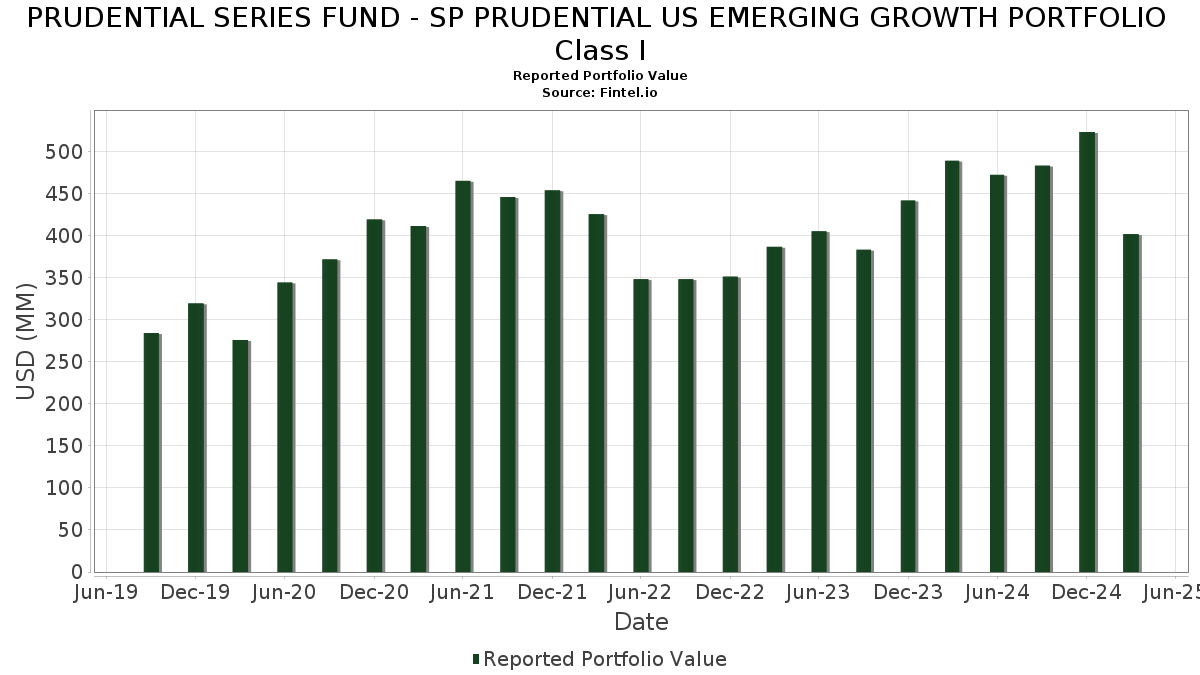
| Portföljvärde | $ 402 173 126 |
| Aktuella positioner | 117 |
Senaste innehav, resultat, förvaltat kapital (från 13F, 13D)
PRUDENTIAL SERIES FUND - SP PRUDENTIAL US EMERGING GROWTH PORTFOLIO Class I har redovisat 117 totala innehav i sina senaste SEC-arkiveringar. Det senaste portföljvärdet beräknas vara $ 402 173 126 USD. Faktiskt förvaltade tillgångar (AUM) är detta värde plus likvida medel (som inte redovisas). PRUDENTIAL SERIES FUND - SP PRUDENTIAL US EMERGING GROWTH PORTFOLIO Class Is största innehav är Palantir Technologies Inc. (US:PLTR) , Hilton Worldwide Holdings Inc. (US:HLT) , AppLovin Corporation (US:APP) , HubSpot, Inc. (US:HUBS) , and Alnylam Pharmaceuticals, Inc. (US:ALNY) . PRUDENTIAL SERIES FUND - SP PRUDENTIAL US EMERGING GROWTH PORTFOLIO Class Is nya positioner inkluderar The Williams Companies, Inc. (US:WMB) , Cloudflare, Inc. (US:NET) , Penumbra, Inc. (US:PEN) , Performance Food Group Company (US:PFGC) , and monday.com Ltd. (US:MNDY) .
Största ökningarna detta kvartal
Vi använder förändringen i portföljallokeringen eftersom det är det mest meningsfulla måttet. Förändringar kan bero på transaktioner eller förändringar i aktiekurser.
| Värdepapper | Aktier (MM) |
Värde (MM$) |
Portfölj % av | ΔPortfölj % av |
|---|---|---|---|---|
| 6,32 | 6,32 | 1,5672 | 1,5672 | |
| 0,16 | 13,66 | 3,3867 | 1,3287 | |
| 0,08 | 4,57 | 1,1330 | 1,1330 | |
| 0,04 | 4,18 | 1,0364 | 1,0364 | |
| 0,02 | 3,01 | 0,7471 | 0,7471 | |
| 0,01 | 2,85 | 0,7077 | 0,7077 | |
| 0,03 | 2,74 | 0,6794 | 0,6794 | |
| 0,03 | 2,62 | 0,6502 | 0,6502 | |
| 0,04 | 6,63 | 1,6451 | 0,6008 | |
| 0,01 | 2,37 | 0,5870 | 0,5870 |
Största minskningarna detta kvartal
Vi använder förändringen i portföljallokeringen eftersom det är det mest meningsfulla måttet. Förändringar kan bero på transaktioner eller förändringar i aktiepriser.
| Värdepapper | Aktier (MM) |
Värde (MM$) |
Portfölj % av | ΔPortfölj % av |
|---|---|---|---|---|
| 0,05 | 2,68 | 0,6646 | −1,6017 | |
| 0,03 | 7,89 | 1,9575 | −1,0191 | |
| 0,05 | 3,32 | 0,8221 | −1,0018 | |
| 0,00 | 0,00 | −0,9064 | ||
| 0,01 | 1,35 | 0,3341 | −0,7551 | |
| 0,02 | 1,79 | 0,4438 | −0,6828 | |
| 0,01 | 1,54 | 0,3815 | −0,6438 | |
| 0,02 | 2,37 | 0,5871 | −0,6097 | |
| 0,04 | 1,70 | 0,4225 | −0,5143 | |
| 0,04 | 3,19 | 0,7908 | −0,4362 |
13F- och fond arkiveringar
Denna blankett lämnades in den 2025-05-27 för rapporteringsperioden 2025-03-31. Klicka på länksymbolen för att se hela transaktionshistoriken.
Uppgradera för att låsa upp premiumdata och exportera till Excel![]() .
.
| Värdepapper | Typ | Genomsnittligt aktiepris | Aktier (MM) |
ΔAktier (%) |
ΔAktier (%) |
Värde ($MM) |
Portfölj (%) |
ΔPortfölj (%) |
|
|---|---|---|---|---|---|---|---|---|---|
| PLTR / Palantir Technologies Inc. | 0,16 | 33,58 | 13,66 | 49,06 | 3,3867 | 1,3287 | |||
| HLT / Hilton Worldwide Holdings Inc. | 0,04 | 0,00 | 8,43 | −7,94 | 2,0913 | 0,0337 | |||
| APP / AppLovin Corporation | 0,03 | −27,20 | 7,89 | −40,43 | 1,9575 | −1,0191 | |||
| HUBS / HubSpot, Inc. | 0,01 | −5,21 | 7,33 | −22,28 | 1,8188 | −0,3011 | |||
| ALNY / Alnylam Pharmaceuticals, Inc. | 0,03 | 0,00 | 7,30 | 14,74 | 1,8106 | 0,3813 | |||
| HEIA / Heico Corp. - Class A | 0,03 | −6,57 | 7,24 | 5,93 | 1,7950 | 0,2601 | |||
| IT / Gartner, Inc. | 0,02 | 0,00 | 6,73 | −13,35 | 1,6688 | −0,0760 | |||
| TW / Tradeweb Markets Inc. | 0,04 | 25,83 | 6,63 | 42,70 | 1,6451 | 0,6008 | |||
| LPLA / LPL Financial Holdings Inc. | 0,02 | 11,08 | 6,45 | 11,30 | 1,6003 | 0,2978 | |||
| PGIM Core Ultra Short Bond Fund / STIV (000000000) | 6,32 | 6,32 | 1,5672 | 1,5672 | |||||
| NTRA / Natera, Inc. | 0,04 | 0,00 | 6,27 | −10,67 | 1,5547 | −0,0218 | |||
| TSCO / Tractor Supply Company | 0,11 | −10,84 | 6,22 | −7,42 | 1,5415 | 0,0334 | |||
| ARES / Ares Management Corporation | 0,04 | 0,00 | 6,21 | −17,18 | 1,5387 | −0,1443 | |||
| LNG / Cheniere Energy, Inc. | 0,03 | −0,85 | 6,15 | 6,77 | 1,5250 | 0,2312 | |||
| VEEV / Veeva Systems Inc. | 0,02 | 4,58 | 5,45 | 15,23 | 1,3507 | 0,2887 | |||
| MCK / McKesson Corporation | 0,01 | 11,31 | 5,39 | 31,44 | 1,3374 | 0,4157 | |||
| PWR / Quanta Services, Inc. | 0,02 | −4,08 | 5,39 | −22,86 | 1,3358 | −0,2328 | |||
| AJG / Arthur J. Gallagher & Co. | 0,02 | 16,94 | 5,32 | 42,23 | 1,3196 | 0,4792 | |||
| CASY / Casey's General Stores, Inc. | 0,01 | 10,55 | 5,31 | 21,09 | 1,3174 | 0,3320 | |||
| BURL / Burlington Stores, Inc. | 0,02 | 19,09 | 5,14 | −0,43 | 1,2739 | 0,1149 | |||
| DDOG / Datadog, Inc. | 0,05 | −2,85 | 5,03 | −32,55 | 1,2471 | −0,4277 | |||
| BFAM / Bright Horizons Family Solutions Inc. | 0,04 | 0,00 | 4,92 | 14,60 | 1,2207 | 0,2559 | |||
| MSCI / MSCI Inc. | 0,01 | 0,00 | 4,65 | −5,75 | 1,1542 | 0,0449 | |||
| DASH / DoorDash, Inc. | 0,03 | −16,29 | 4,58 | −8,79 | 1,1369 | 0,0078 | |||
| WMB / The Williams Companies, Inc. | 0,08 | 4,57 | 1,1330 | 1,1330 | |||||
| NTNX / Nutanix, Inc. | 0,06 | 11,75 | 4,51 | 27,55 | 1,1184 | 0,3239 | |||
| AZO / AutoZone, Inc. | 0,00 | 56,40 | 4,34 | 86,29 | 1,0750 | 0,5521 | |||
| TTWO / Take-Two Interactive Software, Inc. | 0,02 | −15,42 | 4,31 | −4,77 | 1,0688 | 0,0521 | |||
| FDS / FactSet Research Systems Inc. | 0,01 | 0,00 | 4,26 | −5,35 | 1,0570 | 0,0455 | |||
| NET / Cloudflare, Inc. | 0,04 | 4,18 | 1,0364 | 1,0364 | |||||
| SAIA / Saia, Inc. | 0,01 | 0,00 | 4,10 | −23,33 | 1,0165 | −0,1844 | |||
| CPRT / Copart, Inc. | 0,07 | 0,00 | 4,08 | −1,38 | 1,0107 | 0,0822 | |||
| VST / Vistra Corp. | 0,03 | 22,78 | 4,06 | 4,58 | 1,0074 | 0,1349 | |||
| ITT / ITT Inc. | 0,03 | −9,27 | 4,02 | −17,99 | 0,9973 | −0,1041 | |||
| AXON / Axon Enterprise, Inc. | 0,01 | 31,86 | 4,02 | 16,69 | 0,9969 | 0,2231 | |||
| ESAB / ESAB Corporation | 0,03 | 8,71 | 3,99 | 5,59 | 0,9888 | 0,1406 | |||
| POOL / Pool Corporation | 0,01 | 0,00 | 3,91 | −6,64 | 0,9695 | 0,0290 | |||
| PLNT / Planet Fitness, Inc. | 0,04 | 0,00 | 3,87 | −2,30 | 0,9593 | 0,0700 | |||
| EOG / EOG Resources, Inc. | 0,03 | −11,16 | 3,81 | −7,05 | 0,9444 | 0,0240 | |||
| FTI / TechnipFMC plc | 0,12 | −13,54 | 3,77 | −5,33 | 0,9345 | 0,0404 | |||
| ULTA / Ulta Beauty, Inc. | 0,01 | 72,30 | 3,74 | 45,22 | 0,9271 | 0,3487 | |||
| TYL / Tyler Technologies, Inc. | 0,01 | −11,34 | 3,71 | −10,60 | 0,9198 | −0,0123 | |||
| FLUT / Flutter Entertainment plc | 0,02 | 0,00 | 3,70 | −14,28 | 0,9183 | −0,0521 | |||
| TDY / Teledyne Technologies Incorporated | 0,01 | 15,33 | 3,57 | 23,68 | 0,8846 | 0,2367 | |||
| TEAM / Atlassian Corporation | 0,02 | 0,00 | 3,53 | −12,81 | 0,8762 | −0,0341 | |||
| CYBR / CyberArk Software Ltd. | 0,01 | 0,00 | 3,52 | 1,44 | 0,8733 | 0,0936 | |||
| INSM / Insmed Incorporated | 0,05 | 26,52 | 3,50 | 39,84 | 0,8687 | 0,3059 | |||
| AME / AMETEK, Inc. | 0,02 | 0,00 | 3,47 | −4,51 | 0,8616 | 0,0443 | |||
| EXP / Eagle Materials Inc. | 0,02 | 12,82 | 3,46 | 1,47 | 0,8587 | 0,0921 | |||
| HWM / Howmet Aerospace Inc. | 0,03 | 57,06 | 3,39 | 86,27 | 0,8413 | 0,4322 | |||
| VRT / Vertiv Holdings Co | 0,05 | −35,76 | 3,32 | −59,17 | 0,8221 | −1,0018 | |||
| IBKR / Interactive Brokers Group, Inc. | 0,02 | −37,06 | 3,25 | −41,02 | 0,8061 | −0,4316 | |||
| HOOD / Robinhood Markets, Inc. | 0,08 | −41,39 | 3,25 | −34,54 | 0,8049 | −0,3088 | |||
| NU / Nu Holdings Ltd. | 0,31 | 0,00 | 3,22 | −1,14 | 0,7978 | 0,0667 | |||
| COO / The Cooper Companies, Inc. | 0,04 | 6,39 | 3,20 | −2,38 | 0,7938 | 0,0572 | |||
| TER / Teradyne, Inc. | 0,04 | −11,00 | 3,19 | −41,61 | 0,7908 | −0,4362 | |||
| RBLX / Roblox Corporation | 0,05 | 34,18 | 3,07 | 118,30 | 0,7602 | 0,2768 | |||
| CFLT / Confluent, Inc. | 0,13 | −0,62 | 3,06 | −16,69 | 0,7588 | −0,0662 | |||
| CBRE / CBRE Group, Inc. | 0,02 | 3,01 | 0,7471 | 0,7471 | |||||
| FIX / Comfort Systems USA, Inc. | 0,01 | 52,20 | 2,96 | 15,67 | 0,7341 | 0,1593 | |||
| WAB / Westinghouse Air Brake Technologies Corporation | 0,02 | −1,83 | 2,93 | −6,10 | 0,7253 | 0,0256 | |||
| RKT / Rocket Companies, Inc. | 0,24 | 31,31 | 2,92 | 40,74 | 0,7240 | 0,2581 | |||
| MTD / Mettler-Toledo International Inc. | 0,00 | 25,71 | 2,91 | 21,31 | 0,7215 | 0,1828 | |||
| PEN / Penumbra, Inc. | 0,01 | 2,85 | 0,7077 | 0,7077 | |||||
| OKTA / Okta, Inc. | 0,03 | 2,74 | 0,6794 | 0,6794 | |||||
| CH1134540470 / On Holding AG | 0,06 | 16,16 | 2,74 | −6,85 | 0,6783 | 0,0187 | |||
| JEF / Jefferies Financial Group Inc. | 0,05 | 13,95 | 2,73 | −22,14 | 0,6760 | −0,1104 | |||
| DXCM / DexCom, Inc. | 0,04 | 37,04 | 2,70 | 20,35 | 0,6704 | 0,1658 | |||
| TTD / The Trade Desk, Inc. | 0,05 | −42,95 | 2,68 | −73,44 | 0,6646 | −1,6017 | |||
| RJF / Raymond James Financial, Inc. | 0,02 | 0,00 | 2,66 | −10,58 | 0,6585 | −0,0085 | |||
| PFGC / Performance Food Group Company | 0,03 | 2,62 | 0,6502 | 0,6502 | |||||
| SNOW / Snowflake Inc. | 0,02 | 83,84 | 2,61 | 74,03 | 0,6483 | 0,3108 | |||
| A / Agilent Technologies, Inc. | 0,02 | 38,98 | 2,58 | 21,02 | 0,6398 | 0,1609 | |||
| MDB / MongoDB, Inc. | 0,01 | −20,20 | 2,53 | −39,90 | 0,6263 | −0,3174 | |||
| ENTG / Entegris, Inc. | 0,03 | −36,05 | 2,49 | −43,52 | 0,6185 | −0,3736 | |||
| AAON / AAON, Inc. | 0,03 | −14,95 | 2,47 | −43,55 | 0,6134 | −0,3707 | |||
| AL / Air Lease Corporation | 0,05 | 0,00 | 2,47 | 0,20 | 0,6117 | 0,0588 | |||
| SSD / Simpson Manufacturing Co., Inc. | 0,02 | 0,00 | 2,45 | −5,29 | 0,6081 | 0,0266 | |||
| GRMN / Garmin Ltd. | 0,01 | −23,24 | 2,38 | −19,19 | 0,5910 | −0,0715 | |||
| TWLO / Twilio Inc. | 0,02 | 80,23 | 2,37 | −48,23 | 0,5871 | −0,6097 | |||
| MNDY / monday.com Ltd. | 0,01 | 2,37 | 0,5870 | 0,5870 | |||||
| MSA / MSA Safety Incorporated | 0,02 | 0,00 | 2,34 | −11,50 | 0,5804 | −0,0137 | |||
| NBIX / Neurocrine Biosciences, Inc. | 0,02 | −3,40 | 2,33 | −22,40 | 0,5782 | −0,1600 | |||
| JBHT / J.B. Hunt Transport Services, Inc. | 0,02 | −26,58 | 2,33 | −36,37 | 0,5780 | −0,2446 | |||
| IR / Ingersoll Rand Inc. | 0,03 | 0,00 | 2,20 | −11,54 | 0,5460 | −0,0130 | |||
| GDDY / GoDaddy Inc. | 0,01 | 2,18 | 0,5417 | 0,5417 | |||||
| SGI / Somnigroup International Inc. | 0,04 | 2,16 | 0,5358 | 0,5358 | |||||
| RMBS / Rambus Inc. | 0,04 | −16,01 | 2,05 | −17,75 | 0,5080 | −0,0514 | |||
| CMG / Chipotle Mexican Grill, Inc. | 0,04 | 2,28 | 2,04 | −18,03 | 0,5062 | −0,1056 | |||
| TT / Trane Technologies plc | 0,01 | 3,82 | 1,99 | −5,33 | 0,4932 | 0,0214 | |||
| IQV / IQVIA Holdings Inc. | 0,01 | −22,71 | 1,94 | −30,69 | 0,4801 | −0,1471 | |||
| MCO / Moody's Corporation | 0,00 | −24,97 | 1,92 | −26,19 | 0,4760 | −0,1082 | |||
| THO / THOR Industries, Inc. | 0,02 | 0,00 | 1,88 | −20,78 | 0,4660 | −0,0669 | |||
| HUBB / Hubbell Incorporated | 0,01 | −16,25 | 1,84 | −33,85 | 0,4561 | −0,1684 | |||
| COIN / Coinbase Global, Inc. | 0,01 | 0,00 | 1,80 | −30,65 | 0,4473 | −0,1368 | |||
| BAH / Booz Allen Hamilton Holding Corporation | 0,02 | −56,09 | 1,79 | −64,33 | 0,4438 | −0,6828 | |||
| ALKS / Alkermes plc | 0,05 | 1,75 | 0,4347 | 0,4347 | |||||
| FND / Floor & Decor Holdings, Inc. | 0,02 | 0,00 | 1,74 | −19,29 | 0,4306 | −0,0527 | |||
| ONTO / Onto Innovation Inc. | 0,01 | 0,00 | 1,73 | −27,20 | 0,4296 | −0,1049 | |||
| CIEN / Ciena Corporation | 0,03 | 24,94 | 1,72 | −10,99 | 0,4258 | −0,0074 | |||
| LVS / Las Vegas Sands Corp. | 0,04 | −45,68 | 1,70 | −59,15 | 0,4225 | −0,5143 | |||
| TPG / TPG Inc. | 0,04 | 0,00 | 1,68 | −24,55 | 0,4163 | −0,0833 | |||
| CRWD / CrowdStrike Holdings, Inc. | 0,00 | −42,70 | 1,67 | −40,96 | 0,4137 | −0,2210 | |||
| ELF / e.l.f. Beauty, Inc. | 0,03 | 0,00 | 1,65 | −50,00 | 0,4093 | −0,3320 | |||
| ON / ON Semiconductor Corporation | 0,04 | −20,61 | 1,59 | −48,77 | 0,3939 | −0,3025 | |||
| WST / West Pharmaceutical Services, Inc. | 0,01 | −50,69 | 1,54 | −66,30 | 0,3815 | −0,6438 | |||
| BPMC / Blueprint Medicines Corporation | 0,02 | 1,50 | 0,3731 | 0,3731 | |||||
| MRVL / Marvell Technology, Inc. | 0,02 | −16,81 | 1,37 | −53,63 | 0,3392 | −0,3234 | |||
| INSP / Inspire Medical Systems, Inc. | 0,01 | −23,73 | 1,35 | −34,50 | 0,3344 | −0,1279 | |||
| GLOB / Globant S.A. | 0,01 | −49,39 | 1,35 | −72,22 | 0,3341 | −0,7551 | |||
| RBRK / Rubrik, Inc. | 0,02 | −23,72 | 1,34 | −28,87 | 0,3320 | −0,0906 | |||
| MPWR / Monolithic Power Systems, Inc. | 0,00 | −49,07 | 1,33 | −50,09 | 0,3295 | −0,2683 | |||
| GTLB / GitLab Inc. | 0,03 | 0,00 | 1,30 | −16,65 | 0,3218 | −0,0277 | |||
| VKTX / Viking Therapeutics, Inc. | 0,04 | 52,17 | 1,06 | −8,68 | 0,2638 | 0,0022 | |||
| RVMD / Revolution Medicines, Inc. | 0,03 | 0,00 | 1,04 | −19,20 | 0,2591 | −0,0312 | |||
| PCVX / Vaxcyte, Inc. | 0,01 | 0,00 | 0,54 | −53,86 | 0,1349 | −0,1300 | |||
| PGIM Institutional Money Market Fund - D / STIV (000000000) | 0,27 | 0,27 | 0,0675 | 0,0675 | |||||
| DPZ / Domino's Pizza, Inc. | 0,00 | −100,00 | 0,00 | −100,00 | −0,9064 |