Grundläggande statistik
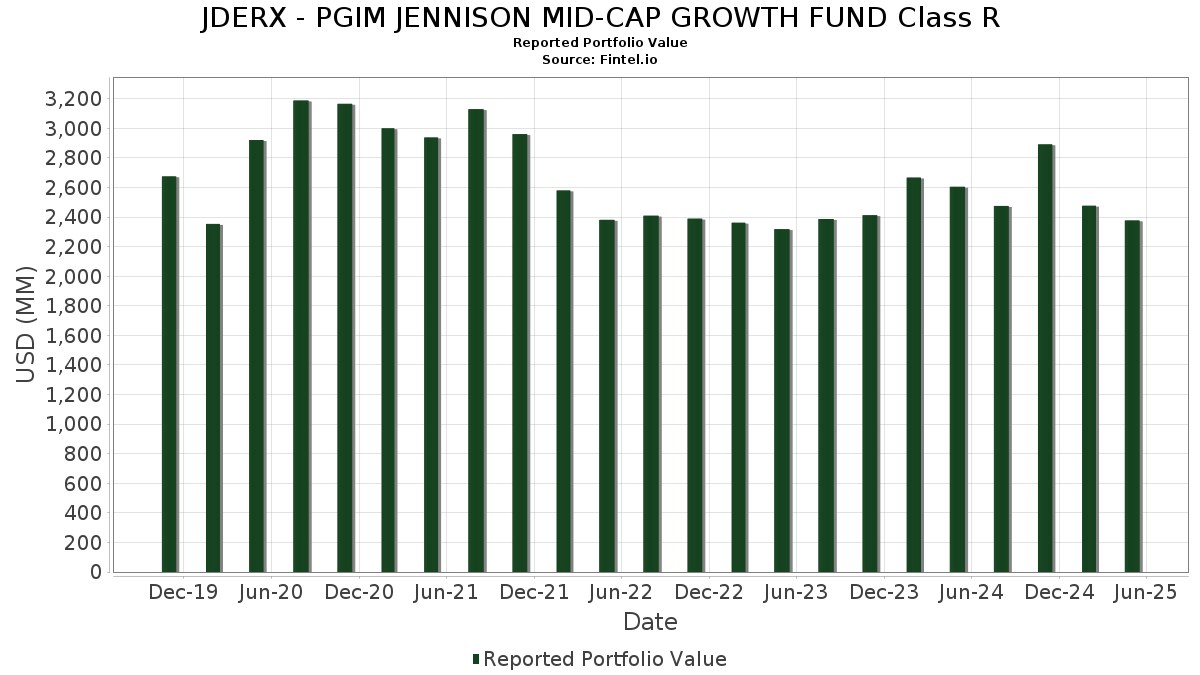
| Portföljvärde | $ 2 376 650 530 |
| Aktuella positioner | 70 |
Senaste innehav, resultat, förvaltat kapital (från 13F, 13D)
JDERX - PGIM JENNISON MID-CAP GROWTH FUND Class R har redovisat 70 totala innehav i sina senaste SEC-arkiveringar. Det senaste portföljvärdet beräknas vara $ 2 376 650 530 USD. Faktiskt förvaltade tillgångar (AUM) är detta värde plus likvida medel (som inte redovisas). JDERX - PGIM JENNISON MID-CAP GROWTH FUND Class Rs största innehav är AppLovin Corporation (US:APP) , Cheniere Energy, Inc. (US:LNG) , Performance Food Group Company (US:PFGC) , Shift4 Payments, Inc. (US:FOUR) , and CrowdStrike Holdings, Inc. (US:CRWD) . JDERX - PGIM JENNISON MID-CAP GROWTH FUND Class Rs nya positioner inkluderar Roblox Corporation (US:RBLX) , Cencora, Inc. (US:COR) , Alnylam Pharmaceuticals, Inc. (US:ALNY) , Woodward, Inc. (US:WWD) , and Casey's General Stores, Inc. (US:CASY) .
Största ökningarna detta kvartal
Vi använder förändringen i portföljallokeringen eftersom det är det mest meningsfulla måttet. Förändringar kan bero på transaktioner eller förändringar i aktiekurser.
| Värdepapper | Aktier (MM) |
Värde (MM$) |
Portfölj % av | ΔPortfölj % av |
|---|---|---|---|---|
| 129,69 | 129,60 | 5,7756 | 5,7756 | |
| 0,27 | 105,13 | 4,6853 | 2,9860 | |
| 61,49 | 61,49 | 2,7404 | 2,7404 | |
| 0,44 | 38,53 | 1,7171 | 1,7171 | |
| 0,11 | 31,51 | 1,4044 | 1,4044 | |
| 0,10 | 29,50 | 1,3146 | 1,3146 | |
| 0,11 | 23,90 | 1,0650 | 1,0650 | |
| 0,45 | 38,37 | 1,7098 | 0,9685 | |
| 0,12 | 32,13 | 1,4318 | 0,7147 | |
| 0,16 | 60,76 | 2,7077 | 0,6128 |
Största minskningarna detta kvartal
Vi använder förändringen i portföljallokeringen eftersom det är det mest meningsfulla måttet. Förändringar kan bero på transaktioner eller förändringar i aktiepriser.
| Värdepapper | Aktier (MM) |
Värde (MM$) |
Portfölj % av | ΔPortfölj % av |
|---|---|---|---|---|
| 0,27 | 16,17 | 0,7208 | −1,5475 | |
| 0,02 | 6,66 | 0,2966 | −1,1971 | |
| 0,12 | 15,51 | 0,6910 | −1,1345 | |
| 0,20 | 17,88 | 0,7968 | −1,1006 | |
| 0,05 | 13,02 | 0,5802 | −0,9125 | |
| 0,17 | 13,62 | 0,6069 | −0,8200 | |
| 0,00 | 0,00 | −0,8054 | ||
| 0,15 | 18,37 | 0,8185 | −0,6783 | |
| 1,27 | 39,65 | 1,7669 | −0,6467 | |
| 0,37 | 43,76 | 1,9500 | −0,5386 |
13F- och fond arkiveringar
Denna blankett lämnades in den 2025-07-29 för rapporteringsperioden 2025-05-30. Klicka på länksymbolen för att se hela transaktionshistoriken.
Uppgradera för att låsa upp premiumdata och exportera till Excel![]() .
.
| Värdepapper | Typ | Genomsnittligt aktiepris | Aktier (MM) |
ΔAktier (%) |
ΔAktier (%) |
Värde ($MM) |
Portfölj (%) |
ΔPortfölj (%) |
|
|---|---|---|---|---|---|---|---|---|---|
| PGIM Institutional Money Market Fund - D / STIV (000000000) | 129,69 | 129,60 | 5,7756 | 5,7756 | |||||
| APP / AppLovin Corporation | 0,27 | 118,56 | 105,13 | 163,69 | 4,6853 | 2,9860 | |||
| LNG / Cheniere Energy, Inc. | 0,31 | 0,00 | 73,59 | 3,69 | 3,2797 | 0,2546 | |||
| PFGC / Performance Food Group Company | 0,77 | 0,00 | 69,31 | 5,19 | 3,0887 | 0,2805 | |||
| FOUR / Shift4 Payments, Inc. | 0,69 | 7,43 | 65,10 | 3,12 | 2,9011 | 0,2106 | |||
| CRWD / CrowdStrike Holdings, Inc. | 0,13 | −30,75 | 63,25 | −16,23 | 2,8189 | −0,3993 | |||
| HUBS / HubSpot, Inc. | 0,11 | 3,04 | 62,36 | −16,05 | 2,7793 | −0,3869 | |||
| TTWO / Take-Two Interactive Software, Inc. | 0,27 | 13,19 | 61,95 | 20,83 | 2,7610 | 0,5756 | |||
| (PIPA070) PGIM Core Government Money Market Fund / STIV (000000000) | 61,49 | 61,49 | 2,7404 | 2,7404 | |||||
| LPLA / LPL Financial Holdings Inc. | 0,16 | 18,69 | 60,76 | 23,61 | 2,7077 | 0,6128 | |||
| CH1134540470 / On Holding AG | 1,00 | −2,36 | 59,47 | 19,62 | 2,6505 | 0,5313 | |||
| BURL / Burlington Stores, Inc. | 0,26 | 7,20 | 59,31 | −1,85 | 2,6431 | 0,0675 | |||
| ORLY / O'Reilly Automotive, Inc. | 0,04 | 12,37 | 54,04 | 11,87 | 2,4084 | 0,3494 | |||
| CYBR / CyberArk Software Ltd. | 0,13 | 0,00 | 51,40 | 5,20 | 2,2907 | 0,2082 | |||
| GFL / GFL Environmental Inc. | 1,01 | −10,94 | 50,82 | −0,54 | 2,2650 | 0,0870 | |||
| VST / Vistra Corp. | 0,31 | 0,00 | 49,47 | 20,13 | 2,2046 | 0,4495 | |||
| DDOG / Datadog, Inc. | 0,37 | −25,90 | 43,76 | −25,06 | 1,9500 | −0,5386 | |||
| DPZ / Domino's Pizza, Inc. | 0,09 | 43,91 | 42,98 | 39,24 | 1,9155 | 0,5998 | |||
| CBRE / CBRE Group, Inc. | 0,32 | 25,85 | 39,69 | 10,85 | 1,7687 | 0,2427 | |||
| PINS / Pinterest, Inc. | 1,27 | −16,78 | 39,65 | −29,98 | 1,7669 | −0,6467 | |||
| IOT / Samsara Inc. | 0,83 | 17,40 | 38,63 | 14,59 | 1,7218 | 0,2847 | |||
| RBLX / Roblox Corporation | 0,44 | 38,53 | 1,7171 | 1,7171 | |||||
| DXCM / DexCom, Inc. | 0,45 | 127,19 | 38,37 | 120,59 | 1,7098 | 0,9685 | |||
| HLT / Hilton Worldwide Holdings Inc. | 0,15 | −21,32 | 37,89 | −26,22 | 1,6887 | −0,5004 | |||
| EXAS / Exact Sciences Corporation | 0,67 | −3,04 | 37,88 | 15,10 | 1,6883 | 0,2855 | |||
| HLI / Houlihan Lokey, Inc. | 0,20 | 5,77 | 35,80 | 6,59 | 1,5955 | 0,1638 | |||
| PODD / Insulet Corporation | 0,10 | −15,48 | 33,63 | 0,89 | 1,4988 | 0,0781 | |||
| TXRH / Texas Roadhouse, Inc. | 0,17 | −28,85 | 32,92 | −24,55 | 1,4671 | −0,3926 | |||
| CHDN / Churchill Downs Incorporated | 0,34 | 19,24 | 32,66 | −3,93 | 1,4557 | 0,0065 | |||
| EXE / Expand Energy Corporation | 0,28 | 12,47 | 32,50 | 32,09 | 1,4484 | 0,3997 | |||
| PAYC / Paycom Software, Inc. | 0,12 | 43,69 | 32,13 | 104,94 | 1,4318 | 0,7147 | |||
| COR / Cencora, Inc. | 0,11 | 31,51 | 1,4044 | 1,4044 | |||||
| AME / AMETEK, Inc. | 0,17 | −23,69 | 30,80 | −27,94 | 1,3725 | −0,4492 | |||
| ALNY / Alnylam Pharmaceuticals, Inc. | 0,10 | 29,50 | 1,3146 | 1,3146 | |||||
| NTRA / Natera, Inc. | 0,18 | 39,11 | 28,76 | 41,03 | 1,2819 | 0,4126 | |||
| COO / The Cooper Companies, Inc. | 0,42 | 14,40 | 28,69 | −13,58 | 1,2785 | −0,1363 | |||
| PWR / Quanta Services, Inc. | 0,08 | −27,98 | 28,06 | −4,97 | 1,2503 | −0,0081 | |||
| ZWS / Zurn Elkay Water Solutions Corporation | 0,78 | −5,81 | 28,05 | −3,79 | 1,2500 | 0,0074 | |||
| HEI / HEICO Corporation | 0,09 | −20,12 | 26,53 | −9,57 | 1,1821 | −0,0681 | |||
| CDNS / Cadence Design Systems, Inc. | 0,09 | 20,71 | 25,64 | 38,33 | 1,1429 | 0,3527 | |||
| TTD / The Trade Desk, Inc. | 0,34 | −35,97 | 25,28 | −31,50 | 1,1266 | −0,4464 | |||
| MPWR / Monolithic Power Systems, Inc. | 0,04 | 18,52 | 24,91 | 28,39 | 1,1103 | 0,2832 | |||
| TDY / Teledyne Technologies Incorporated | 0,05 | 16,49 | 24,91 | 12,84 | 1,1103 | 0,1692 | |||
| XYL / Xylem Inc. | 0,20 | −8,91 | 24,89 | −12,28 | 1,1091 | −0,1002 | |||
| TOST / Toast, Inc. | 0,58 | 46,05 | 24,35 | 59,59 | 1,0853 | 0,4349 | |||
| WWD / Woodward, Inc. | 0,11 | 23,90 | 1,0650 | 1,0650 | |||||
| MNDY / monday.com Ltd. | 0,08 | 34,79 | 22,52 | 35,12 | 1,0036 | 0,2932 | |||
| PCOR / Procore Technologies, Inc. | 0,33 | 0,00 | 22,46 | −12,16 | 1,0008 | −0,0889 | |||
| RYAN / Ryan Specialty Holdings, Inc. | 0,31 | −18,54 | 21,85 | −16,70 | 0,9736 | −0,1442 | |||
| BWXT / BWX Technologies, Inc. | 0,15 | −56,71 | 18,37 | −47,70 | 0,8185 | −0,6783 | |||
| EWBC / East West Bancorp, Inc. | 0,20 | −58,41 | 17,88 | −59,84 | 0,7968 | −1,1006 | |||
| ARGX / argenx SE - Depositary Receipt (Common Stock) | 0,03 | 0,74 | 16,98 | −7,55 | 0,7567 | −0,0261 | |||
| ANET / Arista Networks Inc | 0,20 | −25,48 | 16,92 | −30,61 | 0,7540 | −0,2853 | |||
| OLED / Universal Display Corporation | 0,12 | 0,00 | 16,86 | −6,69 | 0,7513 | −0,0187 | |||
| MRVL / Marvell Technology, Inc. | 0,27 | −53,64 | 16,17 | −69,61 | 0,7208 | −1,5475 | |||
| ILMN / Illumina, Inc. | 0,19 | −31,20 | 15,82 | −36,24 | 0,7049 | −0,3524 | |||
| APO / Apollo Global Management, Inc. | 0,12 | −58,65 | 15,51 | −63,80 | 0,6910 | −1,1345 | |||
| CAVA / CAVA Group, Inc. | 0,19 | −5,23 | 15,37 | −18,95 | 0,6849 | −0,1233 | |||
| WSO / Watsco, Inc. | 0,03 | −39,11 | 15,28 | −46,44 | 0,6808 | −0,5349 | |||
| GNRC / Generac Holdings Inc. | 0,12 | 0,00 | 14,91 | −10,29 | 0,6645 | −0,0440 | |||
| FRPT / Freshpet, Inc. | 0,17 | −45,69 | 13,62 | −59,32 | 0,6069 | −0,8200 | |||
| SAIA / Saia, Inc. | 0,05 | −42,43 | 13,02 | −62,83 | 0,5802 | −0,9125 | |||
| A / Agilent Technologies, Inc. | 0,10 | −20,26 | 10,85 | −30,23 | 0,4835 | −0,1793 | |||
| ENTG / Entegris, Inc. | 0,15 | −34,95 | 10,05 | −55,82 | 0,4480 | −0,5219 | |||
| POOL / Pool Corporation | 0,03 | −19,55 | 8,55 | −30,31 | 0,3811 | −0,1419 | |||
| CSGP / CoStar Group, Inc. | 0,11 | −17,71 | 8,15 | −20,61 | 0,3632 | −0,0743 | |||
| IT / Gartner, Inc. | 0,02 | −78,31 | 6,66 | −81,01 | 0,2966 | −1,1971 | |||
| CASY / Casey's General Stores, Inc. | 0,02 | 6,65 | 0,2962 | 0,2962 | |||||
| HXL / Hexcel Corporation | 0,12 | 0,00 | 6,38 | −16,53 | 0,2844 | −0,0415 | |||
| TTAN / ServiceTitan, Inc. | 0,05 | 6,01 | 0,2679 | 0,2679 | |||||
| ALLY / Ally Financial Inc. | 0,00 | −100,00 | 0,00 | −100,00 | −0,8054 | ||||
| ELF / e.l.f. Beauty, Inc. | 0,00 | −100,00 | 0,00 | −100,00 | −0,2940 | ||||
| GKOS / Glaukos Corporation | 0,00 | −100,00 | 0,00 | −100,00 | −0,2651 | ||||
| TOL / Toll Brothers, Inc. | 0,00 | −100,00 | 0,00 | −100,00 | −0,4586 |