Grundläggande statistik
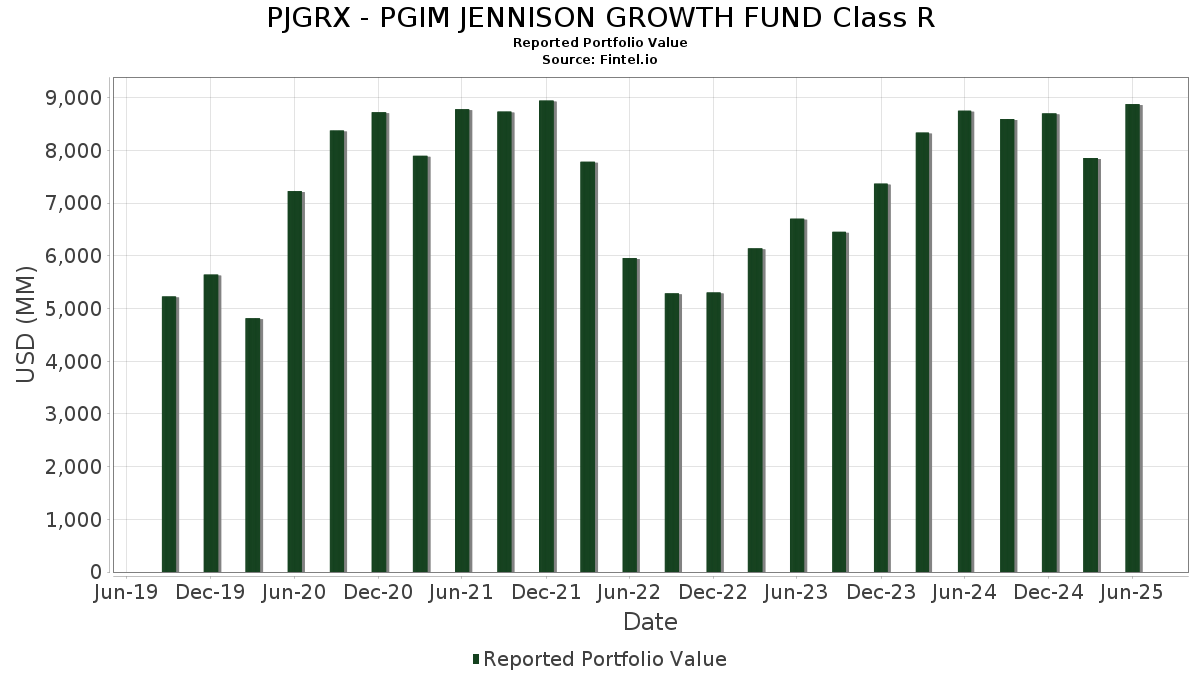
| Portföljvärde | $ 8 879 905 098 |
| Aktuella positioner | 58 |
Senaste innehav, resultat, förvaltat kapital (från 13F, 13D)
PJGRX - PGIM JENNISON GROWTH FUND Class R har redovisat 58 totala innehav i sina senaste SEC-arkiveringar. Det senaste portföljvärdet beräknas vara $ 8 879 905 098 USD. Faktiskt förvaltade tillgångar (AUM) är detta värde plus likvida medel (som inte redovisas). PJGRX - PGIM JENNISON GROWTH FUND Class Rs största innehav är NVIDIA Corporation (US:NVDA) , Amazon.com, Inc. (US:AMZN) , Microsoft Corporation (US:MSFT) , Meta Platforms, Inc. (US:META) , and Netflix, Inc. (US:NFLX) .
Största ökningarna detta kvartal
Vi använder förändringen i portföljallokeringen eftersom det är det mest meningsfulla måttet. Förändringar kan bero på transaktioner eller förändringar i aktiekurser.
| Värdepapper | Aktier (MM) |
Värde (MM$) |
Portfölj % av | ΔPortfölj % av |
|---|---|---|---|---|
| 5,41 | 853,96 | 9,7556 | 1,4642 | |
| 110,35 | 110,28 | 1,2598 | 1,2598 | |
| 1,57 | 433,80 | 4,9558 | 0,7916 | |
| 0,39 | 127,30 | 1,4543 | 0,7885 | |
| 66,93 | 66,93 | 0,7646 | 0,7646 | |
| 1,16 | 574,90 | 6,5677 | 0,6500 | |
| 0,55 | 124,71 | 1,4247 | 0,4839 | |
| 0,41 | 86,11 | 0,9837 | 0,4814 | |
| 0,59 | 41,22 | 0,4709 | 0,4709 | |
| 0,92 | 192,97 | 2,2044 | 0,4624 |
Största minskningarna detta kvartal
Vi använder förändringen i portföljallokeringen eftersom det är det mest meningsfulla måttet. Förändringar kan bero på transaktioner eller förändringar i aktiepriser.
| Värdepapper | Aktier (MM) |
Värde (MM$) |
Portfölj % av | ΔPortfölj % av |
|---|---|---|---|---|
| 1,87 | 382,93 | 4,3746 | −1,3068 | |
| 0,39 | 44,97 | 0,5138 | −1,2226 | |
| 2,99 | 657,05 | 7,5061 | −0,7441 | |
| 0,13 | 34,79 | 0,3974 | −0,7215 | |
| 1,14 | 105,97 | 1,2106 | −0,6123 | |
| 0,32 | 42,87 | 0,4898 | −0,5279 | |
| 0,33 | 256,43 | 2,9294 | −0,4943 | |
| 0,43 | 242,75 | 2,7732 | −0,4563 | |
| 0,80 | 141,65 | 1,6182 | −0,3618 | |
| 0,80 | 141,71 | 1,6189 | −0,3518 |
13F- och fond arkiveringar
Denna blankett lämnades in den 2025-08-27 för rapporteringsperioden 2025-06-30. Klicka på länksymbolen för att se hela transaktionshistoriken.
Uppgradera för att låsa upp premiumdata och exportera till Excel![]() .
.
| Värdepapper | Typ | Genomsnittligt aktiepris | Aktier (MM) |
ΔAktier (%) |
ΔAktier (%) |
Värde ($MM) |
Portfölj (%) |
ΔPortfölj (%) |
|
|---|---|---|---|---|---|---|---|---|---|
| NVDA / NVIDIA Corporation | 5,41 | −8,53 | 853,96 | 33,33 | 9,7556 | 1,4642 | |||
| AMZN / Amazon.com, Inc. | 2,99 | −10,59 | 657,05 | 3,10 | 7,5061 | −0,7441 | |||
| MSFT / Microsoft Corporation | 1,16 | −5,08 | 574,90 | 25,77 | 6,5677 | 0,6500 | |||
| META / Meta Platforms, Inc. | 0,71 | −13,50 | 521,34 | 10,77 | 5,9557 | −0,1372 | |||
| NFLX / Netflix, Inc. | 0,33 | −14,90 | 440,41 | 22,21 | 5,0313 | 0,3660 | |||
| AVGO / Broadcom Inc. | 1,57 | −18,08 | 433,80 | 34,87 | 4,9558 | 0,7916 | |||
| AAPL / Apple Inc. | 1,87 | −5,53 | 382,93 | −12,74 | 4,3746 | −1,3068 | |||
| LLY / Eli Lilly and Company | 0,33 | 2,73 | 256,43 | −3,04 | 2,9294 | −0,4943 | |||
| MA / Mastercard Incorporated | 0,43 | −5,08 | 242,75 | −2,69 | 2,7732 | −0,4563 | |||
| BA / The Boeing Company | 0,92 | 16,73 | 192,97 | 43,41 | 2,2044 | 0,4624 | |||
| VRTX / Vertex Pharmaceuticals Incorporated | 0,41 | 37,74 | 181,94 | 26,48 | 2,0785 | 0,2163 | |||
| COST / Costco Wholesale Corporation | 0,18 | −5,08 | 177,90 | −0,65 | 2,0323 | −0,2859 | |||
| DIS / The Walt Disney Company | 1,42 | 9,65 | 176,26 | 37,77 | 2,0136 | 0,3573 | |||
| TSLA / Tesla, Inc. | 0,55 | −18,98 | 174,77 | −0,69 | 1,9966 | −0,2816 | |||
| V / Visa Inc. | 0,47 | −5,08 | 165,82 | −3,84 | 1,8943 | −0,3381 | |||
| WMT / Walmart Inc. | 1,64 | −5,08 | 160,34 | 5,72 | 1,8317 | −0,1317 | |||
| CRWD / CrowdStrike Holdings, Inc. | 0,31 | −8,46 | 156,58 | 32,24 | 1,7887 | 0,2559 | |||
| CDNS / Cadence Design Systems, Inc. | 0,50 | −3,48 | 154,85 | 16,94 | 1,7690 | 0,0547 | |||
| GOOGL / Alphabet Inc. | 0,80 | −18,31 | 141,71 | −6,91 | 1,6189 | −0,3518 | |||
| GOOG / Alphabet Inc. | 0,80 | −18,43 | 141,65 | −7,38 | 1,6182 | −0,3618 | |||
| NOW / ServiceNow, Inc. | 0,13 | −6,57 | 133,10 | 20,65 | 1,5205 | 0,0923 | |||
| CEG / Constellation Energy Corporation | 0,39 | 54,64 | 127,30 | 147,54 | 1,4543 | 0,7885 | |||
| TSM / Taiwan Semiconductor Manufacturing Company Limited - Depositary Receipt (Common Stock) | 0,55 | 25,78 | 124,71 | 71,62 | 1,4247 | 0,4839 | |||
| GE / General Electric Company | 0,45 | −10,55 | 116,00 | 15,03 | 1,3252 | 0,0197 | |||
| SPOT / Spotify Technology S.A. | 0,15 | −5,08 | 111,80 | 32,42 | 1,2772 | 0,1842 | |||
| PGIM Institutional Money Market Fund - D / STIV (000000000) | 110,35 | 110,28 | 1,2598 | 1,2598 | |||||
| ISRG / Intuitive Surgical, Inc. | 0,20 | 34,57 | 109,28 | 47,65 | 1,2484 | 0,2903 | |||
| UBER / Uber Technologies, Inc. | 1,14 | −41,23 | 105,97 | −24,74 | 1,2106 | −0,6123 | |||
| HLT / Hilton Worldwide Holdings Inc. | 0,39 | −13,65 | 104,53 | 1,07 | 1,1941 | −0,1447 | |||
| MELI / MercadoLibre, Inc. | 0,04 | −5,09 | 103,16 | 27,16 | 1,1785 | 0,1282 | |||
| SNOW / Snowflake Inc. | 0,41 | −6,38 | 92,23 | 43,33 | 1,0537 | 0,2206 | |||
| ORLY / O'Reilly Automotive, Inc. | 1,02 | 1 323,73 | 92,19 | −10,43 | 1,0532 | −0,2792 | |||
| NVO / Novo Nordisk A/S - Depositary Receipt (Common Stock) | 1,30 | −4,84 | 90,04 | −5,42 | 1,0287 | −0,2038 | |||
| TXN / Texas Instruments Incorporated | 0,41 | 92,08 | 86,11 | 121,92 | 0,9837 | 0,4814 | |||
| TJX / The TJX Companies, Inc. | 0,66 | 82,07 | 81,38 | 84,59 | 0,9296 | 0,3589 | |||
| EW / Edwards Lifesciences Corporation | 0,98 | 16,06 | 76,32 | 25,23 | 0,8718 | 0,0829 | |||
| PGR / The Progressive Corporation | 0,28 | −5,08 | 73,60 | −10,50 | 0,8408 | −0,2238 | |||
| DXCM / DexCom, Inc. | 0,81 | 0,33 | 70,91 | 28,25 | 0,8100 | 0,0943 | |||
| TTD / The Trade Desk, Inc. | 0,94 | 18,51 | 67,67 | 55,91 | 0,7730 | 0,2112 | |||
| (PIPA070) PGIM Core Government Money Market Fund / STIV (000000000) | 66,93 | 66,93 | 0,7646 | 0,7646 | |||||
| ADS / adidas AG | 0,27 | −4,82 | 62,48 | −5,80 | 0,7137 | −0,1449 | |||
| NKE / NIKE, Inc. | 0,85 | 21,87 | 60,27 | 36,38 | 0,6886 | 0,1164 | |||
| MCO / Moody's Corporation | 0,11 | −22,41 | 53,47 | −16,42 | 0,6108 | −0,2174 | |||
| GS / The Goldman Sachs Group, Inc. | 0,07 | −5,08 | 48,83 | 22,97 | 0,5578 | 0,0438 | |||
| DDOG / Datadog, Inc. | 0,36 | −5,08 | 48,78 | 28,52 | 0,5572 | 0,0659 | |||
| AXON / Axon Enterprise, Inc. | 0,06 | −5,08 | 48,42 | 49,42 | 0,5532 | 0,1336 | |||
| SHOP / Shopify Inc. | 0,39 | 103,14 | 44,97 | −65,34 | 0,5138 | −1,2226 | |||
| APP / AppLovin Corporation | 0,12 | −4,82 | 43,73 | 25,76 | 0,4995 | 0,0494 | |||
| IDEXY / Industria de Diseño Textil, S.A. - Depositary Receipt (Common Stock) | 0,82 | 11,54 | 43,04 | 16,86 | 0,4917 | 0,0149 | |||
| ABNB / Airbnb, Inc. | 0,32 | −50,77 | 42,87 | −45,46 | 0,4898 | −0,5279 | |||
| LPLA / LPL Financial Holdings Inc. | 0,11 | 52,09 | 41,24 | 74,33 | 0,4711 | 0,1649 | |||
| AZN / AstraZeneca PLC - Depositary Receipt (Common Stock) | 0,59 | 41,22 | 0,4709 | 0,4709 | |||||
| HUBS / HubSpot, Inc. | 0,07 | −8,24 | 37,43 | −13,40 | 0,4276 | −0,0634 | |||
| CRM / Salesforce, Inc. | 0,13 | −60,39 | 34,79 | −59,75 | 0,3974 | −0,7215 | |||
| SBUX / Starbucks Corporation | 0,37 | −36,01 | 33,88 | −40,23 | 0,3870 | −0,3467 | |||
| KKR / KKR & Co. Inc. | 0,22 | −39,46 | 28,68 | −30,33 | 0,3277 | −0,2054 | |||
| CAVA / CAVA Group, Inc. | 0,23 | −30,96 | 19,17 | −32,70 | 0,2190 | −0,1498 | |||
| BSX / Boston Scientific Corporation | 0,14 | 14,79 | 0,1690 | 0,1690 | |||||
| IOT / Samsara Inc. | 0,00 | −100,00 | 0,00 | −100,00 | −0,2623 |