Grundläggande statistik
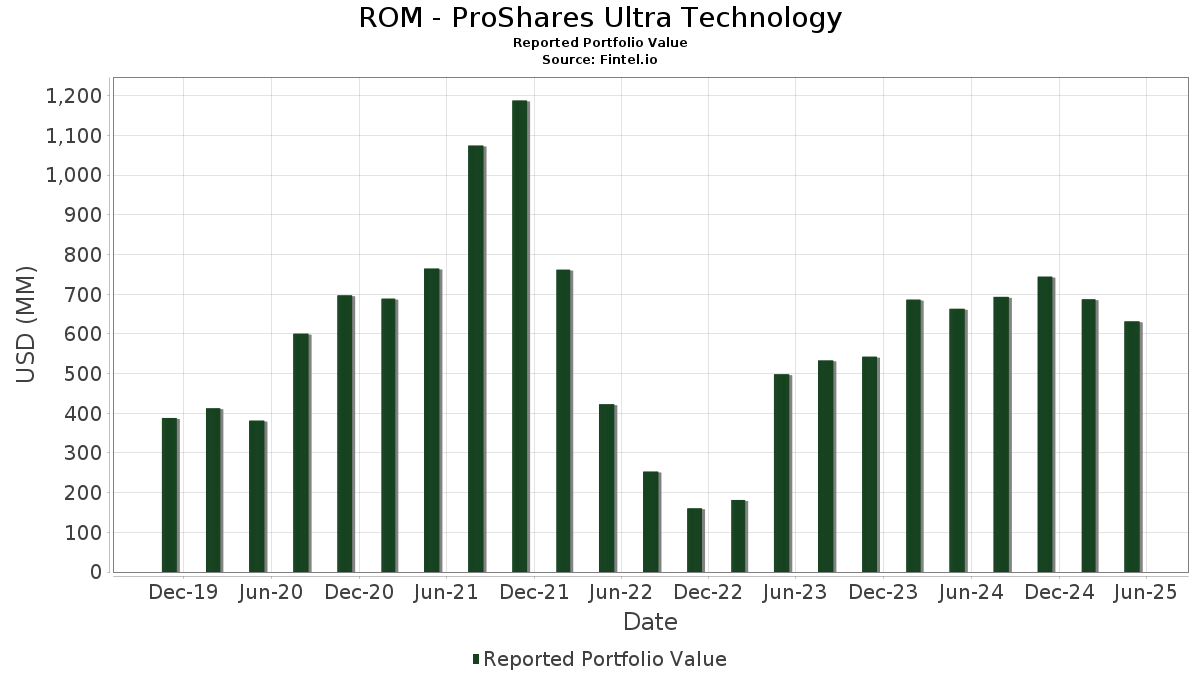
| Portföljvärde | $ 631 501 741 |
| Aktuella positioner | 88 |
Senaste innehav, resultat, förvaltat kapital (från 13F, 13D)
ROM - ProShares Ultra Technology har redovisat 88 totala innehav i sina senaste SEC-arkiveringar. Det senaste portföljvärdet beräknas vara $ 631 501 741 USD. Faktiskt förvaltade tillgångar (AUM) är detta värde plus likvida medel (som inte redovisas). ROM - ProShares Ultra Technologys största innehav är Microsoft Corporation (US:MSFT) , NVIDIA Corporation (US:NVDA) , Apple Inc. (US:AAPL) , Broadcom Inc. (US:AVGO) , and Palantir Technologies Inc. (US:PLTR) .
Största ökningarna detta kvartal
Vi använder förändringen i portföljallokeringen eftersom det är det mest meningsfulla måttet. Förändringar kan bero på transaktioner eller förändringar i aktiekurser.
| Värdepapper | Aktier (MM) |
Värde (MM$) |
Portfölj % av | ΔPortfölj % av |
|---|---|---|---|---|
| 74,91 | 11,8672 | 11,8672 | ||
| 24,99 | 3,9590 | 3,9590 | ||
| 24,98 | 3,9567 | 3,9567 | ||
| 14,67 | 2,3244 | 2,3244 | ||
| 9,55 | 1,5134 | 1,5134 | ||
| 9,21 | 1,4583 | 1,4583 | ||
| 8,88 | 1,4073 | 1,4073 | ||
| 0,15 | 67,20 | 10,6455 | 1,2028 | |
| 6,99 | 1,1080 | 1,1080 | ||
| 6,22 | 0,9851 | 0,9851 |
Största minskningarna detta kvartal
Vi använder förändringen i portföljallokeringen eftersom det är det mest meningsfulla måttet. Förändringar kan bero på transaktioner eller förändringar i aktiepriser.
| Värdepapper | Aktier (MM) |
Värde (MM$) |
Portfölj % av | ΔPortfölj % av |
|---|---|---|---|---|
| −17,01 | −2,6954 | −2,6954 | ||
| −15,53 | −2,4609 | −2,4609 | ||
| 0,29 | 59,22 | 9,3822 | −2,3130 | |
| −4,46 | −0,7059 | −0,7059 | ||
| 0,05 | 12,97 | 2,0548 | −0,3405 | |
| 0,03 | 10,12 | 1,6034 | −0,2294 | |
| 0,22 | 4,32 | 0,6846 | −0,1762 | |
| 0,06 | 8,20 | 1,2994 | −0,1703 | |
| 0,02 | 9,23 | 1,4617 | −0,1632 | |
| 0,05 | 8,50 | 1,3468 | −0,1576 |
13F- och fond arkiveringar
Denna blankett lämnades in den 2025-07-28 för rapporteringsperioden 2025-05-31. Klicka på länksymbolen för att se hela transaktionshistoriken.
Uppgradera för att låsa upp premiumdata och exportera till Excel![]() .
.
| Värdepapper | Typ | Genomsnittligt aktiepris | Aktier (MM) |
ΔAktier (%) |
ΔAktier (%) |
Värde ($MM) |
Portfölj (%) |
ΔPortfölj (%) |
|
|---|---|---|---|---|---|---|---|---|---|
| U.S. Treasury Bills / STIV (US912797LN52) | 74,91 | 11,8672 | 11,8672 | ||||||
| MSFT / Microsoft Corporation | 0,15 | −6,75 | 67,20 | 8,14 | 10,6455 | 1,2028 | |||
| NVDA / NVIDIA Corporation | 0,48 | −6,91 | 64,97 | 0,70 | 10,2920 | 0,4880 | |||
| AAPL / Apple Inc. | 0,29 | −7,34 | 59,22 | −23,05 | 9,3822 | −2,3130 | |||
| U.S. Treasury Bills / STIV (US912797NP82) | 24,99 | 3,9590 | 3,9590 | ||||||
| U.S. Treasury Bills / STIV (US912797PR21) | 24,98 | 3,9567 | 3,9567 | ||||||
| AVGO / Broadcom Inc. | 0,10 | −23,57 | 24,11 | −7,23 | 3,8200 | −0,1295 | |||
| Total Return Swap / DE (N/A) | 14,67 | 2,3244 | 2,3244 | ||||||
| PLTR / Palantir Technologies Inc. | 0,10 | −7,74 | 13,80 | 43,17 | 2,1858 | 0,7214 | |||
| ORCL / Oracle Corporation | 0,08 | −6,89 | 13,72 | −7,19 | 2,1727 | −0,0729 | |||
| CRM / Salesforce, Inc. | 0,05 | −7,64 | 12,97 | −17,71 | 2,0548 | −0,3405 | |||
| CSCO / Cisco Systems, Inc. | 0,20 | −7,83 | 12,82 | −9,37 | 2,0315 | −0,1185 | |||
| IBM / International Business Machines Corporation | 0,05 | −7,76 | 12,23 | −5,34 | 1,9382 | −0,0258 | |||
| INTU / Intuit Inc. | 0,01 | −7,92 | 10,77 | 13,03 | 1,7065 | 0,2583 | |||
| NOW / ServiceNow, Inc. | 0,01 | −7,68 | 10,64 | 0,40 | 1,6853 | 0,0752 | |||
| ACN / Accenture plc | 0,03 | −7,69 | 10,12 | −16,08 | 1,6034 | −0,2294 | |||
| Total Return Swap / DE (N/A) | 9,55 | 1,5134 | 1,5134 | ||||||
| ADBE / Adobe Inc. | 0,02 | −8,83 | 9,23 | −13,71 | 1,4617 | −0,1632 | |||
| Repurchase Agreement / RA (000000000) | 9,21 | 1,4583 | 1,4583 | ||||||
| AMD / Advanced Micro Devices, Inc. | 0,08 | −7,92 | 9,16 | 2,11 | 1,4513 | 0,0878 | |||
| Repurchase Agreement / RA (000000000) | 8,88 | 1,4073 | 1,4073 | ||||||
| TXN / Texas Instruments Incorporated | 0,05 | −7,96 | 8,50 | −14,13 | 1,3468 | −0,1576 | |||
| QCOM / QUALCOMM Incorporated | 0,06 | −8,20 | 8,20 | −15,19 | 1,2994 | −0,1703 | |||
| Total Return Swap / DE (N/A) | 6,99 | 1,1080 | 1,1080 | ||||||
| PANW / Palo Alto Networks, Inc. | 0,03 | −6,66 | 6,51 | −5,68 | 1,0308 | −0,0176 | |||
| AMAT / Applied Materials, Inc. | 0,04 | −9,05 | 6,51 | −9,80 | 1,0307 | −0,0654 | |||
| Repurchase Agreement / RA (000000000) | 6,22 | 0,9851 | 0,9851 | ||||||
| CRWD / CrowdStrike Holdings, Inc. | 0,01 | −2,31 | 5,93 | 18,18 | 0,9394 | 0,1769 | |||
| APH / Amphenol Corporation | 0,06 | −7,32 | 5,56 | 25,13 | 0,8812 | 0,2058 | |||
| ADI / Analog Devices, Inc. | 0,03 | −7,80 | 5,42 | −14,24 | 0,8589 | −0,1018 | |||
| MU / Micron Technology, Inc. | 0,06 | −7,41 | 5,37 | −6,59 | 0,8514 | −0,0229 | |||
| Repurchase Agreement / RA (000000000) | 5,33 | 0,8444 | 0,8444 | ||||||
| LRCX / Lam Research Corporation | 0,07 | −8,01 | 5,29 | −3,15 | 0,8387 | 0,0080 | |||
| KLAC / KLA Corporation | 0,01 | −8,42 | 5,14 | −2,23 | 0,8138 | 0,0155 | |||
| ANET / Arista Networks Inc | 0,05 | −7,77 | 4,57 | −14,13 | 0,7242 | −0,0847 | |||
| Repurchase Agreement / RA (000000000) | 4,44 | 0,7036 | 0,7036 | ||||||
| INTC / Intel Corporation | 0,22 | −7,40 | 4,32 | −23,72 | 0,6846 | −0,1762 | |||
| CDNS / Cadence Design Systems, Inc. | 0,01 | −7,73 | 4,02 | 5,76 | 0,6370 | 0,0592 | |||
| SNPS / Synopsys, Inc. | 0,01 | −7,08 | 3,66 | −5,71 | 0,5803 | −0,0101 | |||
| MSI / Motorola Solutions, Inc. | 0,01 | −7,67 | 3,55 | −12,88 | 0,5617 | −0,0567 | |||
| FTNT / Fortinet, Inc. | 0,03 | −7,77 | 3,31 | −13,09 | 0,5239 | −0,0543 | |||
| Total Return Swap / DE (N/A) | 3,31 | 0,5237 | 0,5237 | ||||||
| ADSK / Autodesk, Inc. | 0,01 | −7,82 | 3,25 | −0,46 | 0,5151 | 0,0188 | |||
| ROP / Roper Technologies, Inc. | 0,01 | −7,81 | 3,12 | −10,05 | 0,4948 | −0,0329 | |||
| Repurchase Agreement / RA (000000000) | 3,11 | 0,4925 | 0,4925 | ||||||
| WDAY / Workday, Inc. | 0,01 | −7,35 | 2,71 | −12,85 | 0,4289 | −0,0432 | |||
| Repurchase Agreement / RA (000000000) | 2,66 | 0,4222 | 0,4222 | ||||||
| NXPI / NXP Semiconductors N.V. | 0,01 | −7,79 | 2,48 | −18,25 | 0,3931 | −0,0682 | |||
| TE Connectivity plc / EC (IE000IVNQZ81) | 0,02 | −7,97 | 2,44 | −4,35 | 0,3864 | −0,0011 | |||
| FICO / Fair Isaac Corporation | 0,00 | −7,22 | 2,15 | −15,11 | 0,3410 | −0,0442 | |||
| CTSH / Cognizant Technology Solutions Corporation | 0,03 | −7,96 | 2,05 | −10,54 | 0,3241 | −0,0234 | |||
| GLW / Corning Incorporated | 0,04 | −7,69 | 1,95 | −8,74 | 0,3093 | −0,0157 | |||
| DELL / Dell Technologies Inc. | 0,02 | −6,35 | 1,77 | 1,37 | 0,2809 | 0,0152 | |||
| IT / Gartner, Inc. | 0,00 | −8,04 | 1,71 | −19,47 | 0,2713 | −0,0518 | |||
| MPWR / Monolithic Power Systems, Inc. | 0,00 | −9,28 | 1,62 | −1,70 | 0,2562 | 0,0061 | |||
| MCHP / Microchip Technology Incorporated | 0,03 | −7,61 | 1,59 | −8,86 | 0,2525 | −0,0134 | |||
| ANSS / ANSYS, Inc. | 0,00 | −7,59 | 1,48 | −8,26 | 0,2341 | −0,0107 | |||
| KEYS / Keysight Technologies, Inc. | 0,01 | −8,12 | 1,39 | −9,59 | 0,2197 | −0,0133 | |||
| GDDY / GoDaddy Inc. | 0,01 | −7,11 | 1,31 | −5,74 | 0,2081 | −0,0037 | |||
| STX / Seagate Technology Holdings plc | 0,01 | −7,68 | 1,28 | 6,87 | 0,2020 | 0,0206 | |||
| TYL / Tyler Technologies, Inc. | 0,00 | −8,00 | 1,26 | −12,73 | 0,1998 | −0,0199 | |||
| CDW / CDW Corporation | 0,01 | −7,79 | 1,23 | −6,69 | 0,1945 | −0,0054 | |||
| HPQ / HP Inc. | 0,05 | −10,24 | 1,19 | −27,63 | 0,1889 | −0,0614 | |||
| TDY / Teledyne Technologies Incorporated | 0,00 | −7,36 | 1,19 | −10,28 | 0,1881 | −0,0130 | |||
| HPE / Hewlett Packard Enterprise Company | 0,07 | −6,70 | 1,16 | −18,61 | 0,1836 | −0,0328 | |||
| VRSN / VeriSign, Inc. | 0,00 | −9,32 | 1,13 | 3,85 | 0,1794 | 0,0137 | |||
| PTC / PTC Inc. | 0,01 | −7,66 | 1,03 | −4,96 | 0,1639 | −0,0016 | |||
| NTAP / NetApp, Inc. | 0,01 | −8,33 | 1,03 | −8,94 | 0,1631 | −0,0087 | |||
| SMCI / Super Micro Computer, Inc. | 0,03 | −7,77 | 1,03 | −10,99 | 0,1631 | −0,0126 | |||
| JBL / Jabil Inc. | 0,01 | −10,41 | 0,94 | −2,79 | 0,1489 | 0,0019 | |||
| WDC / Western Digital Corporation | 0,02 | −7,22 | 0,92 | −2,24 | 0,1451 | 0,0027 | |||
| ON / ON Semiconductor Corporation | 0,02 | −8,77 | 0,90 | −18,56 | 0,1433 | −0,0254 | |||
| TRMB / Trimble Inc. | 0,01 | −7,11 | 0,89 | −8,02 | 0,1417 | −0,0061 | |||
| FSLR / First Solar, Inc. | 0,01 | −7,79 | 0,86 | 7,06 | 0,1369 | 0,0142 | |||
| FFIV / F5, Inc. | 0,00 | −8,77 | 0,84 | −10,92 | 0,1331 | −0,0103 | |||
| GEN / Gen Digital Inc. | 0,03 | −7,75 | 0,79 | −3,90 | 0,1250 | 0,0003 | |||
| ZBRA / Zebra Technologies Corporation | 0,00 | −8,02 | 0,76 | −15,46 | 0,1205 | −0,0161 | |||
| TER / Teradyne, Inc. | 0,01 | −7,91 | 0,65 | −34,11 | 0,1035 | −0,0472 | |||
| JNPR / Juniper Networks, Inc. | 0,02 | −7,78 | 0,61 | −8,45 | 0,0963 | −0,0046 | |||
| AKAM / Akamai Technologies, Inc. | 0,01 | −7,85 | 0,58 | −13,26 | 0,0923 | −0,0098 | |||
| SWKS / Skyworks Solutions, Inc. | 0,01 | −7,19 | 0,57 | −3,90 | 0,0898 | 0,0002 | |||
| EPAM / EPAM Systems, Inc. | 0,00 | −7,94 | 0,51 | −22,07 | 0,0801 | −0,0185 | |||
| Repurchase Agreement / RA (000000000) | 0,44 | 0,0704 | 0,0704 | ||||||
| ENPH / Enphase Energy, Inc. | 0,01 | −9,76 | 0,28 | −34,97 | 0,0443 | −0,0209 | |||
| Total Return Swap / DE (N/A) | −0,69 | −0,1100 | −0,1100 | ||||||
| Total Return Swap / DE (N/A) | −4,46 | −0,7059 | −0,7059 | ||||||
| Total Return Swap / DE (N/A) | −15,53 | −2,4609 | −2,4609 | ||||||
| Total Return Swap / DE (N/A) | −17,01 | −2,6954 | −2,6954 |