Grundläggande statistik
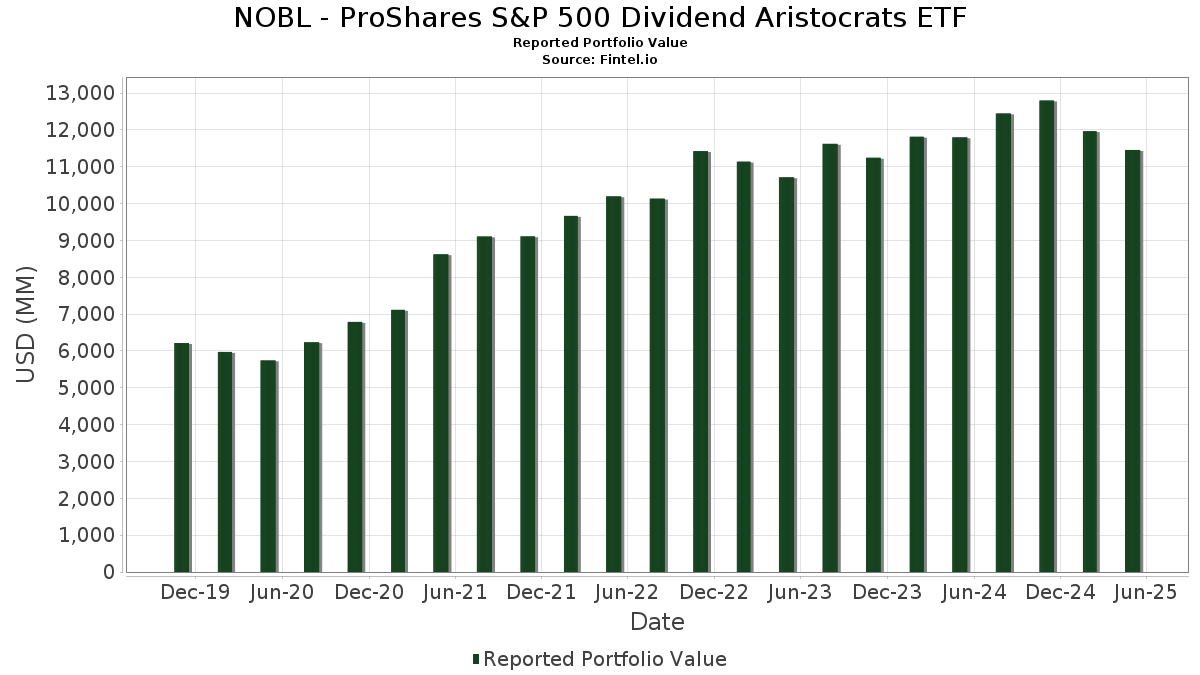
| Portföljvärde | $ 11 457 131 020 |
| Aktuella positioner | 78 |
Senaste innehav, resultat, förvaltat kapital (från 13F, 13D)
NOBL - ProShares S&P 500 Dividend Aristocrats ETF har redovisat 78 totala innehav i sina senaste SEC-arkiveringar. Det senaste portföljvärdet beräknas vara $ 11 457 131 020 USD. Faktiskt förvaltade tillgångar (AUM) är detta värde plus likvida medel (som inte redovisas). NOBL - ProShares S&P 500 Dividend Aristocrats ETFs största innehav är Emerson Electric Co. (US:EMR) , Caterpillar Inc. (US:CAT) , Franklin Resources, Inc. (US:BEN) , Cardinal Health, Inc. (US:CAH) , and Nordson Corporation (US:NDSN) .
Största ökningarna detta kvartal
Vi använder förändringen i portföljallokeringen eftersom det är det mest meningsfulla måttet. Förändringar kan bero på transaktioner eller förändringar i aktiekurser.
| Värdepapper | Aktier (MM) |
Värde (MM$) |
Portfölj % av | ΔPortfölj % av |
|---|---|---|---|---|
| 0,54 | 189,35 | 1,6500 | 0,4544 | |
| 0,74 | 155,53 | 1,3552 | 0,4010 | |
| 1,59 | 190,07 | 1,6562 | 0,3368 | |
| 1,83 | 181,86 | 1,5847 | 0,2890 | |
| 0,16 | 176,34 | 1,5365 | 0,2465 | |
| 0,87 | 184,65 | 1,6089 | 0,2426 | |
| 8,75 | 189,33 | 1,6497 | 0,2215 | |
| 1,58 | 175,08 | 1,5256 | 0,2199 | |
| 1,86 | 173,79 | 1,5143 | 0,2027 | |
| 1,20 | 184,82 | 1,6105 | 0,1864 |
Största minskningarna detta kvartal
Vi använder förändringen i portföljallokeringen eftersom det är det mest meningsfulla måttet. Förändringar kan bero på transaktioner eller förändringar i aktiepriser.
| Värdepapper | Aktier (MM) |
Värde (MM$) |
Portfölj % av | ΔPortfölj % av |
|---|---|---|---|---|
| 0,39 | 140,10 | 1,2208 | −0,3466 | |
| 1,43 | 149,37 | 1,3015 | −0,2861 | |
| 0,91 | 169,11 | 1,4735 | −0,2653 | |
| 2,19 | 158,22 | 1,3787 | −0,2508 | |
| 1,36 | 153,65 | 1,3389 | −0,2455 | |
| 2,10 | 152,75 | 1,3310 | −0,2319 | |
| 1,44 | 157,20 | 1,3698 | −0,2246 | |
| 0,02 | 0,02 | 0,0002 | −0,2187 | |
| 1,04 | 160,67 | 1,4001 | −0,1924 | |
| 1,01 | 155,91 | 1,3585 | −0,1865 |
13F- och fond arkiveringar
Denna blankett lämnades in den 2025-07-28 för rapporteringsperioden 2025-05-31. Klicka på länksymbolen för att se hela transaktionshistoriken.
Uppgradera för att låsa upp premiumdata och exportera till Excel![]() .
.
| Värdepapper | Typ | Genomsnittligt aktiepris | Aktier (MM) |
ΔAktier (%) |
ΔAktier (%) |
Värde ($MM) |
Portfölj (%) |
ΔPortfölj (%) |
|
|---|---|---|---|---|---|---|---|---|---|
| EMR / Emerson Electric Co. | 1,59 | 22,70 | 190,07 | 20,45 | 1,6562 | 0,3368 | |||
| CAT / Caterpillar Inc. | 0,54 | 30,87 | 189,35 | 32,43 | 1,6500 | 0,4544 | |||
| BEN / Franklin Resources, Inc. | 8,75 | 3,72 | 189,33 | 10,84 | 1,6497 | 0,2215 | |||
| CAH / Cardinal Health, Inc. | 1,20 | −9,02 | 184,82 | 8,52 | 1,6105 | 0,1864 | |||
| NDSN / Nordson Corporation | 0,87 | 12,08 | 184,65 | 12,99 | 1,6089 | 0,2426 | |||
| PNR / Pentair plc | 1,83 | 11,46 | 181,86 | 17,35 | 1,5847 | 0,2890 | |||
| CINF / Cincinnati Financial Corporation | 1,20 | −2,80 | 181,01 | −0,82 | 1,5773 | 0,0512 | |||
| ES / Eversource Energy | 2,78 | −7,75 | 179,89 | −5,12 | 1,5675 | −0,0177 | |||
| ECL / Ecolab Inc. | 0,68 | −3,42 | 179,59 | −4,64 | 1,5649 | −0,0097 | |||
| ADP / Automatic Data Processing, Inc. | 0,55 | −3,87 | 178,41 | −0,71 | 1,5546 | 0,0523 | |||
| SWK / Stanley Black & Decker, Inc. | 2,72 | 41,56 | 178,05 | 7,04 | 1,5514 | 0,1607 | |||
| GWW / W.W. Grainger, Inc. | 0,16 | 7,31 | 176,34 | 14,29 | 1,5365 | 0,2465 | |||
| SPGI / S&P Global Inc. | 0,34 | 3,72 | 175,48 | −0,33 | 1,5290 | 0,0569 | |||
| CTAS / Cintas Corporation | 0,77 | −9,78 | 175,44 | −1,52 | 1,5287 | 0,0393 | |||
| GPC / Genuine Parts Company | 1,39 | −4,17 | 175,26 | −2,91 | 1,5271 | 0,0178 | |||
| PPG / PPG Industries, Inc. | 1,58 | 14,56 | 175,08 | 12,12 | 1,5256 | 0,2199 | |||
| SHW / The Sherwin-Williams Company | 0,49 | 3,23 | 174,28 | 2,24 | 1,5186 | 0,0934 | |||
| TROW / T. Rowe Price Group, Inc. | 1,86 | 25,14 | 173,79 | 10,78 | 1,5143 | 0,2027 | |||
| KMB / Kimberly-Clark Corporation | 1,21 | −8,62 | 173,37 | −7,49 | 1,5107 | −0,0563 | |||
| FDS / FactSet Research Systems Inc. | 0,38 | 4,23 | 173,28 | 3,44 | 1,5099 | 0,1093 | |||
| DOV / Dover Corporation | 0,97 | 13,42 | 171,93 | 1,43 | 1,4981 | 0,0808 | |||
| CHRW / C.H. Robinson Worldwide, Inc. | 1,78 | 13,34 | 170,43 | 7,04 | 1,4850 | 0,1538 | |||
| IBM / International Business Machines Corporation | 0,66 | −13,07 | 169,76 | −10,79 | 1,4793 | −0,1118 | |||
| APD / Air Products and Chemicals, Inc. | 0,61 | 18,09 | 169,52 | 4,18 | 1,4771 | 0,1167 | |||
| EXPD / Expeditors International of Washington, Inc. | 1,50 | 0,17 | 169,36 | −3,78 | 1,4758 | 0,0041 | |||
| ABBV / AbbVie Inc. | 0,91 | −8,67 | 169,11 | −18,69 | 1,4735 | −0,2653 | |||
| NEE / NextEra Energy, Inc. | 2,39 | 2,79 | 168,95 | 3,48 | 1,4722 | 0,1070 | |||
| GD / General Dynamics Corporation | 0,61 | −4,81 | 168,61 | 4,94 | 1,4692 | 0,1258 | |||
| CB / Chubb Limited | 0,57 | −11,01 | 168,06 | −7,35 | 1,4644 | −0,0523 | |||
| LIN / Linde plc | 0,36 | −6,96 | 167,83 | −6,86 | 1,4624 | −0,0441 | |||
| KVUE / Kenvue Inc. | 7,01 | −14,01 | 167,39 | −13,03 | 1,4585 | −0,1506 | |||
| WMT / Walmart Inc. | 1,69 | −5,26 | 167,25 | −5,16 | 1,4574 | −0,0171 | |||
| LOW / Lowe's Companies, Inc. | 0,74 | 14,33 | 166,80 | 3,79 | 1,4534 | 0,1098 | |||
| ITW / Illinois Tool Works Inc. | 0,68 | 4,25 | 166,59 | −3,21 | 1,4516 | 0,0125 | |||
| ROP / Roper Technologies, Inc. | 0,29 | −8,46 | 166,47 | −10,69 | 1,4506 | −0,1080 | |||
| FAST / Fastenal Company | 4,01 | 78,83 | 165,87 | −2,38 | 1,4453 | 0,0247 | |||
| ABT / Abbott Laboratories | 1,24 | −8,56 | 165,51 | −11,50 | 1,4422 | −0,1214 | |||
| PG / The Procter & Gamble Company | 0,97 | −5,99 | 164,92 | −8,13 | 1,4370 | −0,0638 | |||
| ESS / Essex Property Trust, Inc. | 0,58 | −4,78 | 164,84 | −13,23 | 1,4363 | −0,1521 | |||
| TGT / Target Corporation | 1,75 | 42,10 | 164,18 | 7,53 | 1,4306 | 0,1540 | |||
| FRT / Federal Realty Investment Trust | 1,70 | 6,85 | 162,28 | −3,22 | 1,4140 | 0,0120 | |||
| AOS / A. O. Smith Corporation | 2,52 | 5,00 | 162,16 | 1,57 | 1,4130 | 0,0782 | |||
| ADM / Archer-Daniels-Midland Company | 3,34 | −0,35 | 161,39 | 1,91 | 1,4063 | 0,0822 | |||
| ALB / Albemarle Corporation | 2,89 | 51,50 | 161,28 | 9,67 | 1,4054 | 0,1757 | |||
| SYY / Sysco Corporation | 2,21 | −2,61 | 161,13 | −5,89 | 1,4040 | −0,0275 | |||
| CVX / Chevron Corporation | 1,18 | 8,12 | 160,92 | −6,82 | 1,4022 | −0,0417 | |||
| JNJ / Johnson & Johnson | 1,04 | −10,31 | 160,67 | −15,64 | 1,4001 | −0,1924 | |||
| HRL / Hormel Foods Corporation | 5,22 | −4,85 | 160,20 | 1,96 | 1,3959 | 0,0823 | |||
| MDT / Medtronic plc | 1,92 | 2,24 | 159,41 | −7,80 | 1,3891 | −0,0566 | |||
| CL / Colgate-Palmolive Company | 1,71 | −11,15 | 159,24 | −9,42 | 1,3876 | −0,0823 | |||
| MCD / McDonald's Corporation | 0,51 | −14,92 | 158,53 | −13,39 | 1,3813 | −0,1491 | |||
| KO / The Coca-Cola Company | 2,19 | −19,82 | 158,22 | −18,82 | 1,3787 | −0,2508 | |||
| NUE / Nucor Corporation | 1,44 | 3,63 | 157,20 | −17,56 | 1,3698 | −0,2246 | |||
| O / Realty Income Corporation | 2,77 | −11,14 | 156,91 | −11,78 | 1,3672 | −0,1198 | |||
| ATO / Atmos Energy Corporation | 1,01 | −17,02 | 155,91 | −15,63 | 1,3585 | −0,1865 | |||
| WST / West Pharmaceutical Services, Inc. | 0,74 | 50,17 | 155,53 | 36,28 | 1,3552 | 0,4010 | |||
| BFB / Brown-Forman Corp. - Class B | 4,65 | −6,88 | 155,11 | −6,23 | 1,3516 | −0,0315 | |||
| CHD / Church & Dwight Co., Inc. | 1,58 | −1,23 | 154,87 | −12,68 | 1,3495 | −0,1334 | |||
| SJM / The J. M. Smucker Company | 1,37 | −16,29 | 154,04 | −14,71 | 1,3422 | −0,1678 | |||
| AMCR / Amcor plc | 16,90 | −2,67 | 153,96 | −12,38 | 1,3415 | −0,1276 | |||
| BRO / Brown & Brown, Inc. | 1,36 | −14,86 | 153,65 | −18,92 | 1,3389 | −0,2455 | |||
| AFL / Aflac Incorporated | 1,48 | −8,13 | 153,62 | −13,11 | 1,3386 | −0,1396 | |||
| XOM / Exxon Mobil Corporation | 1,50 | −3,92 | 153,29 | −11,72 | 1,3357 | −0,1160 | |||
| MKC / McCormick & Company, Incorporated | 2,10 | −7,19 | 152,75 | −18,29 | 1,3310 | −0,2319 | |||
| CLX / The Clorox Company | 1,16 | 8,71 | 152,54 | −8,33 | 1,3291 | −0,0621 | |||
| ED / Consolidated Edison, Inc. | 1,43 | −23,58 | 149,37 | −21,34 | 1,3015 | −0,2861 | |||
| PEP / PepsiCo, Inc. | 1,13 | −0,48 | 148,66 | −14,76 | 1,2954 | −0,1629 | |||
| ERIE / Erie Indemnity Company | 0,39 | −10,76 | 140,10 | −25,26 | 1,2208 | −0,3466 | |||
| BDX / Becton, Dickinson and Company | 0,80 | 14,25 | 137,26 | −12,57 | 1,1960 | −0,1166 | |||
| Repurchase Agreement / RA (000000000) | 0,90 | 0,0078 | 0,0078 | ||||||
| Repurchase Agreement / RA (000000000) | 0,86 | 0,0075 | 0,0075 | ||||||
| Repurchase Agreement / RA (000000000) | 0,61 | 0,0053 | 0,0053 | ||||||
| Repurchase Agreement / RA (000000000) | 0,52 | 0,0045 | 0,0045 | ||||||
| Repurchase Agreement / RA (000000000) | 0,43 | 0,0038 | 0,0038 | ||||||
| Repurchase Agreement / RA (000000000) | 0,30 | 0,0026 | 0,0026 | ||||||
| Repurchase Agreement / RA (000000000) | 0,30 | 0,0026 | 0,0026 | ||||||
| Repurchase Agreement / RA (000000000) | 0,26 | 0,0023 | 0,0023 | ||||||
| US8252528851 / Invesco Government & Agency Portfolio, Institutional Class | 0,02 | −99,92 | 0,02 | −99,92 | 0,0002 | −0,2187 |