Grundläggande statistik
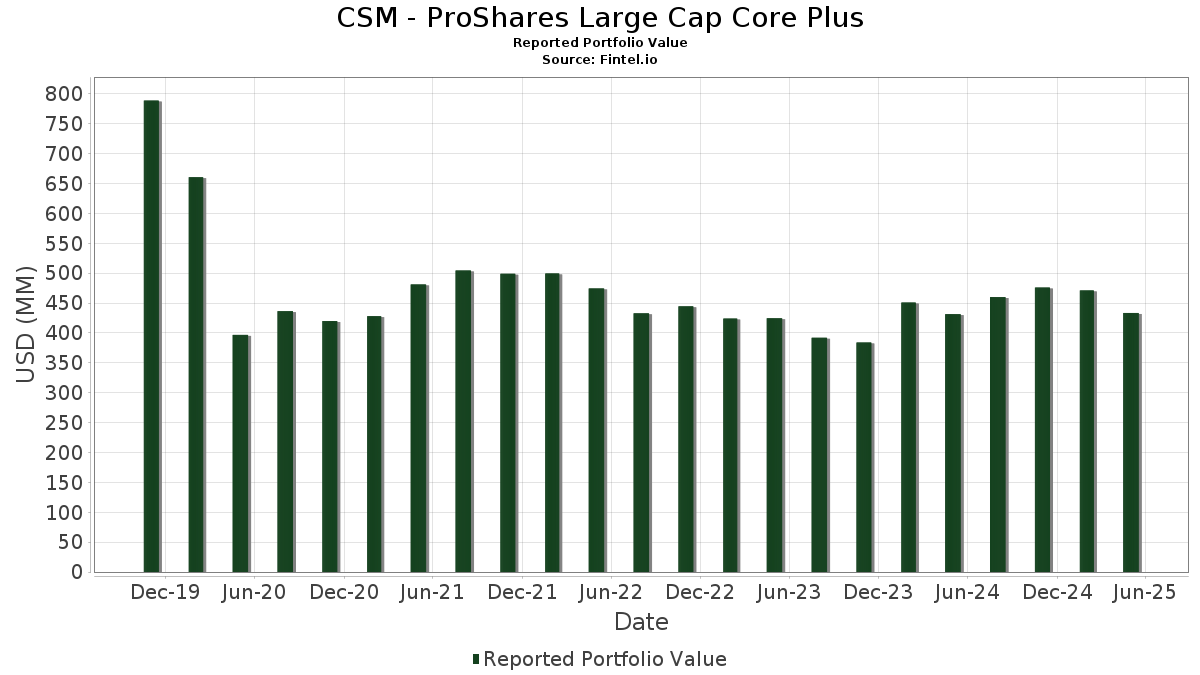
| Portföljvärde | $ 433 449 205 |
| Aktuella positioner | 307 |
Senaste innehav, resultat, förvaltat kapital (från 13F, 13D)
CSM - ProShares Large Cap Core Plus har redovisat 307 totala innehav i sina senaste SEC-arkiveringar. Det senaste portföljvärdet beräknas vara $ 433 449 205 USD. Faktiskt förvaltade tillgångar (AUM) är detta värde plus likvida medel (som inte redovisas). CSM - ProShares Large Cap Core Pluss största innehav är Microsoft Corporation (US:MSFT) , NVIDIA Corporation (US:NVDA) , Apple Inc. (US:AAPL) , Amazon.com, Inc. (US:AMZN) , and Meta Platforms, Inc. (US:META) . CSM - ProShares Large Cap Core Pluss nya positioner inkluderar Expand Energy Corporation (US:EXE) , Axon Enterprise, Inc. (US:AXON) , Labcorp Holdings Inc. (DE:N6B) , .
Största ökningarna detta kvartal
Vi använder förändringen i portföljallokeringen eftersom det är det mest meningsfulla måttet. Förändringar kan bero på transaktioner eller förändringar i aktiekurser.
| Värdepapper | Aktier (MM) |
Värde (MM$) |
Portfölj % av | ΔPortfölj % av |
|---|---|---|---|---|
| 5,61 | 1,2927 | 1,2927 | ||
| 5,41 | 1,2474 | 1,2474 | ||
| 4,11 | 0,9483 | 0,9483 | ||
| 3,84 | 0,8850 | 0,8850 | ||
| 3,79 | 0,8732 | 0,8732 | ||
| 3,25 | 0,7485 | 0,7485 | ||
| 0,04 | 20,30 | 4,6793 | 0,7149 | |
| 2,71 | 0,6237 | 0,6237 | ||
| 0,07 | 3,14 | 0,7231 | 0,5689 | |
| 1,89 | 0,4366 | 0,4366 |
Största minskningarna detta kvartal
Vi använder förändringen i portföljallokeringen eftersom det är det mest meningsfulla måttet. Förändringar kan bero på transaktioner eller förändringar i aktiepriser.
| Värdepapper | Aktier (MM) |
Värde (MM$) |
Portfölj % av | ΔPortfölj % av |
|---|---|---|---|---|
| −4,10 | −0,9459 | −0,9459 | ||
| 0,09 | 17,81 | 4,1045 | −0,8514 | |
| −3,69 | −0,8510 | −0,8510 | ||
| 0,00 | 0,00 | −0,3765 | ||
| 0,00 | 0,16 | 0,0364 | −0,3539 | |
| 0,00 | 0,32 | 0,0731 | −0,3499 | |
| 0,00 | 0,15 | 0,0340 | −0,2412 | |
| 0,00 | 0,18 | 0,0410 | −0,2139 | |
| 0,00 | 0,51 | 0,1182 | −0,2057 | |
| 0,00 | 0,27 | 0,0613 | −0,2039 |
13F- och fond arkiveringar
Denna blankett lämnades in den 2025-07-28 för rapporteringsperioden 2025-05-31. Klicka på länksymbolen för att se hela transaktionshistoriken.
Uppgradera för att låsa upp premiumdata och exportera till Excel![]() .
.
| Värdepapper | Typ | Genomsnittligt aktiepris | Aktier (MM) |
ΔAktier (%) |
ΔAktier (%) |
Värde ($MM) |
Portfölj (%) |
ΔPortfölj (%) |
|
|---|---|---|---|---|---|---|---|---|---|
| MSFT / Microsoft Corporation | 0,04 | −6,24 | 20,30 | 8,72 | 4,6793 | 0,7149 | |||
| NVDA / NVIDIA Corporation | 0,14 | −7,73 | 19,43 | −0,18 | 4,4797 | 0,3459 | |||
| AAPL / Apple Inc. | 0,09 | −8,15 | 17,81 | −23,71 | 4,1045 | −0,8514 | |||
| AMZN / Amazon.com, Inc. | 0,05 | −8,18 | 11,03 | −11,32 | 2,5417 | −0,0985 | |||
| META / Meta Platforms, Inc. | 0,01 | 11,22 | 9,25 | 7,77 | 2,1326 | 0,3099 | |||
| AVGO / Broadcom Inc. | 0,03 | −6,18 | 6,24 | 13,88 | 1,4394 | 0,2752 | |||
| Repurchase Agreement / RA (000000000) | 5,61 | 1,2927 | 1,2927 | ||||||
| Repurchase Agreement / RA (000000000) | 5,41 | 1,2474 | 1,2474 | ||||||
| GOOGL / Alphabet Inc. | 0,03 | −9,53 | 5,05 | −8,74 | 1,1649 | −0,0110 | |||
| BRK.B / Berkshire Hathaway Inc. | 0,01 | −1,26 | 4,72 | −3,16 | 1,0877 | 0,0532 | |||
| TSLA / Tesla, Inc. | 0,01 | −17,52 | 4,66 | −2,47 | 1,0752 | 0,0599 | |||
| LLY / Eli Lilly and Company | 0,01 | 51,78 | 4,18 | 21,64 | 0,9630 | 0,2337 | |||
| Total Return Swap / DE (N/A) | 4,11 | 0,9483 | 0,9483 | ||||||
| GOOG / Alphabet Inc. | 0,02 | −9,52 | 3,90 | −9,18 | 0,8982 | −0,0129 | |||
| Total Return Swap / DE (N/A) | 3,84 | 0,8850 | 0,8850 | ||||||
| Repurchase Agreement / RA (000000000) | 3,79 | 0,8732 | 0,8732 | ||||||
| JPM / JPMorgan Chase & Co. | 0,01 | −8,60 | 3,38 | −8,81 | 0,7799 | −0,0080 | |||
| Repurchase Agreement / RA (000000000) | 3,25 | 0,7485 | 0,7485 | ||||||
| BAC / Bank of America Corporation | 0,07 | 351,31 | 3,14 | 331,96 | 0,7231 | 0,5689 | |||
| V / Visa Inc. | 0,01 | −4,21 | 2,71 | −3,56 | 0,6245 | 0,0281 | |||
| Repurchase Agreement / RA (000000000) | 2,71 | 0,6237 | 0,6237 | ||||||
| UNH / UnitedHealth Group Incorporated | 0,01 | 114,28 | 2,67 | 36,21 | 0,6150 | 0,1991 | |||
| PLTR / Palantir Technologies Inc. | 0,02 | 0,04 | 2,61 | 55,27 | 0,6011 | 0,2444 | |||
| CRM / Salesforce, Inc. | 0,01 | −8,20 | 2,53 | −18,20 | 0,5823 | −0,0735 | |||
| GS / The Goldman Sachs Group, Inc. | 0,00 | −28,02 | 2,49 | 26,52 | 0,5742 | 0,0727 | |||
| INTU / Intuit Inc. | 0,00 | −10,32 | 2,44 | 10,10 | 0,5628 | 0,0918 | |||
| ADBE / Adobe Inc. | 0,01 | 29,58 | 2,43 | 22,68 | 0,5601 | 0,1394 | |||
| UBER / Uber Technologies, Inc. | 0,03 | −16,25 | 2,28 | −7,31 | 0,5263 | 0,0035 | |||
| MRK / Merck & Co., Inc. | 0,03 | −11,79 | 2,25 | −26,54 | 0,5195 | −0,1318 | |||
| SPGI / S&P Global Inc. | 0,00 | −7,55 | 2,24 | −11,17 | 0,5171 | −0,0190 | |||
| PGR / The Progressive Corporation | 0,01 | −17,35 | 2,21 | −16,52 | 0,5094 | −0,0525 | |||
| PEP / PepsiCo, Inc. | 0,02 | 67,47 | 2,13 | 43,47 | 0,4917 | 0,1759 | |||
| ADP / Automatic Data Processing, Inc. | 0,01 | 162,85 | 2,08 | 171,54 | 0,4795 | 0,3168 | |||
| GE / General Electric Company | 0,01 | −8,19 | 2,06 | 9,07 | 0,4740 | 0,0737 | |||
| APH / Amphenol Corporation | 0,02 | −15,75 | 2,04 | 13,73 | 0,4699 | 0,0894 | |||
| ISRG / Intuitive Surgical, Inc. | 0,00 | 376,18 | 2,01 | 359,73 | 0,4632 | 0,3702 | |||
| NFLX / Netflix, Inc. | 0,00 | 8,31 | 1,98 | 33,38 | 0,4570 | 0,1413 | |||
| PFE / Pfizer Inc. | 0,08 | 15,28 | 1,98 | 2,44 | 0,4557 | 0,0460 | |||
| MU / Micron Technology, Inc. | 0,02 | −8,88 | 1,92 | −8,09 | 0,4430 | −0,0009 | |||
| Repurchase Agreement / RA (000000000) | 1,89 | 0,4366 | 0,4366 | ||||||
| MDT / Medtronic plc | 0,02 | 62,79 | 1,88 | 46,83 | 0,4330 | 0,1613 | |||
| TT / Trane Technologies plc | 0,00 | −12,11 | 1,88 | 6,89 | 0,4326 | 0,0599 | |||
| TMUS / T-Mobile US, Inc. | 0,01 | −10,92 | 1,88 | −20,01 | 0,4323 | −0,0654 | |||
| XOM / Exxon Mobil Corporation | 0,02 | −8,18 | 1,87 | −15,60 | 0,4316 | −0,0396 | |||
| QCOM / QUALCOMM Incorporated | 0,01 | −8,18 | 1,86 | −15,17 | 0,4293 | −0,0368 | |||
| PH / Parker-Hannifin Corporation | 0,00 | −5,41 | 1,84 | −5,95 | 0,4231 | 0,0087 | |||
| JNJ / Johnson & Johnson | 0,01 | −8,18 | 1,82 | −13,63 | 0,4194 | −0,0279 | |||
| NRG / NRG Energy, Inc. | 0,01 | −21,58 | 1,80 | 15,66 | 0,4139 | 0,0843 | |||
| RCL / Royal Caribbean Cruises Ltd. | 0,01 | −3,28 | 1,77 | 1,03 | 0,4071 | 0,0358 | |||
| COP / ConocoPhillips | 0,02 | −8,25 | 1,76 | −21,05 | 0,4057 | −0,0674 | |||
| CTAS / Cintas Corporation | 0,01 | −15,11 | 1,75 | −7,31 | 0,4037 | 0,0024 | |||
| MA / Mastercard Incorporated | 0,00 | −7,83 | 1,75 | −6,37 | 0,4036 | 0,0067 | |||
| HWM / Howmet Aerospace Inc. | 0,01 | −24,29 | 1,74 | −5,84 | 0,4012 | 0,0088 | |||
| SO / The Southern Company | 0,02 | −18,93 | 1,72 | −18,73 | 0,3961 | −0,0529 | |||
| COST / Costco Wholesale Corporation | 0,00 | −4,51 | 1,68 | −5,31 | 0,3863 | 0,0107 | |||
| ETN / Eaton Corporation plc | 0,01 | −21,41 | 1,66 | −14,20 | 0,3830 | −0,0282 | |||
| MSI / Motorola Solutions, Inc. | 0,00 | 80,12 | 1,64 | 70,01 | 0,3791 | 0,1736 | |||
| Repurchase Agreement / RA (000000000) | 1,62 | 0,3742 | 0,3742 | ||||||
| ALL / The Allstate Corporation | 0,01 | −16,94 | 1,60 | −12,46 | 0,3678 | −0,0192 | |||
| CCL / Carnival Corporation & plc | 0,07 | 14,63 | 1,58 | 11,22 | 0,3635 | 0,0625 | |||
| PG / The Procter & Gamble Company | 0,01 | −8,17 | 1,58 | −10,26 | 0,3632 | −0,0096 | |||
| BDX / Becton, Dickinson and Company | 0,01 | 12,89 | 1,56 | −13,64 | 0,3607 | −0,0239 | |||
| ITW / Illinois Tool Works Inc. | 0,01 | −11,71 | 1,56 | −18,08 | 0,3596 | −0,0445 | |||
| AMP / Ameriprise Financial, Inc. | 0,00 | −8,20 | 1,54 | −13,00 | 0,3549 | −0,0208 | |||
| OKE / ONEOK, Inc. | 0,02 | 89,85 | 1,54 | 52,88 | 0,3546 | 0,1409 | |||
| RSG / Republic Services, Inc. | 0,01 | −19,89 | 1,53 | −13,03 | 0,3524 | −0,0209 | |||
| CTSH / Cognizant Technology Solutions Corporation | 0,02 | −2,99 | 1,50 | −5,71 | 0,3464 | 0,0080 | |||
| WMT / Walmart Inc. | 0,02 | −4,06 | 1,50 | −3,97 | 0,3456 | 0,0142 | |||
| BMY / Bristol-Myers Squibb Company | 0,03 | −16,84 | 1,50 | −32,69 | 0,3453 | −0,1270 | |||
| CVS / CVS Health Corporation | 0,02 | −21,44 | 1,50 | −23,44 | 0,3449 | −0,0701 | |||
| ZBRA / Zebra Technologies Corporation | 0,01 | 19,18 | 1,48 | 9,64 | 0,3408 | 0,0544 | |||
| MPWR / Monolithic Power Systems, Inc. | 0,00 | 59,54 | 1,47 | 72,97 | 0,3393 | 0,1585 | |||
| KDP / Keurig Dr Pepper Inc. | 0,04 | −3,71 | 1,47 | −3,29 | 0,3390 | 0,0162 | |||
| STX / Seagate Technology Holdings plc | 0,01 | −8,18 | 1,47 | 6,29 | 0,3389 | 0,0452 | |||
| MET / MetLife, Inc. | 0,02 | −8,18 | 1,47 | −16,31 | 0,3386 | −0,0339 | |||
| RL / Ralph Lauren Corporation | 0,01 | −1,63 | 1,47 | 0,48 | 0,3385 | 0,0280 | |||
| HIG / The Hartford Insurance Group, Inc. | 0,01 | −13,76 | 1,46 | −5,30 | 0,3376 | 0,0091 | |||
| GEHC / GE HealthCare Technologies Inc. | 0,02 | 232,24 | 1,46 | 168,44 | 0,3373 | 0,2215 | |||
| CAH / Cardinal Health, Inc. | 0,01 | −24,61 | 1,45 | −10,08 | 0,3353 | −0,0082 | |||
| F / Ford Motor Company | 0,14 | −21,63 | 1,45 | −14,79 | 0,3334 | −0,0271 | |||
| EQT / EQT Corporation | 0,03 | 248,66 | 1,44 | 345,06 | 0,3326 | 0,2507 | |||
| URI / United Rentals, Inc. | 0,00 | −11,45 | 1,44 | −2,31 | 0,3320 | 0,0188 | |||
| RMD / ResMed Inc. | 0,01 | −9,24 | 1,44 | −4,89 | 0,3316 | 0,0106 | |||
| EXE / Expand Energy Corporation | 0,01 | 1,44 | 0,3311 | 0,3311 | |||||
| STT / State Street Corporation | 0,01 | −8,18 | 1,42 | −10,94 | 0,3285 | −0,0111 | |||
| TRGP / Targa Resources Corp. | 0,01 | 7,84 | 1,42 | −15,59 | 0,3273 | −0,0298 | |||
| IT / Gartner, Inc. | 0,00 | −39,45 | 1,42 | −7,38 | 0,3272 | −0,0170 | |||
| RJF / Raymond James Financial, Inc. | 0,01 | −1,50 | 1,42 | −6,41 | 0,3268 | 0,0052 | |||
| MTD / Mettler-Toledo International Inc. | 0,00 | 61,64 | 1,41 | 46,78 | 0,3255 | 0,1212 | |||
| FOXA / Fox Corporation | 0,03 | −1,12 | 1,40 | −5,71 | 0,3237 | 0,0076 | |||
| STE / STERIS plc | 0,01 | −17,44 | 1,40 | −7,66 | 0,3224 | 0,0008 | |||
| PTC / PTC Inc. | 0,01 | −8,83 | 1,40 | −6,17 | 0,3223 | 0,0058 | |||
| CINF / Cincinnati Financial Corporation | 0,01 | −16,28 | 1,40 | −14,57 | 0,3217 | −0,0252 | |||
| FFIV / F5, Inc. | 0,00 | −0,49 | 1,39 | −2,92 | 0,3216 | 0,0166 | |||
| BRO / Brown & Brown, Inc. | 0,01 | −14,35 | 1,39 | −18,43 | 0,3215 | −0,0415 | |||
| PKG / Packaging Corporation of America | 0,01 | 642,28 | 1,39 | 586,21 | 0,3213 | 0,2772 | |||
| SWK / Stanley Black & Decker, Inc. | 0,02 | 44,92 | 1,39 | 9,60 | 0,3211 | 0,0512 | |||
| ACGL / Arch Capital Group Ltd. | 0,01 | −18,56 | 1,39 | −16,67 | 0,3205 | −0,0338 | |||
| PRU / Prudential Financial, Inc. | 0,01 | −10,21 | 1,39 | −18,96 | 0,3203 | −0,0437 | |||
| TE Connectivity plc / EC (IE000IVNQZ81) | 0,01 | −8,17 | 1,39 | −4,55 | 0,3196 | 0,0111 | |||
| KR / The Kroger Co. | 0,02 | −22,25 | 1,38 | −18,20 | 0,3171 | −0,0398 | |||
| EXPD / Expeditors International of Washington, Inc. | 0,01 | 50,19 | 1,37 | 63,80 | 0,3162 | 0,1515 | |||
| NTRS / Northern Trust Corporation | 0,01 | −8,18 | 1,37 | −11,11 | 0,3155 | −0,0113 | |||
| NVR / NVR, Inc. | 0,00 | −7,25 | 1,37 | −8,87 | 0,3150 | −0,0035 | |||
| CBRE / CBRE Group, Inc. | 0,01 | −8,18 | 1,36 | −19,12 | 0,3140 | −0,0436 | |||
| XEL / Xcel Energy Inc. | 0,02 | −19,39 | 1,36 | −21,65 | 0,3140 | −0,0550 | |||
| LYV / Live Nation Entertainment, Inc. | 0,01 | 42,22 | 1,36 | 36,14 | 0,3135 | 0,1013 | |||
| AVB / AvalonBay Communities, Inc. | 0,01 | −10,52 | 1,36 | −18,23 | 0,3125 | −0,0394 | |||
| EIX / Edison International | 0,02 | −19,15 | 1,35 | −17,31 | 0,3117 | −0,0357 | |||
| OTIS / Otis Worldwide Corporation | 0,01 | −8,62 | 1,35 | −12,68 | 0,3113 | −0,0171 | |||
| VTR / Ventas, Inc. | 0,02 | −18,28 | 1,35 | −24,07 | 0,3106 | −0,0661 | |||
| EQR / Equity Residential | 0,02 | −10,41 | 1,34 | −15,28 | 0,3094 | −0,0270 | |||
| NEM / Newmont Corporation | 0,03 | −34,37 | 1,33 | −19,24 | 0,3059 | −0,0430 | |||
| BIIB / Biogen Inc. | 0,01 | 152,82 | 1,33 | 133,69 | 0,3056 | 0,1851 | |||
| EXC / Exelon Corporation | 0,03 | −24,01 | 1,32 | −24,69 | 0,3047 | −0,0678 | |||
| LNT / Alliant Energy Corporation | 0,02 | 206,16 | 1,32 | 195,53 | 0,3045 | 0,2095 | |||
| PNR / Pentair plc | 0,01 | −8,18 | 1,32 | −3,37 | 0,3045 | 0,0144 | |||
| CBOE / Cboe Global Markets, Inc. | 0,01 | −21,50 | 1,32 | −14,64 | 0,3039 | −0,0242 | |||
| DTE / DTE Energy Company | 0,01 | −23,36 | 1,32 | −21,68 | 0,3033 | −0,0533 | |||
| FOX / Fox Corporation | 0,03 | 1,31 | 0,3028 | 0,3028 | |||||
| HUBB / Hubbell Incorporated | 0,00 | −13,09 | 1,31 | −8,90 | 0,3023 | −0,0033 | |||
| CNC / Centene Corporation | 0,02 | −16,24 | 1,31 | −18,75 | 0,3019 | −0,0402 | |||
| TSN / Tyson Foods, Inc. | 0,02 | −9,19 | 1,31 | −16,85 | 0,3016 | −0,0325 | |||
| ALLE / Allegion plc | 0,01 | −18,39 | 1,30 | −9,53 | 0,2998 | −0,0054 | |||
| ESS / Essex Property Trust, Inc. | 0,00 | 289,35 | 1,30 | 255,34 | 0,2991 | 0,2215 | |||
| FE / FirstEnergy Corp. | 0,03 | −18,27 | 1,30 | −11,60 | 0,2987 | −0,0125 | |||
| KIM / Kimco Realty Corporation | 0,06 | −8,84 | 1,30 | −12,32 | 0,2986 | −0,0150 | |||
| ROL / Rollins, Inc. | 0,02 | −8,18 | 1,29 | 0,31 | 0,2971 | 0,0244 | |||
| HUM / Humana Inc. | 0,01 | 1,29 | 0,2966 | 0,2966 | |||||
| LII / Lennox International Inc. | 0,00 | 275,29 | 1,29 | 253,02 | 0,2964 | 0,2189 | |||
| NCLH / Norwegian Cruise Line Holdings Ltd. | 0,07 | 29,13 | 1,27 | 0,32 | 0,2936 | 0,0240 | |||
| DOC / Healthpeak Properties, Inc. | 0,07 | 51,93 | 1,27 | 29,37 | 0,2935 | 0,0844 | |||
| LDOS / Leidos Holdings, Inc. | 0,01 | −22,31 | 1,27 | −11,24 | 0,2934 | −0,0110 | |||
| DGX / Quest Diagnostics Incorporated | 0,01 | 2,20 | 1,27 | 19,23 | 0,2931 | 0,0806 | |||
| GDDY / GoDaddy Inc. | 0,01 | −8,15 | 1,27 | −6,75 | 0,2928 | 0,0034 | |||
| CH1300646267 / Bunge Global SA | 0,02 | −22,53 | 1,26 | −18,41 | 0,2913 | −0,0375 | |||
| IVZ / Invesco Ltd. | 0,09 | 13,15 | 1,26 | −5,89 | 0,2912 | 0,0061 | |||
| L / Loews Corporation | 0,01 | −19,21 | 1,26 | −16,82 | 0,2909 | −0,0310 | |||
| LUV / Southwest Airlines Co. | 0,04 | −8,18 | 1,26 | −1,33 | 0,2900 | 0,0193 | |||
| PHM / PulteGroup, Inc. | 0,01 | −10,97 | 1,25 | −15,50 | 0,2892 | −0,0260 | |||
| NEE / NextEra Energy, Inc. | 0,02 | 1,25 | 0,2889 | 0,2889 | |||||
| AIZ / Assurant, Inc. | 0,01 | −8,67 | 1,25 | −10,79 | 0,2880 | −0,0095 | |||
| ERIE / Erie Indemnity Company | 0,00 | 6,69 | 1,25 | −10,69 | 0,2872 | −0,0089 | |||
| MAA / Mid-America Apartment Communities, Inc. | 0,01 | −5,62 | 1,24 | −12,07 | 0,2856 | −0,0135 | |||
| CZR / Caesars Entertainment, Inc. | 0,05 | 24,18 | 1,24 | −6,16 | 0,2848 | −0,0193 | |||
| UHS / Universal Health Services, Inc. | 0,01 | −15,21 | 1,24 | −7,90 | 0,2847 | −0,0000 | |||
| BAX / Baxter International Inc. | 0,04 | 137,12 | 1,23 | 109,76 | 0,2825 | 0,1583 | |||
| LYB / LyondellBasell Industries N.V. | 0,02 | 19,78 | 1,22 | −11,94 | 0,2807 | −0,0129 | |||
| DD / DuPont de Nemours, Inc. | 0,02 | −8,59 | 1,22 | −25,29 | 0,2806 | −0,0655 | |||
| REGN / Regeneron Pharmaceuticals, Inc. | 0,00 | 0,77 | 1,21 | −29,34 | 0,2801 | −0,0848 | |||
| GL / Globe Life Inc. | 0,01 | −17,87 | 1,21 | −21,45 | 0,2778 | −0,0480 | |||
| GIS / General Mills, Inc. | 0,02 | −18,62 | 1,20 | −27,20 | 0,2773 | −0,0734 | |||
| FRT / Federal Realty Investment Trust | 0,01 | −1,20 | 1,20 | −10,51 | 0,2770 | −0,0081 | |||
| EMN / Eastman Chemical Company | 0,02 | 4,84 | 1,20 | −16,08 | 0,2768 | −0,0268 | |||
| FI / Fiserv, Inc. | 0,01 | 1,20 | 0,2757 | 0,2757 | |||||
| TAP / Molson Coors Beverage Company | 0,02 | −6,82 | 1,19 | −18,54 | 0,2736 | −0,0357 | |||
| SYF / Synchrony Financial | 0,02 | −8,17 | 1,17 | −12,79 | 0,2705 | −0,0151 | |||
| HST / Host Hotels & Resorts, Inc. | 0,08 | −8,18 | 1,17 | −11,81 | 0,2702 | −0,0121 | |||
| MTB / M&T Bank Corporation | 0,01 | −8,20 | 1,17 | −12,55 | 0,2700 | −0,0144 | |||
| KHC / The Kraft Heinz Company | 0,04 | 160,56 | 1,17 | 126,74 | 0,2698 | 0,1602 | |||
| PCG / PG&E Corporation | 0,07 | −8,18 | 1,16 | −5,13 | 0,2683 | 0,0078 | |||
| FTNT / Fortinet, Inc. | 0,01 | −8,18 | 1,16 | −13,48 | 0,2680 | −0,0173 | |||
| TROW / T. Rowe Price Group, Inc. | 0,01 | −8,18 | 1,15 | −18,73 | 0,2661 | −0,0354 | |||
| FCX / Freeport-McMoRan Inc. | 0,03 | −8,18 | 1,15 | −4,23 | 0,2661 | 0,0100 | |||
| HD / The Home Depot, Inc. | 0,00 | −8,18 | 1,15 | −14,74 | 0,2641 | −0,0212 | |||
| GM / General Motors Company | 0,02 | −30,91 | 1,14 | −30,24 | 0,2638 | −0,0845 | |||
| WY / Weyerhaeuser Company | 0,04 | −8,18 | 1,13 | −20,97 | 0,2599 | −0,0430 | |||
| WDC / Western Digital Corporation | 0,02 | 37,62 | 1,12 | 45,08 | 0,2583 | 0,0942 | |||
| ANET / Arista Networks Inc | 0,01 | −8,17 | 1,12 | −14,46 | 0,2578 | −0,0199 | |||
| XYL / Xylem Inc. | 0,01 | −12,90 | 1,11 | −13,40 | 0,2548 | −0,0106 | |||
| AES / The AES Corporation | 0,11 | −23,32 | 1,09 | −33,23 | 0,2516 | −0,0955 | |||
| ABBV / AbbVie Inc. | 0,01 | 23,40 | 1,08 | 9,95 | 0,2497 | 0,0404 | |||
| AME / AMETEK, Inc. | 0,01 | −8,20 | 1,05 | −13,39 | 0,2432 | −0,0152 | |||
| CPB / The Campbell's Company | 0,03 | 201,48 | 1,05 | 156,72 | 0,2421 | 0,1551 | |||
| PODD / Insulet Corporation | 0,00 | 107,35 | 1,05 | 147,63 | 0,2411 | 0,1514 | |||
| SNPS / Synopsys, Inc. | 0,00 | −27,58 | 1,04 | −26,54 | 0,2387 | −0,0605 | |||
| UAL / United Airlines Holdings, Inc. | 0,01 | −8,17 | 1,03 | −22,25 | 0,2378 | −0,0439 | |||
| VLO / Valero Energy Corporation | 0,01 | 210,82 | 1,02 | 206,91 | 0,2357 | 0,1649 | |||
| PKI / Revvity Inc. | 0,01 | −11,54 | 1,02 | −28,70 | 0,2355 | −0,0687 | |||
| DVN / Devon Energy Corporation | 0,03 | −8,18 | 1,01 | −23,33 | 0,2335 | −0,0469 | |||
| TER / Teradyne, Inc. | 0,01 | 319,72 | 1,01 | 289,96 | 0,2329 | 0,1747 | |||
| PLD / Prologis, Inc. | 0,01 | 2,80 | 1,01 | −9,87 | 0,2317 | −0,0052 | |||
| TYL / Tyler Technologies, Inc. | 0,00 | −8,24 | 1,00 | −12,95 | 0,2294 | −0,0134 | |||
| Total Return Swap / DE (N/A) | 0,99 | 0,2291 | 0,2291 | ||||||
| SNA / Snap-on Incorporated | 0,00 | −8,16 | 0,99 | −13,64 | 0,2279 | −0,0152 | |||
| T / AT&T Inc. | 0,04 | −8,18 | 0,98 | −6,86 | 0,2253 | 0,0024 | |||
| HBAN / Huntington Bancshares Incorporated | 0,06 | −8,18 | 0,97 | −12,83 | 0,2241 | −0,0128 | |||
| BLDR / Builders FirstSource, Inc. | 0,01 | −8,19 | 0,96 | −28,86 | 0,2211 | −0,0652 | |||
| HLT / Hilton Worldwide Holdings Inc. | 0,00 | −51,01 | 0,94 | −40,46 | 0,2172 | −0,1614 | |||
| ADSK / Autodesk, Inc. | 0,00 | 28,65 | 0,94 | 39,00 | 0,2170 | 0,0731 | |||
| WBA / Walgreens Boots Alliance, Inc. | 0,08 | −32,72 | 0,94 | −29,09 | 0,2158 | −0,0647 | |||
| KMB / Kimberly-Clark Corporation | 0,01 | −48,99 | 0,93 | −48,34 | 0,2151 | −0,1686 | |||
| NSC / Norfolk Southern Corporation | 0,00 | −14,28 | 0,93 | −2,93 | 0,2138 | −0,0296 | |||
| TXT / Textron Inc. | 0,01 | −8,18 | 0,92 | −9,00 | 0,2122 | −0,0027 | |||
| ACN / Accenture plc | 0,00 | 330,02 | 0,90 | 290,91 | 0,2082 | 0,1592 | |||
| AXON / Axon Enterprise, Inc. | 0,00 | 0,89 | 0,2043 | 0,2043 | |||||
| APA / APA Corporation | 0,05 | −8,18 | 0,87 | −24,50 | 0,1996 | −0,0441 | |||
| DOW / Dow Inc. | 0,03 | −8,18 | 0,86 | −33,15 | 0,1989 | −0,0752 | |||
| REG / Regency Centers Corporation | 0,01 | −8,17 | 0,85 | −13,58 | 0,1967 | −0,0130 | |||
| ROST / Ross Stores, Inc. | 0,01 | 52,72 | 0,84 | 52,54 | 0,1943 | 0,0769 | |||
| AMGN / Amgen Inc. | 0,00 | 351,24 | 0,84 | 322,73 | 0,1931 | 0,1509 | |||
| PARA / Paramount Global | 0,07 | −16,67 | 0,83 | −11,28 | 0,1905 | −0,0072 | |||
| CHRW / C.H. Robinson Worldwide, Inc. | 0,01 | −8,18 | 0,82 | −13,33 | 0,1890 | −0,0118 | |||
| C / Citigroup Inc. | 0,01 | −54,07 | 0,82 | −16,21 | 0,1884 | −0,0578 | |||
| SJM / The J. M. Smucker Company | 0,01 | −8,19 | 0,81 | −6,46 | 0,1871 | 0,0029 | |||
| GEN / Gen Digital Inc. | 0,03 | −8,18 | 0,81 | −4,28 | 0,1857 | 0,0069 | |||
| CSX / CSX Corporation | 0,03 | −19,09 | 0,80 | −20,10 | 0,1851 | −0,0284 | |||
| LRCX / Lam Research Corporation | 0,01 | −8,17 | 0,79 | −3,41 | 0,1832 | 0,0087 | |||
| GD / General Dynamics Corporation | 0,00 | −8,14 | 0,72 | 1,27 | 0,1651 | 0,0149 | |||
| OMC / Omnicom Group Inc. | 0,01 | −8,18 | 0,71 | −18,51 | 0,1645 | −0,0215 | |||
| IQV / IQVIA Holdings Inc. | 0,00 | −8,18 | 0,70 | −31,80 | 0,1613 | −0,0564 | |||
| TPL / Texas Pacific Land Corporation | 0,00 | 117,73 | 0,68 | 70,15 | 0,1577 | 0,0722 | |||
| AKAM / Akamai Technologies, Inc. | 0,01 | −8,18 | 0,68 | −13,56 | 0,1573 | −0,0104 | |||
| LOW / Lowe's Companies, Inc. | 0,00 | 273,88 | 0,68 | 240,70 | 0,1564 | 0,1140 | |||
| ZTS / Zoetis Inc. | 0,00 | −8,22 | 0,67 | −7,35 | 0,1540 | 0,0007 | |||
| TGT / Target Corporation | 0,01 | −36,16 | 0,65 | −54,67 | 0,1489 | −0,1472 | |||
| MGM / MGM Resorts International | 0,02 | −8,19 | 0,63 | −16,47 | 0,1452 | −0,0148 | |||
| CFG / Citizens Financial Group, Inc. | 0,02 | −8,19 | 0,63 | −19,18 | 0,1450 | −0,0200 | |||
| HII / Huntington Ingalls Industries, Inc. | 0,00 | −47,05 | 0,63 | −32,76 | 0,1445 | −0,0534 | |||
| WFC / Wells Fargo & Company | 0,01 | −8,19 | 0,63 | −12,32 | 0,1443 | −0,0073 | |||
| MSCI / MSCI Inc. | 0,00 | −8,27 | 0,61 | −12,43 | 0,1399 | −0,0072 | |||
| BX / Blackstone Inc. | 0,00 | −8,15 | 0,61 | −20,92 | 0,1396 | −0,0230 | |||
| AMAT / Applied Materials, Inc. | 0,00 | −29,54 | 0,60 | −30,14 | 0,1380 | −0,0439 | |||
| FTV / Fortive Corporation | 0,01 | −57,97 | 0,58 | −62,91 | 0,1342 | −0,1991 | |||
| CEG / Constellation Energy Corporation | 0,00 | 0,58 | 0,1337 | 0,1337 | |||||
| PNW / Pinnacle West Capital Corporation | 0,01 | −8,17 | 0,58 | −9,53 | 0,1336 | −0,0023 | |||
| VTRS / Viatris Inc. | 0,07 | −8,18 | 0,57 | −12,63 | 0,1325 | −0,0071 | |||
| JKHY / Jack Henry & Associates, Inc. | 0,00 | −8,17 | 0,57 | −4,03 | 0,1319 | 0,0051 | |||
| TDY / Teledyne Technologies Incorporated | 0,00 | −8,24 | 0,56 | −11,11 | 0,1293 | −0,0047 | |||
| HES / Hess Corporation | 0,00 | −8,21 | 0,56 | −18,62 | 0,1281 | −0,0167 | |||
| KO / The Coca-Cola Company | 0,01 | 35,76 | 0,56 | 37,72 | 0,1280 | 0,0422 | |||
| PM / Philip Morris International Inc. | 0,00 | 148,00 | 0,53 | 189,56 | 0,1215 | 0,0827 | |||
| INCY / Incyte Corporation | 0,01 | −8,17 | 0,52 | −18,76 | 0,1210 | −0,0161 | |||
| SCHW / The Charles Schwab Corporation | 0,01 | −8,19 | 0,52 | 1,96 | 0,1199 | 0,0116 | |||
| DHR / Danaher Corporation | 0,00 | −63,22 | 0,51 | −66,43 | 0,1182 | −0,2057 | |||
| AMD / Advanced Micro Devices, Inc. | 0,00 | −8,21 | 0,51 | 1,79 | 0,1181 | 0,0112 | |||
| A / Agilent Technologies, Inc. | 0,00 | −8,16 | 0,51 | −19,56 | 0,1176 | −0,0172 | |||
| EXPE / Expedia Group, Inc. | 0,00 | 0,50 | 0,1149 | 0,1149 | |||||
| FITB / Fifth Third Bancorp | 0,01 | −8,18 | 0,49 | −19,44 | 0,1129 | −0,0160 | |||
| CMCSA / Comcast Corporation | 0,01 | −8,18 | 0,49 | −11,43 | 0,1125 | −0,0046 | |||
| AEP / American Electric Power Company, Inc. | 0,00 | 0,49 | 0,1120 | 0,1120 | |||||
| DIS / The Walt Disney Company | 0,00 | −7,20 | 0,48 | −7,87 | 0,1108 | 0,0001 | |||
| ED / Consolidated Edison, Inc. | 0,00 | −46,62 | 0,48 | −38,19 | 0,1106 | −0,0869 | |||
| ORCL / Oracle Corporation | 0,00 | −8,20 | 0,48 | −8,59 | 0,1106 | −0,0007 | |||
| IP / International Paper Company | 0,01 | −8,17 | 0,48 | −22,15 | 0,1104 | −0,0201 | |||
| INTC / Intel Corporation | 0,02 | −5,15 | 0,48 | −21,93 | 0,1101 | −0,0197 | |||
| PANW / Palo Alto Networks, Inc. | 0,00 | −48,60 | 0,46 | −48,16 | 0,1072 | −0,0829 | |||
| PSX / Phillips 66 | 0,00 | −8,20 | 0,45 | −19,79 | 0,1048 | −0,0154 | |||
| HPQ / HP Inc. | 0,02 | −8,19 | 0,45 | −25,99 | 0,1038 | −0,0253 | |||
| WRB / W. R. Berkley Corporation | 0,01 | −8,20 | 0,45 | 8,76 | 0,1032 | 0,0157 | |||
| GRMN / Garmin Ltd. | 0,00 | −8,25 | 0,45 | −18,58 | 0,1031 | −0,0136 | |||
| ENPH / Enphase Energy, Inc. | 0,01 | 59,85 | 0,43 | −34,54 | 0,1002 | −0,0689 | |||
| PFG / Principal Financial Group, Inc. | 0,01 | −8,19 | 0,42 | −19,65 | 0,0962 | −0,0141 | |||
| N6B / Labcorp Holdings Inc. | 0,00 | 0,40 | 0,0930 | 0,0930 | |||||
| HOLX / Hologic, Inc. | 0,01 | −8,17 | 0,40 | −10,00 | 0,0914 | −0,0021 | |||
| CVX / Chevron Corporation | 0,00 | 13,39 | 0,38 | −2,29 | 0,0886 | 0,0051 | |||
| EBAY / eBay Inc. | 0,01 | −8,16 | 0,37 | 3,90 | 0,0860 | 0,0097 | |||
| CAG / Conagra Brands, Inc. | 0,02 | −8,17 | 0,36 | −17,63 | 0,0819 | −0,0098 | |||
| PYPL / PayPal Holdings, Inc. | 0,00 | −62,49 | 0,35 | −62,94 | 0,0803 | −0,1191 | |||
| CSCO / Cisco Systems, Inc. | 0,01 | 17,27 | 0,35 | 15,28 | 0,0801 | 0,0161 | |||
| ABNB / Airbnb, Inc. | 0,00 | −8,17 | 0,34 | −14,90 | 0,0779 | −0,0062 | |||
| PAYX / Paychex, Inc. | 0,00 | −8,11 | 0,33 | −4,32 | 0,0767 | 0,0029 | |||
| CF / CF Industries Holdings, Inc. | 0,00 | −25,51 | 0,33 | 10,07 | 0,0757 | 0,0018 | |||
| EPAM / EPAM Systems, Inc. | 0,00 | −8,22 | 0,32 | −22,28 | 0,0741 | −0,0138 | |||
| MTCH / Match Group, Inc. | 0,01 | −8,19 | 0,32 | −13,51 | 0,0740 | −0,0046 | |||
| GILD / Gilead Sciences, Inc. | 0,00 | −88,36 | 0,32 | −83,78 | 0,0731 | −0,3499 | |||
| ABT / Abbott Laboratories | 0,00 | −1,60 | 0,31 | −4,88 | 0,0721 | 0,0024 | |||
| SOLV / Solventum Corporation | 0,00 | −8,19 | 0,31 | −15,89 | 0,0708 | −0,0067 | |||
| DLR / Digital Realty Trust, Inc. | 0,00 | −20,31 | 0,29 | −10,03 | 0,0664 | −0,0027 | |||
| IBM / International Business Machines Corporation | 0,00 | 31,33 | 0,27 | 34,83 | 0,0626 | 0,0198 | |||
| Repurchase Agreement / RA (000000000) | 0,27 | 0,0624 | 0,0624 | ||||||
| UPS / United Parcel Service, Inc. | 0,00 | −4,97 | 0,27 | −44,58 | 0,0615 | −0,0573 | |||
| LEN / Lennar Corporation | 0,00 | −75,99 | 0,27 | −78,77 | 0,0613 | −0,2039 | |||
| FIS / Fidelity National Information Services, Inc. | 0,00 | −8,14 | 0,26 | 3,13 | 0,0609 | 0,0063 | |||
| DHI / D.R. Horton, Inc. | 0,00 | −8,11 | 0,25 | −14,33 | 0,0580 | −0,0044 | |||
| MCD / McDonald's Corporation | 0,00 | 40,11 | 0,25 | 43,02 | 0,0569 | 0,0201 | |||
| VZ / Verizon Communications Inc. | 0,01 | −8,18 | 0,24 | −6,18 | 0,0561 | 0,0009 | |||
| CHD / Church & Dwight Co., Inc. | 0,00 | −8,17 | 0,24 | −18,98 | 0,0553 | −0,0074 | |||
| MKC / McCormick & Company, Incorporated | 0,00 | −8,15 | 0,24 | −19,18 | 0,0544 | −0,0076 | |||
| DELL / Dell Technologies Inc. | 0,00 | −8,13 | 0,23 | −0,87 | 0,0530 | 0,0039 | |||
| HSY / The Hershey Company | 0,00 | 0,22 | 0,0511 | 0,0511 | |||||
| CLX / The Clorox Company | 0,00 | −8,23 | 0,21 | −22,68 | 0,0482 | −0,0092 | |||
| GNRC / Generac Holdings Inc. | 0,00 | −8,19 | 0,20 | −17,81 | 0,0470 | −0,0056 | |||
| SYY / Sysco Corporation | 0,00 | −8,20 | 0,20 | −11,35 | 0,0469 | −0,0018 | |||
| LIN / Linde plc | 0,00 | 12,43 | 0,20 | 12,50 | 0,0458 | 0,0083 | |||
| BBY / Best Buy Co., Inc. | 0,00 | −8,21 | 0,19 | −32,40 | 0,0448 | −0,0162 | |||
| NWSA / News Corporation | 0,01 | −8,17 | 0,19 | −9,48 | 0,0441 | −0,0007 | |||
| INVH / Invitation Homes Inc. | 0,01 | −49,38 | 0,19 | −49,87 | 0,0436 | −0,0365 | |||
| LHX / L3Harris Technologies, Inc. | 0,00 | −8,08 | 0,19 | 9,25 | 0,0436 | 0,0067 | |||
| FDS / FactSet Research Systems Inc. | 0,00 | −8,41 | 0,18 | −9,14 | 0,0414 | −0,0006 | |||
| PAYC / Paycom Software, Inc. | 0,00 | −90,51 | 0,18 | −84,97 | 0,0410 | −0,2139 | |||
| MMC / Marsh & McLennan Companies, Inc. | 0,00 | −8,04 | 0,17 | −9,90 | 0,0400 | −0,0008 | |||
| TRMB / Trimble Inc. | 0,00 | −7,54 | 0,17 | −8,56 | 0,0395 | −0,0002 | |||
| MS / Morgan Stanley | 0,00 | −0,15 | 0,17 | −3,95 | 0,0392 | 0,0016 | |||
| BSX / Boston Scientific Corporation | 0,00 | −67,10 | 0,16 | −14,21 | 0,0378 | −0,0051 | |||
| CSGP / CoStar Group, Inc. | 0,00 | −8,22 | 0,16 | −11,54 | 0,0373 | −0,0015 | |||
| RF / Regions Financial Corporation | 0,01 | −8,18 | 0,16 | −16,75 | 0,0367 | −0,0040 | |||
| J / Jacobs Solutions Inc. | 0,00 | −4,06 | 0,16 | −5,39 | 0,0365 | 0,0010 | |||
| NOW / ServiceNow, Inc. | 0,00 | −92,11 | 0,16 | −91,46 | 0,0364 | −0,3539 | |||
| CMG / Chipotle Mexican Grill, Inc. | 0,00 | −8,16 | 0,16 | −14,67 | 0,0363 | −0,0029 | |||
| MAS / Masco Corporation | 0,00 | −5,75 | 0,15 | −21,83 | 0,0356 | −0,0063 | |||
| TMO / Thermo Fisher Scientific Inc. | 0,00 | 15,05 | 0,15 | −12,50 | 0,0341 | −0,0017 | |||
| KMX / CarMax, Inc. | 0,00 | −55,58 | 0,15 | −65,57 | 0,0340 | −0,0567 | |||
| SLB / Schlumberger Limited | 0,00 | −85,66 | 0,15 | −88,66 | 0,0340 | −0,2412 | |||
| AMTM / Amentum Holdings, Inc. | 0,00 | −99,73 | 0,00 | −99,86 | 0,0004 | −0,1447 | |||
| SNDK / Sandisk Corporation | 0,00 | −100,00 | 0,00 | −100,00 | −0,0524 | ||||
| ZBH / Zimmer Biomet Holdings, Inc. | 0,00 | −100,00 | 0,00 | −100,00 | −0,0467 | ||||
| FICO / Fair Isaac Corporation | 0,00 | −100,00 | 0,00 | −100,00 | −0,3765 | ||||
| Total Return Swap / DE (N/A) | −3,69 | −0,8510 | −0,8510 | ||||||
| Total Return Swap / DE (N/A) | −4,10 | −0,9459 | −0,9459 |