Grundläggande statistik
| Portföljvärde | $ 53 966 878 |
| Aktuella positioner | 79 |
Senaste innehav, resultat, förvaltat kapital (från 13F, 13D)
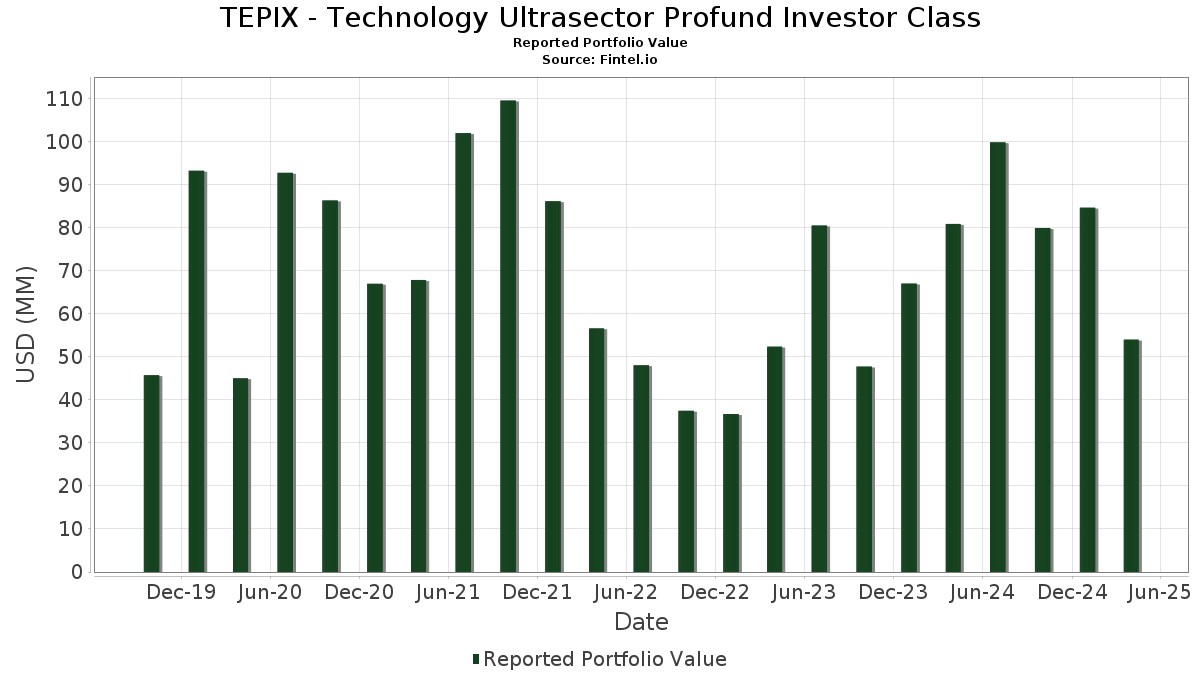
TEPIX - Technology Ultrasector Profund Investor Class har redovisat 79 totala innehav i sina senaste SEC-arkiveringar. Det senaste portföljvärdet beräknas vara $ 53 966 878 USD. Faktiskt förvaltade tillgångar (AUM) är detta värde plus likvida medel (som inte redovisas). TEPIX - Technology Ultrasector Profund Investor Classs största innehav är Apple Inc. (US:AAPL) , Microsoft Corporation (US:MSFT) , NVIDIA Corporation (US:NVDA) , Broadcom Inc. (US:AVGO) , and Salesforce, Inc. (US:CRM) .
Största ökningarna detta kvartal
Vi använder förändringen i portföljallokeringen eftersom det är det mest meningsfulla måttet. Förändringar kan bero på transaktioner eller förändringar i aktiekurser.
| Värdepapper | Aktier (MM) |
Värde (MM$) |
Portfölj % av | ΔPortfölj % av |
|---|---|---|---|---|
| 3,21 | 6,0891 | 6,0891 | ||
| 3,04 | 5,7743 | 5,7743 | ||
| 1,16 | 2,2053 | 2,2053 | ||
| 1,16 | 2,2030 | 2,2030 | ||
| 1,16 | 2,2030 | 2,2030 | ||
| 1,15 | 2,1845 | 2,1845 | ||
| 1,11 | 2,0973 | 2,0973 | ||
| 0,92 | 1,7370 | 1,7370 | ||
| 0,83 | 1,5739 | 1,5739 | ||
| 0,01 | 1,17 | 2,2123 | 0,7731 |
Största minskningarna detta kvartal
Vi använder förändringen i portföljallokeringen eftersom det är det mest meningsfulla måttet. Förändringar kan bero på transaktioner eller förändringar i aktiepriser.
| Värdepapper | Aktier (MM) |
Värde (MM$) |
Portfölj % av | ΔPortfölj % av |
|---|---|---|---|---|
| 0,01 | 1,80 | 3,4206 | −1,0113 | |
| 0,00 | 1,24 | 2,3440 | −0,4363 | |
| 0,03 | 5,90 | 11,1851 | −0,3610 | |
| 0,00 | 0,90 | 1,7052 | −0,3422 | |
| 0,01 | 1,10 | 2,0801 | −0,2464 | |
| 0,00 | 0,41 | 0,7746 | −0,2385 | |
| 0,05 | 4,93 | 9,3452 | −0,1878 | |
| 0,01 | 0,76 | 1,4373 | −0,1642 | |
| 0,00 | 0,78 | 1,4883 | −0,1506 | |
| 0,00 | 0,59 | 1,1163 | −0,1493 |
13F- och fond arkiveringar
Denna blankett lämnades in den 2025-06-23 för rapporteringsperioden 2025-04-30. Klicka på länksymbolen för att se hela transaktionshistoriken.
Uppgradera för att låsa upp premiumdata och exportera till Excel![]() .
.
| Värdepapper | Typ | Genomsnittligt aktiepris | Aktier (MM) |
ΔAktier (%) |
ΔAktier (%) |
Värde ($MM) |
Portfölj (%) |
ΔPortfölj (%) |
|
|---|---|---|---|---|---|---|---|---|---|
| AAPL / Apple Inc. | 0,03 | −32,88 | 5,90 | −39,57 | 11,1851 | −0,3610 | |||
| MSFT / Microsoft Corporation | 0,01 | −32,48 | 5,43 | −35,71 | 10,2949 | 0,3066 | |||
| NVDA / NVIDIA Corporation | 0,05 | −32,58 | 4,93 | −38,84 | 9,3452 | −0,1878 | |||
| SOCIETE' GENERALE 4.23 , 5/01/2025 / RA (N/A) | 3,21 | 6,0891 | 6,0891 | ||||||
| HSBC SECURITIES (USA), INC. 4.28 , 5/01/2025 / RA (N/A) | 3,04 | 5,7743 | 5,7743 | ||||||
| AVGO / Broadcom Inc. | 0,01 | −44,65 | 1,80 | −51,87 | 3,4206 | −1,0113 | |||
| CRM / Salesforce, Inc. | 0,00 | −33,12 | 1,24 | −47,40 | 2,3440 | −0,4363 | |||
| PLTR / Palantir Technologies Inc. | 0,01 | −33,21 | 1,17 | −4,11 | 2,2123 | 0,7731 | |||
| TEPIX_IXT_GOLDMAN / DE (N/A) | 1,16 | 2,2053 | 2,2053 | ||||||
| TEPIX_IXT_UBS / DE (N/A) | 1,16 | 2,2030 | 2,2030 | ||||||
| TEPIX_IXT_UBS / DE (N/A) | 1,16 | 2,2030 | 2,2030 | ||||||
| CREDIT AGRICOLE CIB NY 4.24 , 5/01/2025 / RA (N/A) | 1,15 | 2,1845 | 2,1845 | ||||||
| NATWEST MARKETS PLC 4.23 , 5/01/2025 / RA (N/A) | 1,11 | 2,0973 | 2,0973 | ||||||
| CSCO / Cisco Systems, Inc. | 0,02 | −33,25 | 1,11 | −36,38 | 2,0956 | 0,0396 | |||
| ORCL / Oracle Corporation | 0,01 | −32,59 | 1,10 | −44,25 | 2,0801 | −0,2464 | |||
| IBM / International Business Machines Corporation | 0,00 | −33,20 | 1,07 | −36,86 | 2,0379 | 0,0254 | |||
| NOW / ServiceNow, Inc. | 0,00 | −33,20 | 0,95 | −37,38 | 1,7929 | 0,0075 | |||
| UMB FINANCIAL CORP. B 4.1 , 5/01/2025 / RA (N/A) | 0,92 | 1,7370 | 1,7370 | ||||||
| ACN / Accenture plc | 0,00 | −33,14 | 0,90 | −48,03 | 1,7052 | −0,3422 | |||
| INTU / Intuit Inc. | 0,00 | −33,32 | 0,84 | −30,50 | 1,6004 | 0,1651 | |||
| ROYAL BANK OF CANADA 4.15 , 5/01/2025 / RA (N/A) | 0,83 | 1,5739 | 1,5739 | ||||||
| QCOM / QUALCOMM Incorporated | 0,01 | −33,51 | 0,79 | −42,91 | 1,4963 | −0,1391 | |||
| ADBE / Adobe Inc. | 0,00 | −33,91 | 0,78 | −43,39 | 1,4883 | −0,1506 | |||
| AMD / Advanced Micro Devices, Inc. | 0,01 | −33,32 | 0,76 | −44,05 | 1,4373 | −0,1642 | |||
| TXN / Texas Instruments Incorporated | 0,00 | −33,34 | 0,70 | −42,20 | 1,3278 | −0,1055 | |||
| PANW / Palo Alto Networks, Inc. | 0,00 | −32,43 | 0,59 | −31,57 | 1,1279 | 0,1006 | |||
| AMAT / Applied Materials, Inc. | 0,00 | −34,15 | 0,59 | −45,00 | 1,1163 | −0,1493 | |||
| CRWD / CrowdStrike Holdings, Inc. | 0,00 | −29,33 | 0,51 | −23,87 | 0,9621 | 0,1738 | |||
| ADI / Analog Devices, Inc. | 0,00 | −33,26 | 0,46 | −38,62 | 0,8812 | −0,0142 | |||
| KLAC / KLA Corporation | 0,00 | −33,58 | 0,45 | −36,76 | 0,8515 | 0,0113 | |||
| APH / Amphenol Corporation | 0,01 | −32,89 | 0,45 | −27,08 | 0,8494 | 0,1231 | |||
| LRCX / Lam Research Corporation | 0,01 | −33,37 | 0,44 | −41,07 | 0,8384 | −0,0493 | |||
| INTC / Intel Corporation | 0,02 | −32,94 | 0,42 | −30,56 | 0,7932 | 0,0799 | |||
| MU / Micron Technology, Inc. | 0,01 | −32,87 | 0,41 | −43,33 | 0,7814 | −0,0796 | |||
| ANET / Arista Networks Inc | 0,00 | −33,19 | 0,41 | −52,34 | 0,7746 | −0,2385 | |||
| CDNS / Cadence Design Systems, Inc. | 0,00 | −33,20 | 0,39 | −33,22 | 0,7442 | 0,0495 | |||
| MSI / Motorola Solutions, Inc. | 0,00 | −33,19 | 0,35 | −37,41 | 0,6706 | 0,0033 | |||
| SNPS / Synopsys, Inc. | 0,00 | −32,76 | 0,34 | −41,21 | 0,6467 | −0,0402 | |||
| FTNT / Fortinet, Inc. | 0,00 | −33,19 | 0,32 | −31,24 | 0,6017 | 0,0555 | |||
| ROP / Roper Technologies, Inc. | 0,00 | −33,29 | 0,29 | −35,14 | 0,5470 | 0,0212 | |||
| ADSK / Autodesk, Inc. | 0,00 | −33,23 | 0,28 | −41,16 | 0,5372 | −0,0326 | |||
| WDAY / Workday, Inc. | 0,00 | −32,88 | 0,25 | −37,16 | 0,4781 | 0,0028 | |||
| FICO / Fair Isaac Corporation | 0,00 | −33,14 | 0,23 | −29,05 | 0,4414 | 0,0536 | |||
| NXPI / NXP Semiconductors N.V. | 0,00 | −33,19 | 0,23 | −40,94 | 0,4271 | −0,0241 | |||
| TEL / TE Connectivity plc | 0,00 | −33,36 | 0,21 | −34,28 | 0,3981 | 0,0213 | |||
| CTSH / Cognizant Technology Solutions Corporation | 0,00 | −33,33 | 0,17 | −40,82 | 0,3318 | −0,0168 | |||
| GLW / Corning Incorporated | 0,00 | −33,17 | 0,16 | −43,06 | 0,3118 | −0,0298 | |||
| IT / Gartner, Inc. | 0,00 | −33,51 | 0,16 | −48,50 | 0,2946 | −0,0618 | |||
| DELL / Dell Technologies Inc. | 0,00 | −32,17 | 0,14 | −39,91 | 0,2608 | −0,0100 | |||
| MPWR / Monolithic Power Systems, Inc. | 0,00 | −34,47 | 0,14 | −39,01 | 0,2587 | −0,0060 | |||
| ANSS / ANSYS, Inc. | 0,00 | −33,23 | 0,14 | −38,64 | 0,2564 | −0,0044 | |||
| GDDY / GoDaddy Inc. | 0,00 | −32,77 | 0,13 | −40,65 | 0,2425 | −0,0116 | |||
| KEYS / Keysight Technologies, Inc. | 0,00 | −33,47 | 0,12 | −45,95 | 0,2291 | −0,0344 | |||
| MCHP / Microchip Technology Incorporated | 0,00 | −33,10 | 0,12 | −43,06 | 0,2259 | −0,0223 | |||
| HPQ / HP Inc. | 0,00 | −35,00 | 0,12 | −48,89 | 0,2185 | −0,0481 | |||
| TYL / Tyler Technologies, Inc. | 0,00 | −33,12 | 0,11 | −40,00 | 0,2122 | −0,0070 | |||
| VRSN / VeriSign, Inc. | 0,00 | −34,29 | 0,11 | −13,39 | 0,2092 | 0,0578 | |||
| TDY / Teledyne Technologies Incorporated | 0,00 | −33,13 | 0,10 | −39,18 | 0,1980 | −0,0047 | |||
| CDW / CDW Corporation | 0,00 | −33,26 | 0,10 | −46,32 | 0,1949 | −0,0311 | |||
| HPE / Hewlett Packard Enterprise Company | 0,01 | −32,44 | 0,10 | −48,22 | 0,1942 | −0,0401 | |||
| STX / Seagate Technology Holdings plc | 0,00 | −33,11 | 0,09 | −36,99 | 0,1757 | 0,0022 | |||
| PTC / PTC Inc. | 0,00 | −32,99 | 0,09 | −46,71 | 0,1702 | −0,0276 | |||
| NTAP / NetApp, Inc. | 0,00 | −33,67 | 0,09 | −51,40 | 0,1663 | −0,0465 | |||
| ON / ON Semiconductor Corporation | 0,00 | −33,91 | 0,08 | −50,00 | 0,1524 | −0,0373 | |||
| SMCI / Super Micro Computer, Inc. | 0,00 | −33,18 | 0,08 | −25,24 | 0,1463 | 0,0240 | |||
| JBL / Jabil Inc. | 0,00 | −35,22 | 0,08 | −41,22 | 0,1462 | −0,0098 | |||
| TRMB / Trimble Inc. | 0,00 | −32,78 | 0,07 | −44,27 | 0,1392 | −0,0166 | |||
| WDC / Western Digital Corporation | 0,00 | −32,77 | 0,07 | −54,66 | 0,1391 | −0,0526 | |||
| FFIV / F5, Inc. | 0,00 | −33,73 | 0,07 | −41,13 | 0,1391 | −0,0079 | |||
| GEN / Gen Digital Inc. | 0,00 | −33,19 | 0,07 | −36,19 | 0,1279 | 0,0037 | |||
| FSLR / First Solar, Inc. | 0,00 | −33,12 | 0,06 | −50,00 | 0,1229 | −0,0297 | |||
| ZBRA / Zebra Technologies Corporation | 0,00 | −33,42 | 0,06 | −57,93 | 0,1172 | −0,0548 | |||
| AKAM / Akamai Technologies, Inc. | 0,00 | −33,21 | 0,06 | −45,79 | 0,1103 | −0,0174 | |||
| TER / Teradyne, Inc. | 0,00 | −33,19 | 0,06 | −57,04 | 0,1102 | −0,0504 | |||
| JNPR / Juniper Networks, Inc. | 0,00 | −33,21 | 0,06 | −31,33 | 0,1096 | 0,0113 | |||
| SWKS / Skyworks Solutions, Inc. | 0,00 | −32,72 | 0,05 | −51,49 | 0,0942 | −0,0264 | |||
| EPAM / EPAM Systems, Inc. | 0,00 | −33,09 | 0,04 | −59,22 | 0,0812 | −0,0413 | |||
| ENPH / Enphase Energy, Inc. | 0,00 | −34,47 | 0,03 | −53,33 | 0,0539 | −0,0178 | |||
| TEPIX_IXT_GOLDMAN / DE (N/A) | −0,00 | −0,0017 | −0,0017 |