Grundläggande statistik
| Portföljvärde | $ 110 868 971 |
| Aktuella positioner | 74 |
Senaste innehav, resultat, förvaltat kapital (från 13F, 13D)
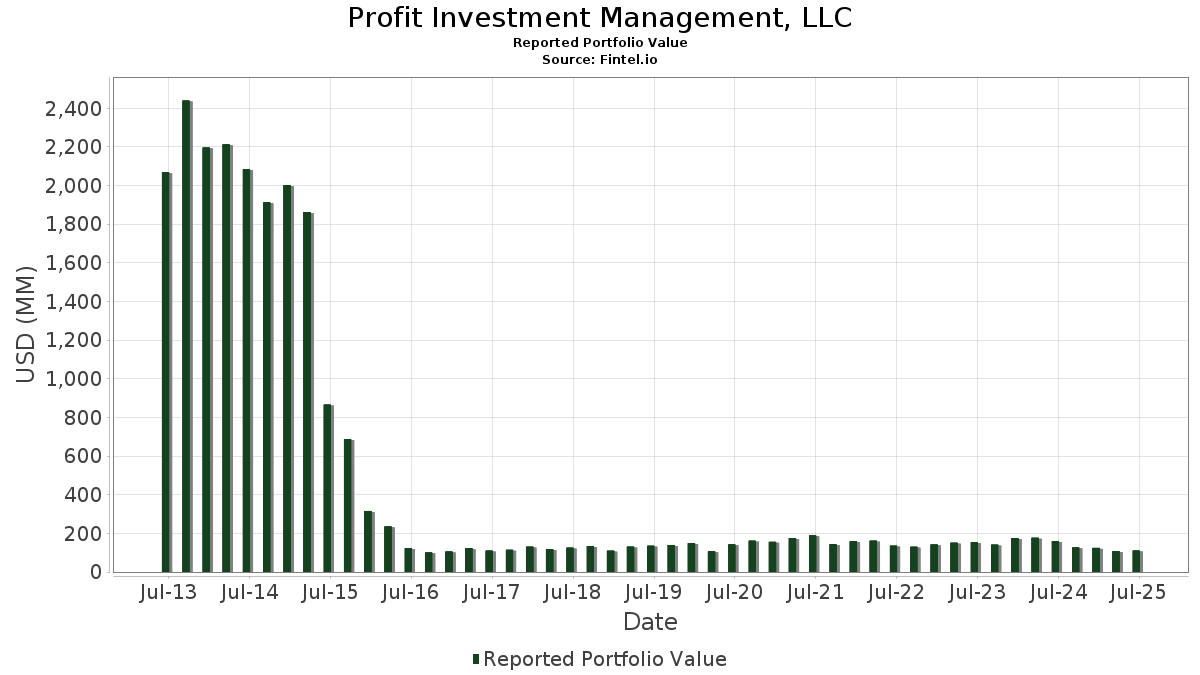
Profit Investment Management, LLC har redovisat 74 totala innehav i sina senaste SEC-arkiveringar. Det senaste portföljvärdet beräknas vara $ 110 868 971 USD. Faktiskt förvaltade tillgångar (AUM) är detta värde plus likvida medel (som inte redovisas). Profit Investment Management, LLCs största innehav är Kratos Defense & Security Solutions, Inc. (US:KTOS) , Box, Inc. (US:BOX) , Envista Holdings Corporation (US:NVST) , Plexus Corp. (US:PLXS) , and FirstCash Holdings, Inc. (US:FCFS) . Profit Investment Management, LLCs nya positioner inkluderar Olympic Steel, Inc. (US:ZEUS) , Investors Title Company (US:ITIC) , Apogee Enterprises, Inc. (US:APOG) , .
Största ökningarna detta kvartal
Vi använder förändringen i portföljallokeringen eftersom det är det mest meningsfulla måttet. Förändringar kan bero på transaktioner eller förändringar i aktiekurser.
| Värdepapper | Aktier (MM) |
Värde (MM$) |
Portfölj % av | ΔPortfölj % av |
|---|---|---|---|---|
| 0,05 | 1,55 | 1,3999 | 1,3999 | |
| 0,11 | 5,10 | 4,6018 | 1,3824 | |
| 0,01 | 1,47 | 1,3219 | 1,3219 | |
| 0,03 | 1,27 | 1,1494 | 1,1494 | |
| 0,17 | 3,40 | 3,0629 | 1,0187 | |
| 0,02 | 2,91 | 2,6225 | 0,7744 | |
| 0,01 | 2,10 | 1,8966 | 0,5158 | |
| 0,05 | 2,41 | 2,1734 | 0,4721 | |
| 0,07 | 2,95 | 2,6615 | 0,4336 | |
| 0,00 | 1,94 | 1,7488 | 0,3509 |
Största minskningarna detta kvartal
Vi använder förändringen i portföljallokeringen eftersom det är det mest meningsfulla måttet. Förändringar kan bero på transaktioner eller förändringar i aktiepriser.
| Värdepapper | Aktier (MM) |
Värde (MM$) |
Portfölj % av | ΔPortfölj % av |
|---|---|---|---|---|
| 0,10 | 2,26 | 2,0399 | −1,1305 | |
| 0,08 | 1,24 | 1,1180 | −0,8643 | |
| 0,07 | 1,51 | 1,3603 | −0,7173 | |
| 0,02 | 1,44 | 1,2996 | −0,6854 | |
| 0,02 | 0,71 | 0,6436 | −0,5176 | |
| 0,03 | 0,59 | 0,5319 | −0,5139 | |
| 0,03 | 1,90 | 1,7156 | −0,4942 | |
| 0,00 | 0,26 | 0,2372 | −0,4800 | |
| 0,02 | 2,26 | 2,0395 | −0,4790 | |
| 0,00 | 0,56 | 0,5037 | −0,3908 |
13F- och fond arkiveringar
Denna blankett lämnades in den 2025-07-11 för rapporteringsperioden 2025-06-30. Klicka på länksymbolen för att se hela transaktionshistoriken.
Uppgradera för att låsa upp premiumdata och exportera till Excel![]() .
.
| Värdepapper | Typ | Genomsnittligt aktiepris | Aktier (MM) |
ΔAktier (%) |
ΔAktier (%) |
Värde ($MM) |
Portfölj (%) |
ΔPortfölj (%) |
|
|---|---|---|---|---|---|---|---|---|---|
| KTOS / Kratos Defense & Security Solutions, Inc. | 0,11 | −5,98 | 5,10 | 47,09 | 4,6018 | 1,3824 | |||
| BOX / Box, Inc. | 0,10 | −0,73 | 3,48 | 9,92 | 3,1395 | 0,2001 | |||
| NVST / Envista Holdings Corporation | 0,17 | 36,20 | 3,40 | 54,18 | 3,0629 | 1,0187 | |||
| PLXS / Plexus Corp. | 0,02 | 0,00 | 3,37 | 5,61 | 3,0420 | 0,0777 | |||
| FCFS / FirstCash Holdings, Inc. | 0,02 | −4,14 | 3,35 | 7,65 | 3,0205 | 0,1336 | |||
| OPY / Oppenheimer Holdings Inc. | 0,05 | 0,00 | 3,25 | 10,29 | 2,9302 | 0,1963 | |||
| VKTX / Viking Therapeutics, Inc. | 0,12 | −0,78 | 3,10 | 8,86 | 2,7930 | 0,1531 | |||
| SCSC / ScanSource, Inc. | 0,07 | 0,00 | 2,95 | 22,92 | 2,6615 | 0,4336 | |||
| MTZ / MasTec, Inc. | 0,02 | 0,00 | 2,91 | 46,01 | 2,6225 | 0,7744 | |||
| JHG / Janus Henderson Group plc | 0,07 | 5,18 | 2,81 | 13,01 | 2,5315 | 0,2262 | |||
| WDFC / WD-40 Company | 0,01 | 0,00 | 2,42 | −6,54 | 2,1789 | −0,2198 | |||
| GT / The Goodyear Tire & Rubber Company | 0,23 | 0,00 | 2,41 | 12,23 | 2,1776 | 0,1809 | |||
| TEX / Terex Corporation | 0,05 | 6,38 | 2,41 | 31,50 | 2,1734 | 0,4721 | |||
| JBTM / JBT Marel Corporation | 0,02 | 0,00 | 2,35 | −1,59 | 2,1221 | −0,0969 | |||
| GIII / G-III Apparel Group, Ltd. | 0,10 | −19,15 | 2,26 | −33,79 | 2,0399 | −1,1305 | |||
| CROX / Crocs, Inc. | 0,02 | −12,61 | 2,26 | −16,66 | 2,0395 | −0,4790 | |||
| UA / Under Armour, Inc. | 0,34 | 0,00 | 2,21 | 9,07 | 1,9965 | 0,1129 | |||
| SBH / Sally Beauty Holdings, Inc. | 0,23 | 9,72 | 2,17 | 12,55 | 1,9583 | 0,1672 | |||
| NFLX / Netflix, Inc. | 0,00 | −23,04 | 2,17 | 10,55 | 1,9567 | 0,1347 | |||
| BCO / The Brink's Company | 0,02 | −1,55 | 2,14 | 2,01 | 1,9264 | −0,0167 | |||
| LOB / Live Oak Bancshares, Inc. | 0,07 | 0,00 | 2,12 | 11,76 | 1,9120 | 0,1517 | |||
| NVDA / NVIDIA Corporation | 0,01 | −3,04 | 2,10 | 41,36 | 1,8966 | 0,5158 | |||
| MSFT / Microsoft Corporation | 0,00 | −2,84 | 1,94 | 28,69 | 1,7488 | 0,3509 | |||
| GMED / Globus Medical, Inc. | 0,03 | −0,91 | 1,90 | −20,08 | 1,7156 | −0,4942 | |||
| WCC / WESCO International, Inc. | 0,01 | 0,00 | 1,88 | 19,25 | 1,6932 | 0,2321 | |||
| SYNA / Synaptics Incorporated | 0,02 | 0,00 | 1,60 | 1,78 | 1,4450 | −0,0168 | |||
| FICO / Fair Isaac Corporation | 0,00 | 0,00 | 1,59 | −0,93 | 1,4377 | −0,0549 | |||
| AAPL / Apple Inc. | 0,01 | −2,79 | 1,58 | −10,23 | 1,4249 | −0,2082 | |||
| VNDA / Vanda Pharmaceuticals Inc. | 0,33 | 0,00 | 1,56 | 2,84 | 1,4041 | −0,0010 | |||
| ZEUS / Olympic Steel, Inc. | 0,05 | 1,55 | 1,3999 | 1,3999 | |||||
| ENR / Energizer Holdings, Inc. | 0,07 | 0,00 | 1,51 | −32,62 | 1,3603 | −0,7173 | |||
| ITIC / Investors Title Company | 0,01 | 1,47 | 1,3219 | 1,3219 | |||||
| RRX / Regal Rexnord Corporation | 0,01 | 0,00 | 1,44 | 27,27 | 1,3012 | 0,2495 | |||
| GOOGL / Alphabet Inc. | 0,01 | 0,00 | 1,44 | 14,00 | 1,2999 | 0,1261 | |||
| NSP / Insperity, Inc. | 0,02 | 0,00 | 1,44 | −32,65 | 1,2996 | −0,6854 | |||
| AXP / American Express Company | 0,00 | −2,21 | 1,44 | 15,94 | 1,2996 | 0,1461 | |||
| JPM / JPMorgan Chase & Co. | 0,00 | −3,83 | 1,34 | 13,66 | 1,2089 | 0,1144 | |||
| APOG / Apogee Enterprises, Inc. | 0,03 | 1,27 | 1,1494 | 1,1494 | |||||
| V / Visa Inc. | 0,00 | −15,48 | 1,26 | −14,34 | 1,1369 | −0,2294 | |||
| HP / Helmerich & Payne, Inc. | 0,08 | 0,00 | 1,24 | −41,97 | 1,1180 | −0,8643 | |||
| HD / The Home Depot, Inc. | 0,00 | −3,52 | 1,21 | −3,50 | 1,0956 | −0,0726 | |||
| DIS / The Walt Disney Company | 0,01 | −3,53 | 1,14 | 21,26 | 1,0241 | 0,1546 | |||
| ABBV / AbbVie Inc. | 0,01 | 0,00 | 1,12 | −11,45 | 1,0117 | −0,1635 | |||
| GSCE / GS Connect S&P GSCI Enhanced Commodity Total Return ETN | 0,00 | 0,00 | 1,07 | 29,53 | 0,9620 | 0,1979 | |||
| FDS / FactSet Research Systems Inc. | 0,00 | 0,00 | 1,05 | −1,59 | 0,9477 | −0,0436 | |||
| RS / Reliance, Inc. | 0,00 | −15,77 | 1,05 | −8,46 | 0,9468 | −0,1172 | |||
| COST / Costco Wholesale Corporation | 0,00 | 0,00 | 1,02 | 4,70 | 0,9241 | 0,0156 | |||
| ROL / Rollins, Inc. | 0,02 | 0,00 | 0,88 | 4,40 | 0,7915 | 0,0115 | |||
| MODG / Topgolf Callaway Brands Corp. | 0,11 | 0,00 | 0,86 | 22,11 | 0,7725 | 0,1217 | |||
| VSCO / Victoria's Secret & Co. | 0,04 | −1,67 | 0,76 | −2,07 | 0,6837 | −0,0342 | |||
| HOV / Hovnanian Enterprises, Inc. | 0,01 | 0,00 | 0,73 | −0,14 | 0,6597 | −0,0202 | |||
| AMGN / Amgen Inc. | 0,00 | −5,90 | 0,72 | −15,67 | 0,6510 | −0,1434 | |||
| INTC / Intel Corporation | 0,03 | −4,06 | 0,72 | −5,42 | 0,6462 | −0,0565 | |||
| WGO / Winnebago Industries, Inc. | 0,02 | −32,23 | 0,71 | −43,01 | 0,6436 | −0,5176 | |||
| GJR / Strats Trust For Procter & Gambel Security - Preferred Security | 0,00 | −5,01 | 0,71 | −11,19 | 0,6373 | −0,1012 | |||
| PEP / PepsiCo, Inc. | 0,01 | −4,18 | 0,70 | −15,53 | 0,6279 | −0,1379 | |||
| CSCO / Cisco Systems, Inc. | 0,01 | 0,00 | 0,69 | 12,38 | 0,6227 | 0,0527 | |||
| NKE / NIKE, Inc. | 0,01 | −3,97 | 0,67 | 7,53 | 0,6053 | 0,0257 | |||
| XYZ / Block, Inc. | 0,01 | −4,64 | 0,66 | 19,27 | 0,5922 | 0,0811 | |||
| TTWO / Take-Two Interactive Software, Inc. | 0,00 | 0,00 | 0,64 | 17,16 | 0,5730 | 0,0698 | |||
| URI / United Rentals, Inc. | 0,00 | −4,18 | 0,60 | 15,27 | 0,5450 | 0,0581 | |||
| EGBN / Eagle Bancorp, Inc. | 0,03 | −43,57 | 0,59 | −47,69 | 0,5319 | −0,5139 | |||
| F / Ford Motor Company | 0,05 | 0,00 | 0,59 | 8,12 | 0,5291 | 0,0258 | |||
| MKC.V / McCormick & Company, Incorporated | 0,01 | 0,00 | 0,57 | −7,88 | 0,5173 | −0,0606 | |||
| UNH / UnitedHealth Group Incorporated | 0,00 | −2,72 | 0,56 | −42,06 | 0,5037 | −0,3908 | |||
| HON / Honeywell International Inc. | 0,00 | 0,00 | 0,45 | 9,95 | 0,4094 | 0,0263 | |||
| SBUX / Starbucks Corporation | 0,00 | 0,00 | 0,38 | −6,63 | 0,3433 | −0,0349 | |||
| AKAM / Akamai Technologies, Inc. | 0,00 | 0,00 | 0,33 | −0,91 | 0,2953 | −0,0114 | |||
| PFE / Pfizer Inc. | 0,01 | 0,00 | 0,28 | −4,10 | 0,2535 | −0,0192 | |||
| EMN / Eastman Chemical Company | 0,00 | 0,00 | 0,27 | −15,05 | 0,2445 | −0,0524 | |||
| SAM / The Boston Beer Company, Inc. | 0,00 | −57,40 | 0,26 | −66,06 | 0,2372 | −0,4800 | |||
| GOOG / Alphabet Inc. | 0,00 | −18,32 | 0,26 | −7,22 | 0,2325 | −0,0255 | |||
| WM / Waste Management, Inc. | 0,00 | 0,00 | 0,22 | −1,34 | 0,2000 | −0,0082 | |||
| ADBE / Adobe Inc. | 0,00 | −61,11 | 0,21 | −60,78 | 0,1905 | −0,3093 | |||
| KMB / Kimberly-Clark Corporation | 0,00 | −100,00 | 0,00 | 0,0000 | |||||
| PDCO / Patterson Companies, Inc. | 0,00 | −100,00 | 0,00 | 0,0000 | |||||
| LLY / Eli Lilly and Company | 0,00 | −100,00 | 0,00 | 0,0000 |