Grundläggande statistik
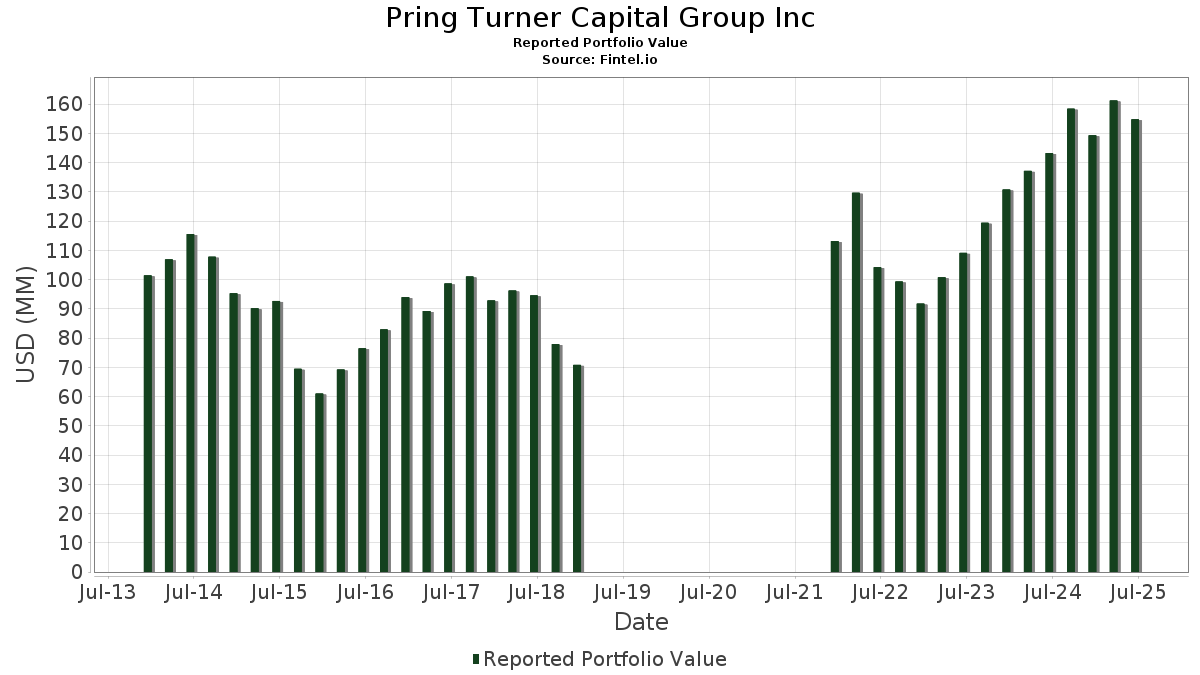
| Portföljvärde | $ 154 778 312 |
| Aktuella positioner | 67 |
Senaste innehav, resultat, förvaltat kapital (från 13F, 13D)
Pring Turner Capital Group Inc har redovisat 67 totala innehav i sina senaste SEC-arkiveringar. Det senaste portföljvärdet beräknas vara $ 154 778 312 USD. Faktiskt förvaltade tillgångar (AUM) är detta värde plus likvida medel (som inte redovisas). Pring Turner Capital Group Incs största innehav är Oracle Corporation (US:ORCL) , Texas Instruments Incorporated (US:TXN) , The Charles Schwab Corporation (US:SCHW) , ProShares Trust - ProShares S&P 500 Dividend Aristocrats ETF (US:NOBL) , and Cummins Inc. (US:CMI) . Pring Turner Capital Group Incs nya positioner inkluderar Camden Property Trust (US:CPT) , EMCOR Group, Inc. (US:EME) , .
Största ökningarna detta kvartal
Vi använder förändringen i portföljallokeringen eftersom det är det mest meningsfulla måttet. Förändringar kan bero på transaktioner eller förändringar i aktiekurser.
| Värdepapper | Aktier (MM) |
Värde (MM$) |
Portfölj % av | ΔPortfölj % av |
|---|---|---|---|---|
| 0,04 | 9,62 | 6,2133 | 2,3392 | |
| 0,04 | 7,72 | 4,9860 | 1,4258 | |
| 0,01 | 4,76 | 3,0723 | 0,8397 | |
| 0,08 | 7,33 | 4,7360 | 0,8029 | |
| 0,01 | 4,12 | 2,6630 | 0,6934 | |
| 0,02 | 5,40 | 3,4913 | 0,6638 | |
| 0,01 | 0,78 | 0,5049 | 0,5049 | |
| 0,01 | 4,64 | 3,0007 | 0,3087 | |
| 0,00 | 1,70 | 1,0982 | 0,2998 | |
| 0,04 | 3,03 | 1,9586 | 0,2520 |
Största minskningarna detta kvartal
Vi använder förändringen i portföljallokeringen eftersom det är det mest meningsfulla måttet. Förändringar kan bero på transaktioner eller förändringar i aktiepriser.
| Värdepapper | Aktier (MM) |
Värde (MM$) |
Portfölj % av | ΔPortfölj % av |
|---|---|---|---|---|
| 0,09 | 4,43 | 2,8636 | −1,2089 | |
| 0,00 | 0,33 | 0,2122 | −0,5587 | |
| 0,01 | 1,58 | 1,0190 | −0,4402 | |
| 0,02 | 3,28 | 2,1213 | −0,4391 | |
| 0,02 | 2,95 | 1,9044 | −0,4159 | |
| 0,07 | 3,07 | 1,9824 | −0,3370 | |
| 0,03 | 3,61 | 2,3338 | −0,2650 | |
| 0,00 | 1,83 | 1,1835 | −0,2360 | |
| 0,04 | 5,55 | 3,5836 | −0,1833 | |
| 0,07 | 4,51 | 2,9169 | −0,1284 |
13F- och fond arkiveringar
Denna blankett lämnades in den 2025-08-12 för rapporteringsperioden 2025-06-30. Klicka på länksymbolen för att se hela transaktionshistoriken.
Uppgradera för att låsa upp premiumdata och exportera till Excel![]() .
.
| Värdepapper | Typ | Genomsnittligt aktiepris | Aktier (MM) |
ΔAktier (%) |
ΔAktier (%) |
Värde ($MM) |
Portfölj (%) |
ΔPortfölj (%) |
|
|---|---|---|---|---|---|---|---|---|---|
| ORCL / Oracle Corporation | 0,04 | −1,52 | 9,62 | 54,00 | 6,2133 | 2,3392 | |||
| TXN / Texas Instruments Incorporated | 0,04 | 16,39 | 7,72 | 34,49 | 4,9860 | 1,4258 | |||
| SCHW / The Charles Schwab Corporation | 0,08 | −0,80 | 7,33 | 15,62 | 4,7360 | 0,8029 | |||
| NOBL / ProShares Trust - ProShares S&P 500 Dividend Aristocrats ETF | 0,07 | −4,13 | 7,32 | −5,53 | 4,7270 | −0,0770 | |||
| CMI / Cummins Inc. | 0,02 | −1,34 | 5,59 | 3,08 | 3,6126 | 0,2475 | |||
| MAA / Mid-America Apartment Communities, Inc. | 0,04 | 3,42 | 5,55 | −8,66 | 3,5836 | −0,1833 | |||
| PSA / Public Storage | 0,02 | −0,45 | 5,50 | −2,41 | 3,5532 | 0,0574 | |||
| AXP / American Express Company | 0,02 | 0,00 | 5,40 | 18,56 | 3,4913 | 0,6638 | |||
| HD / The Home Depot, Inc. | 0,01 | −1,06 | 5,40 | −1,03 | 3,4861 | 0,1042 | |||
| PLD / Prologis, Inc. | 0,05 | −1,04 | 5,34 | −6,93 | 3,4522 | −0,1097 | |||
| UNP / Union Pacific Corporation | 0,02 | −0,87 | 4,83 | −3,46 | 3,1182 | 0,0170 | |||
| MSFT / Microsoft Corporation | 0,01 | −0,28 | 4,76 | 32,16 | 3,0723 | 0,8397 | |||
| MCK / McKesson Corporation | 0,01 | −1,71 | 4,64 | 7,03 | 3,0007 | 0,3087 | |||
| KMI / Kinder Morgan, Inc. | 0,16 | −1,58 | 4,62 | 1,43 | 2,9826 | 0,1588 | |||
| ELS / Equity LifeStyle Properties, Inc. | 0,07 | −0,53 | 4,51 | −8,03 | 2,9169 | −0,1284 | |||
| BAC / Bank of America Corporation | 0,09 | −40,46 | 4,43 | −32,48 | 2,8636 | −1,2089 | |||
| ETN / Eaton Corporation plc | 0,01 | −1,15 | 4,12 | 29,84 | 2,6630 | 0,6934 | |||
| WPM / Wheaton Precious Metals Corp. | 0,04 | −17,23 | 3,98 | −4,26 | 2,5728 | −0,0073 | |||
| ATO / Atmos Energy Corporation | 0,03 | −0,96 | 3,93 | −1,26 | 2,5366 | 0,0699 | |||
| CVX / Chevron Corporation | 0,03 | 0,74 | 3,61 | −13,77 | 2,3338 | −0,2650 | |||
| BRK.B / Berkshire Hathaway Inc. | 0,01 | 0,29 | 3,41 | −8,51 | 2,2013 | −0,1094 | |||
| RGLD / Royal Gold, Inc. | 0,02 | −26,86 | 3,28 | −20,45 | 2,1213 | −0,4391 | |||
| OXY / Occidental Petroleum Corporation | 0,07 | −3,58 | 3,07 | −17,92 | 1,9824 | −0,3370 | |||
| WFC / Wells Fargo & Company | 0,04 | −1,27 | 3,03 | 10,18 | 1,9586 | 0,2520 | |||
| CLX / The Clorox Company | 0,02 | −3,35 | 2,95 | −21,20 | 1,9044 | −0,4159 | |||
| IDA / IDACORP, Inc. | 0,02 | −2,14 | 2,85 | −2,77 | 1,8381 | 0,0226 | |||
| RTX / RTX Corporation | 0,01 | 0,00 | 1,96 | 10,22 | 1,2689 | 0,1637 | |||
| AAPL / Apple Inc. | 0,01 | −0,20 | 1,88 | −7,81 | 1,2124 | −0,0504 | |||
| TPL / Texas Pacific Land Corporation | 0,00 | 0,41 | 1,83 | −19,97 | 1,1835 | −0,2360 | |||
| META / Meta Platforms, Inc. | 0,00 | 3,13 | 1,70 | 32,01 | 1,0982 | 0,2998 | |||
| AMP / Ameriprise Financial, Inc. | 0,00 | 0,00 | 1,70 | 10,28 | 1,0952 | 0,1414 | |||
| FNV / Franco-Nevada Corporation | 0,01 | −35,55 | 1,58 | −32,95 | 1,0190 | −0,4402 | |||
| XOM / Exxon Mobil Corporation | 0,01 | 0,00 | 1,56 | −9,37 | 1,0071 | −0,0597 | |||
| GE / General Electric Company | 0,01 | −5,28 | 1,39 | 21,79 | 0,8958 | 0,1897 | |||
| CARR / Carrier Global Corporation | 0,02 | 0,00 | 1,11 | 15,42 | 0,7164 | 0,1205 | |||
| CHH / Choice Hotels International, Inc. | 0,01 | 5,66 | 1,07 | 1,04 | 0,6907 | 0,0338 | |||
| CPT / Camden Property Trust | 0,01 | 0,78 | 0,5049 | 0,5049 | |||||
| GEV / GE Vernova Inc. | 0,00 | −4,89 | 0,77 | 65,10 | 0,4985 | 0,2081 | |||
| GJR / Strats Trust For Procter & Gambel Security - Preferred Security | 0,00 | −11,17 | 0,76 | −16,94 | 0,4913 | −0,0767 | |||
| OTIS / Otis Worldwide Corporation | 0,01 | 0,00 | 0,75 | −3,97 | 0,4846 | −0,0003 | |||
| JNJ / Johnson & Johnson | 0,00 | 0,00 | 0,69 | −7,81 | 0,4426 | −0,0188 | |||
| DRI / Darden Restaurants, Inc. | 0,00 | 0,00 | 0,65 | 4,82 | 0,4225 | 0,0358 | |||
| GOOG / Alphabet Inc. | 0,00 | 1,19 | 0,65 | 14,87 | 0,4195 | 0,0689 | |||
| MRK / Merck & Co., Inc. | 0,01 | −9,03 | 0,52 | −19,69 | 0,3347 | −0,0659 | |||
| GIS / General Mills, Inc. | 0,01 | 0,00 | 0,49 | −13,38 | 0,3180 | −0,0344 | |||
| SPY / SPDR S&P 500 ETF | 0,00 | 0,00 | 0,41 | 10,40 | 0,2679 | 0,0350 | |||
| JPM / JPMorgan Chase & Co. | 0,00 | 0,00 | 0,38 | 18,13 | 0,2445 | 0,0459 | |||
| PM / Philip Morris International Inc. | 0,00 | −0,77 | 0,35 | 13,92 | 0,2275 | 0,0356 | |||
| VSAT / Viasat, Inc. | 0,02 | 0,00 | 0,34 | 40,57 | 0,2217 | 0,0698 | |||
| AMT / American Tower Corporation | 0,00 | −73,98 | 0,33 | −73,59 | 0,2122 | −0,5587 | |||
| KKR / KKR & Co. Inc. | 0,00 | 0,00 | 0,31 | 14,98 | 0,1990 | 0,0329 | |||
| CHD / Church & Dwight Co., Inc. | 0,00 | 0,00 | 0,31 | −12,57 | 0,1978 | −0,0197 | |||
| CSCO / Cisco Systems, Inc. | 0,00 | 0,00 | 0,31 | 12,55 | 0,1972 | 0,0288 | |||
| LLY / Eli Lilly and Company | 0,00 | 0,00 | 0,30 | −5,61 | 0,1959 | −0,0034 | |||
| KO / The Coca-Cola Company | 0,00 | −6,66 | 0,29 | −7,72 | 0,1857 | −0,0077 | |||
| EMR / Emerson Electric Co. | 0,00 | 0,00 | 0,28 | 21,74 | 0,1814 | 0,0382 | |||
| CI / The Cigna Group | 0,00 | −6,12 | 0,28 | −5,76 | 0,1801 | −0,0032 | |||
| PAR / PAR Technology Corporation | 0,00 | 0,00 | 0,27 | 13,14 | 0,1730 | 0,0261 | |||
| SRE / Sempra | 0,00 | 0,00 | 0,27 | 6,43 | 0,1714 | 0,0164 | |||
| SCHA / Schwab Strategic Trust - Schwab U.S. Small-Cap ETF | 0,01 | 0,00 | 0,24 | 7,76 | 0,1530 | 0,0170 | |||
| GPC / Genuine Parts Company | 0,00 | −2,74 | 0,24 | −0,84 | 0,1528 | 0,0046 | |||
| RACE / Ferrari N.V. | 0,00 | 0,22 | 0,1452 | 0,1452 | |||||
| AMZN / Amazon.com, Inc. | 0,00 | 0,22 | 0,1417 | 0,1417 | |||||
| EME / EMCOR Group, Inc. | 0,00 | 0,21 | 0,1386 | 0,1386 | |||||
| VZ / Verizon Communications Inc. | 0,00 | 0,08 | 0,21 | −4,46 | 0,1383 | −0,0008 | |||
| TSLA / Tesla, Inc. | 0,00 | 0,21 | 0,1334 | 0,1334 | |||||
| ALL / The Allstate Corporation | 0,00 | 0,00 | 0,20 | −2,90 | 0,1301 | 0,0016 | |||
| SCHM / Schwab Strategic Trust - Schwab U.S. Mid-Cap ETF | 0,00 | −100,00 | 0,00 | 0,0000 | |||||
| DUK / Duke Energy Corporation | 0,00 | −100,00 | 0,00 | 0,0000 | |||||
| NEE / NextEra Energy, Inc. | 0,00 | −100,00 | 0,00 | 0,0000 | |||||
| PEP / PepsiCo, Inc. | 0,00 | −100,00 | 0,00 | 0,0000 |