Grundläggande statistik
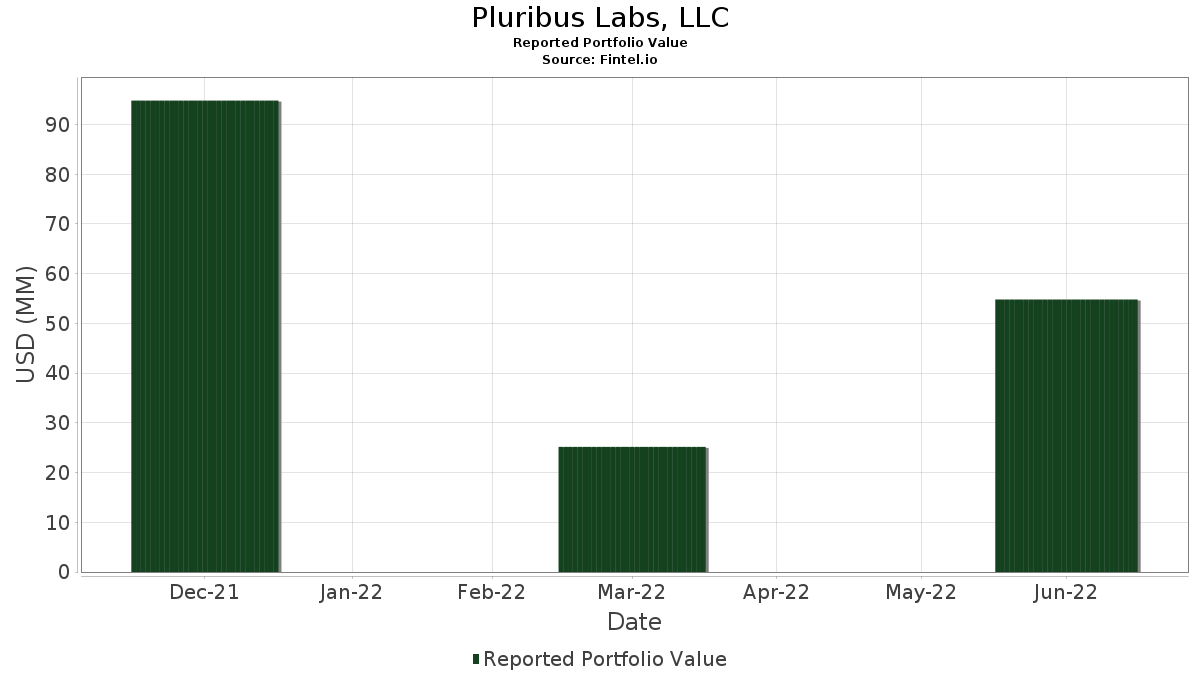
| Portföljvärde | $ 54 810 000 |
| Aktuella positioner | 86 |
Senaste innehav, resultat, förvaltat kapital (från 13F, 13D)
Pluribus Labs, LLC har redovisat 86 totala innehav i sina senaste SEC-arkiveringar. Det senaste portföljvärdet beräknas vara $ 54 810 000 USD. Faktiskt förvaltade tillgångar (AUM) är detta värde plus likvida medel (som inte redovisas). Pluribus Labs, LLCs största innehav är Apple Inc. (US:AAPL) , Microsoft Corporation (US:MSFT) , Alphabet Inc. (US:GOOGL) , Amazon.com, Inc. (US:AMZN) , and Berkshire Hathaway Inc. (US:BRK.B) . Pluribus Labs, LLCs nya positioner inkluderar Cisco Systems, Inc. (US:CSCO) , Mondelez International, Inc. (US:MDLZ) , Northrop Grumman Corporation (US:NOC) , Bristol-Myers Squibb Company (US:BMY) , and Intuitive Surgical, Inc. (US:ISRG) .
Största ökningarna detta kvartal
Vi använder förändringen i portföljallokeringen eftersom det är det mest meningsfulla måttet. Förändringar kan bero på transaktioner eller förändringar i aktiekurser.
| Värdepapper | Aktier (MM) |
Värde (MM$) |
Portfölj % av | ΔPortfölj % av |
|---|---|---|---|---|
| 0,02 | 0,71 | 1,2936 | 1,2936 | |
| 0,01 | 0,69 | 1,2680 | 1,2680 | |
| 0,00 | 0,59 | 1,0783 | 1,0783 | |
| 0,01 | 0,48 | 0,8758 | 0,8758 | |
| 0,00 | 0,47 | 0,8612 | 0,8612 | |
| 0,00 | 0,46 | 0,8466 | 0,8466 | |
| 0,00 | 0,41 | 0,7553 | 0,7553 | |
| 0,00 | 0,40 | 0,7261 | 0,7261 | |
| 0,00 | 0,40 | 0,7243 | 0,7243 | |
| 0,02 | 0,36 | 0,6532 | 0,6532 |
Största minskningarna detta kvartal
Vi använder förändringen i portföljallokeringen eftersom det är det mest meningsfulla måttet. Förändringar kan bero på transaktioner eller förändringar i aktiepriser.
| Värdepapper | Aktier (MM) |
Värde (MM$) |
Portfölj % av | ΔPortfölj % av |
|---|---|---|---|---|
| 0,02 | 3,98 | 7,2614 | −4,4479 | |
| 0,02 | 2,59 | 4,7199 | −4,2955 | |
| 0,01 | 1,12 | 2,0379 | −1,9870 | |
| 0,04 | 5,37 | 9,8011 | −1,8843 | |
| 0,00 | 3,53 | 6,4331 | −1,5890 | |
| 0,00 | 0,00 | −1,4105 | ||
| 0,00 | 1,12 | 2,0489 | −1,1814 | |
| 0,00 | 0,00 | −1,1483 | ||
| 0,00 | 0,56 | 1,0162 | −1,0777 | |
| 0,00 | 0,00 | −1,0132 |
13F- och fond arkiveringar
Denna blankett lämnades in den 2022-08-12 för rapporteringsperioden 2022-06-30. Klicka på länksymbolen för att se hela transaktionshistoriken.
Uppgradera för att låsa upp premiumdata och exportera till Excel![]() .
.
| Värdepapper | Typ | Genomsnittligt aktiepris | Aktier (MM) |
ΔAktier (%) |
ΔAktier (%) |
Värde ($MM) |
Portfölj (%) |
ΔPortfölj (%) |
|
|---|---|---|---|---|---|---|---|---|---|
| AAPL / Apple Inc. | 0,04 | 133,22 | 5,37 | 82,66 | 9,8011 | −1,8843 | |||
| MSFT / Microsoft Corporation | 0,02 | 62,12 | 3,98 | 35,05 | 7,2614 | −4,4479 | |||
| GOOGL / Alphabet Inc. | 0,00 | 122,87 | 3,53 | 74,64 | 6,4331 | −1,5890 | |||
| AMZN / Amazon.com, Inc. | 0,02 | 3 400,00 | 2,59 | 14,01 | 4,7199 | −4,2955 | |||
| BRK.B / Berkshire Hathaway Inc. | 0,01 | 135,47 | 1,92 | 82,15 | 3,4994 | −0,6845 | |||
| MRK / Merck & Co., Inc. | 0,02 | 141,73 | 1,41 | 168,44 | 2,5762 | 0,4862 | |||
| LLY / Eli Lilly and Company | 0,00 | 151,78 | 1,19 | 184,73 | 2,1766 | 0,5118 | |||
| TSLA / Tesla, Inc. | 0,00 | 121,09 | 1,12 | 38,13 | 2,0489 | −1,1814 | |||
| NVDA / NVIDIA Corporation | 0,01 | 98,44 | 1,12 | 10,27 | 2,0379 | −1,9870 | |||
| COST / Costco Wholesale Corporation | 0,00 | 169,01 | 1,10 | 123,98 | 2,0106 | 0,0557 | |||
| HD / The Home Depot, Inc. | 0,00 | 148,63 | 1,04 | 128,01 | 1,9011 | 0,0853 | |||
| AMJ / JPMorgan Alerian MLP Index ETN - Corporate Bond/Note | 0,01 | 123,88 | 0,98 | 84,80 | 1,7971 | −0,3207 | |||
| T / AT&T Inc. | 0,05 | 173,54 | 0,95 | 142,46 | 1,7296 | 0,1761 | |||
| HON / Honeywell International Inc. | 0,00 | 110,82 | 0,87 | 88,48 | 1,5818 | −0,2459 | |||
| JNJ / Johnson & Johnson | 0,00 | 48,46 | 0,83 | 48,57 | 1,5180 | −0,7071 | |||
| LMT / Lockheed Martin Corporation | 0,00 | 144,90 | 0,80 | 138,58 | 1,4669 | 0,1279 | |||
| CSCO / Cisco Systems, Inc. | 0,02 | 0,71 | 1,2936 | 1,2936 | |||||
| C.WSA / Citigroup, Inc. | 0,00 | 142,56 | 0,70 | 93,15 | 1,2863 | −0,1640 | |||
| MDLZ / Mondelez International, Inc. | 0,01 | 0,69 | 1,2680 | 1,2680 | |||||
| BAC.PRB / Bank of America Corporation - Preferred Stock | 0,02 | 121,83 | 0,68 | 67,32 | 1,2425 | −0,3747 | |||
| CB / Chubb Limited | 0,00 | 127,13 | 0,68 | 108,98 | 1,2315 | −0,0518 | |||
| ADI / Analog Devices, Inc. | 0,00 | 95,47 | 0,62 | 72,85 | 1,1385 | −0,2959 | |||
| NFLX / Netflix, Inc. | 0,00 | 497,80 | 0,62 | 179,64 | 1,1275 | 0,2494 | |||
| NOC / Northrop Grumman Corporation | 0,00 | 0,59 | 1,0783 | 1,0783 | |||||
| REGN / Regeneron Pharmaceuticals, Inc. | 0,00 | 102,77 | 0,56 | 71,65 | 1,0272 | −0,2761 | |||
| MMM / 3M Company | 0,00 | 211,10 | 0,56 | 170,19 | 1,0254 | 0,1989 | |||
| WMT / Walmart Inc. | 0,00 | 29,47 | 0,56 | 5,69 | 1,0162 | −1,0777 | |||
| CMCSA / Comcast Corporation | 0,01 | 200,37 | 0,54 | 152,11 | 0,9797 | 0,1334 | |||
| MDT / Medtronic plc | 0,01 | 178,43 | 0,49 | 125,57 | 0,9013 | 0,0311 | |||
| MCK / McKesson Corporation | 0,00 | 81,59 | 0,49 | 93,70 | 0,8976 | −0,1116 | |||
| BMY / Bristol-Myers Squibb Company | 0,01 | 0,48 | 0,8758 | 0,8758 | |||||
| ISRG / Intuitive Surgical, Inc. | 0,00 | 0,47 | 0,8612 | 0,8612 | |||||
| SNPS / Synopsys, Inc. | 0,00 | 0,46 | 0,8466 | 0,8466 | |||||
| APD / Air Products and Chemicals, Inc. | 0,00 | 135,21 | 0,46 | 125,98 | 0,8411 | 0,0305 | |||
| IBM / International Business Machines Corporation | 0,00 | 20,06 | 0,42 | 30,31 | 0,7608 | −0,5106 | |||
| HCA / HCA Healthcare, Inc. | 0,00 | 0,41 | 0,7553 | 0,7553 | |||||
| NXPI / NXP Semiconductors N.V. | 0,00 | 105,82 | 0,40 | 64,49 | 0,7353 | −0,2382 | |||
| MSI / Motorola Solutions, Inc. | 0,00 | 0,40 | 0,7261 | 0,7261 | |||||
| WELL / Welltower Inc. | 0,00 | 0,40 | 0,7243 | 0,7243 | |||||
| RMD / ResMed Inc. | 0,00 | 106,74 | 0,38 | 79,25 | 0,6933 | −0,1490 | |||
| DXCM / DexCom, Inc. | 0,00 | 802,17 | 0,37 | 31,80 | 0,6805 | −0,4439 | |||
| PLD / Prologis, Inc. | 0,00 | 32,54 | 0,37 | −3,43 | 0,6678 | −0,8381 | |||
| KMI / Kinder Morgan, Inc. | 0,02 | 0,36 | 0,6532 | 0,6532 | |||||
| ECL / Ecolab Inc. | 0,00 | 0,35 | 0,6331 | 0,6331 | |||||
| KEYS / Keysight Technologies, Inc. | 0,00 | 0,34 | 0,6294 | 0,6294 | |||||
| DG / Dollar General Corporation | 0,00 | 0,34 | 0,6221 | 0,6221 | |||||
| AEE / Ameren Corporation | 0,00 | 0,34 | 0,6167 | 0,6167 | |||||
| ROK / Rockwell Automation, Inc. | 0,00 | 0,33 | 0,6057 | 0,6057 | |||||
| DE / Deere & Company | 0,00 | 0,33 | 0,5984 | 0,5984 | |||||
| ABC / Amerisource Bergen Corp. | 0,00 | 0,33 | 0,5948 | 0,5948 | |||||
| EA / Electronic Arts Inc. | 0,00 | 0,32 | 0,5911 | 0,5911 | |||||
| AME / AMETEK, Inc. | 0,00 | 0,32 | 0,5857 | 0,5857 | |||||
| CMI / Cummins Inc. | 0,00 | 0,32 | 0,5802 | 0,5802 | |||||
| ANSS / ANSYS, Inc. | 0,00 | 0,32 | 0,5802 | 0,5802 | |||||
| VTR / Ventas, Inc. | 0,01 | 0,32 | 0,5784 | 0,5784 | |||||
| TTWO / Take-Two Interactive Software, Inc. | 0,00 | 0,31 | 0,5619 | 0,5619 | |||||
| SE / Sea Limited - Depositary Receipt (Common Stock) | 0,00 | 116,27 | 0,30 | 20,56 | 0,5455 | −0,4399 | |||
| MMC / Marsh & McLennan Companies, Inc. | 0,00 | 0,29 | 0,5291 | 0,5291 | |||||
| J / Jacobs Solutions Inc. | 0,00 | 0,29 | 0,5273 | 0,5273 | |||||
| ADM / Archer-Daniels-Midland Company | 0,00 | 0,29 | 0,5236 | 0,5236 | |||||
| EXPD / Expeditors International of Washington, Inc. | 0,00 | 0,29 | 0,5236 | 0,5236 | |||||
| INTC / Intel Corporation | 0,01 | 0,29 | 0,5218 | 0,5218 | |||||
| BAH / Booz Allen Hamilton Holding Corporation | 0,00 | 0,28 | 0,5200 | 0,5200 | |||||
| AES / The AES Corporation | 0,01 | 0,28 | 0,5163 | 0,5163 | |||||
| DGX / Quest Diagnostics Incorporated | 0,00 | 0,28 | 0,5145 | 0,5145 | |||||
| AKAM / Akamai Technologies, Inc. | 0,00 | 0,28 | 0,5127 | 0,5127 | |||||
| LDOS / Leidos Holdings, Inc. | 0,00 | 0,28 | 0,5036 | 0,5036 | |||||
| SUI / Sun Communities, Inc. | 0,00 | 0,28 | 0,5036 | 0,5036 | |||||
| DLTR / Dollar Tree, Inc. | 0,00 | 0,27 | 0,4999 | 0,4999 | |||||
| TXT / Textron Inc. | 0,00 | 0,27 | 0,4999 | 0,4999 | |||||
| XOM / Exxon Mobil Corporation | 0,00 | 8,57 | 0,27 | 12,40 | 0,4963 | −0,4653 | |||
| ABBV / AbbVie Inc. | 0,00 | −17,03 | 0,27 | −21,57 | 0,4908 | −0,8721 | |||
| GD / General Dynamics Corporation | 0,00 | 0,27 | 0,4908 | 0,4908 | |||||
| TWLO / Twilio Inc. | 0,00 | 0,26 | 0,4744 | 0,4744 | |||||
| BG / Bunge Global SA | 0,00 | 0,26 | 0,4671 | 0,4671 | |||||
| TDY / Teledyne Technologies Incorporated | 0,00 | 0,26 | 0,4652 | 0,4652 | |||||
| BBY / Best Buy Co., Inc. | 0,00 | 0,25 | 0,4488 | 0,4488 | |||||
| CME / CME Group Inc. | 0,00 | 37,96 | 0,24 | 18,45 | 0,4452 | −0,3733 | |||
| CVX / Chevron Corporation | 0,00 | 0,91 | 0,24 | −10,41 | 0,4397 | −0,6291 | |||
| TDOC / Teladoc Health, Inc. | 0,01 | 0,23 | 0,4269 | 0,4269 | |||||
| CVS / CVS Health Corporation | 0,00 | 0,23 | 0,4215 | 0,4215 | |||||
| CHRW / C.H. Robinson Worldwide, Inc. | 0,00 | 0,23 | 0,4178 | 0,4178 | |||||
| WRK / WestRock Company | 0,01 | 0,23 | 0,4160 | 0,4160 | |||||
| KO / The Coca-Cola Company | 0,00 | 0,22 | 0,4050 | 0,4050 | |||||
| CG / The Carlyle Group Inc. | 0,01 | 0,22 | 0,3996 | 0,3996 | |||||
| GL / Globe Life Inc. | 0,00 | 0,21 | 0,3813 | 0,3813 | |||||
| UPS / United Parcel Service, Inc. | 0,00 | −100,00 | 0,00 | −100,00 | −1,4105 | ||||
| PFE / Pfizer Inc. | 0,00 | −100,00 | 0,00 | −100,00 | −1,0132 | ||||
| TEL / TE Connectivity plc | 0,00 | −100,00 | 0,00 | −100,00 | −0,9059 | ||||
| V / Visa Inc. | 0,00 | −100,00 | 0,00 | −100,00 | −1,1483 | ||||
| META / Meta Platforms, Inc. | 0,00 | −100,00 | 0,00 | −100,00 | −0,8145 | ||||
| DIS / The Walt Disney Company | 0,00 | −100,00 | 0,00 | −100,00 | −0,9099 |