Grundläggande statistik
| Portföljvärde | $ 695 349 899 |
| Aktuella positioner | 142 |
Senaste innehav, resultat, förvaltat kapital (från 13F, 13D)
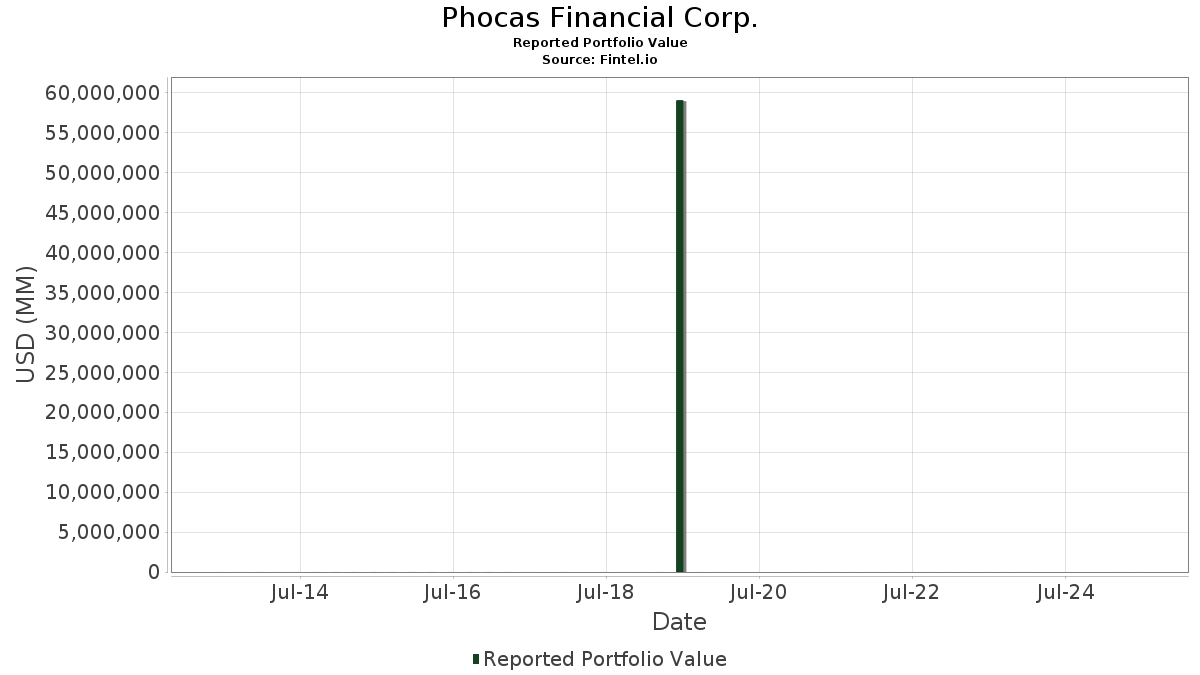
Phocas Financial Corp. har redovisat 142 totala innehav i sina senaste SEC-arkiveringar. Det senaste portföljvärdet beräknas vara $ 695 349 899 USD. Faktiskt förvaltade tillgångar (AUM) är detta värde plus likvida medel (som inte redovisas). Phocas Financial Corp.s största innehav är SkyWest, Inc. (US:SKYW) , TTM Technologies, Inc. (US:TTMI) , Adtalem Global Education Inc. (US:ATGE) , Wintrust Financial Corporation (US:WTFC) , and Pathward Financial, Inc. (US:CASH) . Phocas Financial Corp.s nya positioner inkluderar Concentra Group Holdings Parent, Inc. (US:CON) , Enhabit, Inc. (US:EHAB) , Apellis Pharmaceuticals, Inc. (US:APLS) , Broadcom Inc. (US:AVGO) , and .
Största ökningarna detta kvartal
Vi använder förändringen i portföljallokeringen eftersom det är det mest meningsfulla måttet. Förändringar kan bero på transaktioner eller förändringar i aktiekurser.
| Värdepapper | Aktier (MM) |
Värde (MM$) |
Portfölj % av | ΔPortfölj % av |
|---|---|---|---|---|
| 0,41 | 16,70 | 2,4022 | 1,2882 | |
| 0,80 | 6,74 | 0,9692 | 0,9692 | |
| 0,04 | 5,12 | 0,7370 | 0,7370 | |
| 0,07 | 7,14 | 1,0267 | 0,6552 | |
| 0,14 | 3,55 | 0,5104 | 0,5104 | |
| 0,12 | 7,34 | 1,0563 | 0,5057 | |
| 0,05 | 3,23 | 0,4644 | 0,4644 | |
| 0,15 | 3,17 | 0,4565 | 0,4565 | |
| 0,32 | 3,09 | 0,4450 | 0,4450 | |
| 0,04 | 10,16 | 1,4609 | 0,4401 |
Största minskningarna detta kvartal
Vi använder förändringen i portföljallokeringen eftersom det är det mest meningsfulla måttet. Förändringar kan bero på transaktioner eller förändringar i aktiepriser.
| Värdepapper | Aktier (MM) |
Värde (MM$) |
Portfölj % av | ΔPortfölj % av |
|---|---|---|---|---|
| 0,07 | 3,17 | 0,4559 | −0,4976 | |
| 0,04 | 2,97 | 0,4271 | −0,4678 | |
| 0,36 | 6,30 | 0,9066 | −0,2535 | |
| 0,08 | 6,43 | 0,9242 | −0,2504 | |
| 0,16 | 3,66 | 0,5260 | −0,2232 | |
| 0,22 | 4,96 | 0,7136 | −0,2151 | |
| 0,17 | 9,60 | 1,3801 | −0,2105 | |
| 0,01 | 9,68 | 1,3925 | −0,1993 | |
| 0,03 | 4,84 | 0,6956 | −0,1988 | |
| 0,07 | 12,93 | 1,8588 | −0,1944 |
13F- och fond arkiveringar
Denna blankett lämnades in den 2025-08-06 för rapporteringsperioden 2025-06-30. Klicka på länksymbolen för att se hela transaktionshistoriken.
Uppgradera för att låsa upp premiumdata och exportera till Excel![]() .
.
| Värdepapper | Typ | Genomsnittligt aktiepris | Aktier (MM) |
ΔAktier (%) |
ΔAktier (%) |
Värde ($MM) |
Portfölj (%) |
ΔPortfölj (%) |
|
|---|---|---|---|---|---|---|---|---|---|
| SKYW / SkyWest, Inc. | 0,17 | 0,01 | 17,86 | 17,87 | 2,5680 | 0,2454 | |||
| TTMI / TTM Technologies, Inc. | 0,41 | 15,51 | 16,70 | 129,91 | 2,4022 | 1,2882 | |||
| ATGE / Adtalem Global Education Inc. | 0,12 | 0,01 | 15,76 | 26,45 | 2,2664 | 0,3555 | |||
| WTFC / Wintrust Financial Corporation | 0,12 | 0,01 | 15,01 | 10,26 | 2,1589 | 0,0715 | |||
| CASH / Pathward Financial, Inc. | 0,16 | 0,01 | 12,93 | 8,48 | 1,8588 | 0,0320 | |||
| NXST / Nexstar Media Group, Inc. | 0,07 | 0,01 | 12,93 | −3,48 | 1,8588 | −0,1944 | |||
| PRIM / Primoris Services Corporation | 0,16 | 0,01 | 12,23 | 35,79 | 1,7581 | 0,3777 | |||
| SNEX / StoneX Group Inc. | 0,13 | 0,01 | 12,18 | 19,34 | 1,7513 | 0,1868 | |||
| ABCB / Ameris Bancorp | 0,17 | 0,01 | 11,10 | 12,40 | 1,5966 | 0,0823 | |||
| RRC / Range Resources Corporation | 0,27 | 28,59 | 11,10 | 30,99 | 1,5963 | 0,2970 | |||
| PFBC / Preferred Bank | 0,13 | 0,01 | 11,04 | 3,47 | 1,5874 | −0,0482 | |||
| FHN / First Horizon Corporation | 0,50 | 0,01 | 10,59 | 9,18 | 1,5235 | 0,0359 | |||
| FRME / First Merchants Corporation | 0,27 | 0,02 | 10,21 | −5,28 | 1,4683 | −0,1842 | |||
| KMPR / Kemper Corporation | 0,16 | 0,01 | 10,20 | −3,45 | 1,4667 | −0,1527 | |||
| AMRX / Amneal Pharmaceuticals, Inc. | 1,26 | 0,01 | 10,19 | −3,45 | 1,4654 | −0,1526 | |||
| CRS / Carpenter Technology Corporation | 0,04 | 0,01 | 10,16 | 52,57 | 1,4609 | 0,4401 | |||
| WTM / White Mountains Insurance Group, Ltd. | 0,01 | 0,02 | 9,68 | −6,74 | 1,3925 | −0,1993 | |||
| BKH / Black Hills Corporation | 0,17 | 0,00 | 9,60 | −7,50 | 1,3801 | −0,2105 | |||
| DCO / Ducommun Incorporated | 0,11 | 0,01 | 9,31 | 42,41 | 1,3386 | 0,3365 | |||
| FNB / F.N.B. Corporation | 0,61 | 0,01 | 8,96 | 8,41 | 1,2888 | 0,0215 | |||
| SAH / Sonic Automotive, Inc. | 0,11 | 0,01 | 8,81 | 40,35 | 1,2666 | 0,3045 | |||
| AIR / AAR Corp. | 0,13 | 0,01 | 8,76 | 22,88 | 1,2600 | 0,1668 | |||
| TCBI / Texas Capital Bancshares, Inc. | 0,11 | 0,01 | 8,74 | 6,30 | 1,2563 | −0,0036 | |||
| KD / Kyndryl Holdings, Inc. | 0,21 | −27,63 | 8,72 | −3,29 | 1,2543 | −0,1284 | |||
| SNV / Synovus Financial Corp. | 0,17 | 0,01 | 8,69 | 10,73 | 1,2493 | 0,0466 | |||
| SPTN / SpartanNash Company | 0,32 | 0,01 | 8,60 | 30,78 | 1,2368 | 0,2285 | |||
| SANM / Sanmina Corporation | 0,09 | 0,01 | 8,58 | 28,43 | 1,2333 | 0,2096 | |||
| RHP / Ryman Hospitality Properties, Inc. | 0,08 | −0,03 | 8,37 | 7,87 | 1,2042 | 0,0141 | |||
| ONB / Old National Bancorp | 0,36 | 0,01 | 7,75 | 0,73 | 1,1149 | −0,0651 | |||
| PNFP / Pinnacle Financial Partners, Inc. | 0,07 | 0,02 | 7,64 | 4,14 | 1,0988 | −0,0261 | |||
| OMF / OneMain Holdings, Inc. | 0,13 | 27,59 | 7,47 | 48,80 | 1,0744 | 0,3046 | |||
| OTTR / Otter Tail Corporation | 0,10 | 0,01 | 7,39 | −4,06 | 1,0634 | −0,1183 | |||
| POR / Portland General Electric Company | 0,18 | 0,01 | 7,38 | −8,89 | 1,0613 | −0,1805 | |||
| CSR / Centerspace | 0,12 | 120,02 | 7,34 | 104,51 | 1,0563 | 0,5057 | |||
| CMA / Comerica Incorporated | 0,12 | 0,40 | 7,33 | 1,40 | 1,0540 | −0,0542 | |||
| ADC / Agree Realty Corporation | 0,10 | 0,02 | 7,26 | −5,34 | 1,0434 | −0,1317 | |||
| EFSC / Enterprise Financial Services Corp | 0,13 | 0,01 | 7,22 | 2,54 | 1,0388 | −0,0412 | |||
| BANR / Banner Corporation | 0,11 | 0,01 | 7,14 | 0,61 | 1,0273 | −0,0612 | |||
| MKSI / MKS Inc. | 0,07 | 137,64 | 7,14 | 194,63 | 1,0267 | 0,6552 | |||
| BGC / BGC Group, Inc. | 0,69 | 0,01 | 7,05 | 11,58 | 1,0143 | 0,0452 | |||
| R / Ryder System, Inc. | 0,04 | 0,02 | 7,01 | 10,58 | 1,0087 | 0,0362 | |||
| VRRM / Verra Mobility Corporation | 0,28 | 17,06 | 7,00 | 32,02 | 1,0062 | 0,1938 | |||
| AM / Antero Midstream Corporation | 0,36 | 36,93 | 6,80 | 44,17 | 0,9775 | 0,2546 | |||
| ADT / ADT Inc. | 0,80 | 6,74 | 0,9692 | 0,9692 | |||||
| TPH / Tri Pointe Homes, Inc. | 0,21 | 0,01 | 6,61 | 0,12 | 0,9510 | −0,0617 | |||
| SLG / SL Green Realty Corp. | 0,11 | 0,56 | 6,56 | 7,88 | 0,9434 | 0,0111 | |||
| CHCT / Community Healthcare Trust Incorporated | 0,39 | −0,01 | 6,52 | −8,43 | 0,9375 | −0,1540 | |||
| TRNO / Terreno Realty Corporation | 0,11 | 0,01 | 6,44 | −11,30 | 0,9268 | −0,1871 | |||
| LNTH / Lantheus Holdings, Inc. | 0,08 | 0,01 | 6,43 | −16,11 | 0,9242 | −0,2504 | |||
| IRT / Independence Realty Trust, Inc. | 0,36 | −0,01 | 6,30 | −16,68 | 0,9066 | −0,2535 | |||
| PR / Permian Resources Corporation | 0,45 | 0,00 | 6,17 | −1,66 | 0,8870 | −0,0746 | |||
| KRG / Kite Realty Group Trust | 0,27 | 0,01 | 6,12 | 1,27 | 0,8803 | −0,0464 | |||
| SWX / Southwest Gas Holdings, Inc. | 0,08 | 104,60 | 6,11 | 111,97 | 0,8786 | 0,4367 | |||
| REVG / REV Group, Inc. | 0,13 | 0,01 | 6,06 | 50,63 | 0,8712 | 0,2546 | |||
| NPO / Enpro Inc. | 0,03 | 0,01 | 5,88 | 18,42 | 0,8451 | 0,0842 | |||
| HRI / Herc Holdings Inc. | 0,04 | 0,01 | 5,69 | −1,90 | 0,8180 | −0,0710 | |||
| THS / TreeHouse Foods, Inc. | 0,29 | 152,11 | 5,58 | 80,77 | 0,8018 | 0,3288 | |||
| PPBI / Pacific Premier Bancorp, Inc. | 0,26 | 0,01 | 5,52 | −1,07 | 0,7944 | −0,0616 | |||
| COLB / Columbia Banking System, Inc. | 0,23 | 0,01 | 5,34 | −6,24 | 0,7673 | −0,1052 | |||
| AVNT / Avient Corporation | 0,16 | 0,01 | 5,30 | −13,03 | 0,7619 | −0,1721 | |||
| COHR / Coherent Corp. | 0,06 | 24,83 | 5,13 | 71,51 | 0,7378 | 0,2791 | |||
| BDC / Belden Inc. | 0,04 | 5,12 | 0,7370 | 0,7370 | |||||
| APAM / Artisan Partners Asset Management Inc. | 0,11 | 0,01 | 5,08 | 13,38 | 0,7301 | 0,0437 | |||
| LADR / Ladder Capital Corp | 0,47 | 0,01 | 5,01 | −5,77 | 0,7207 | −0,0947 | |||
| GIII / G-III Apparel Group, Ltd. | 0,22 | 0,01 | 4,96 | −18,08 | 0,7136 | −0,2151 | |||
| ABBV / AbbVie Inc. | 0,03 | 0,00 | 4,87 | −11,41 | 0,7004 | −0,1424 | |||
| BOOT / Boot Barn Holdings, Inc. | 0,03 | −41,40 | 4,84 | −17,09 | 0,6956 | −0,1988 | |||
| URBN / Urban Outfitters, Inc. | 0,06 | 0,02 | 4,63 | 38,45 | 0,6665 | 0,1533 | |||
| PCRX / Pacira BioSciences, Inc. | 0,19 | 35,80 | 4,62 | 30,63 | 0,6649 | 0,1222 | |||
| UMBF / UMB Financial Corporation | 0,04 | 0,01 | 4,48 | 4,04 | 0,6446 | −0,0160 | |||
| MGY / Magnolia Oil & Gas Corporation | 0,19 | 69,01 | 4,26 | 50,42 | 0,6122 | 0,1783 | |||
| NOG / Northern Oil and Gas, Inc. | 0,14 | 0,00 | 4,09 | −6,22 | 0,5879 | −0,0804 | |||
| LZB / La-Z-Boy Incorporated | 0,11 | 0,02 | 3,94 | −4,90 | 0,5663 | −0,0685 | |||
| CHRD / Chord Energy Corporation | 0,04 | 30,99 | 3,83 | 12,55 | 0,5509 | 0,0291 | |||
| FUL / H.B. Fuller Company | 0,06 | 0,02 | 3,83 | 7,22 | 0,5507 | 0,0030 | |||
| LYTS / LSI Industries Inc. | 0,22 | 0,89 | 3,67 | 0,96 | 0,5280 | −0,0296 | |||
| ACHC / Acadia Healthcare Company, Inc. | 0,16 | 0,01 | 3,66 | −25,17 | 0,5260 | −0,2232 | |||
| VBTX / Veritex Holdings, Inc. | 0,14 | 3,55 | 0,5104 | 0,5104 | |||||
| TKR / The Timken Company | 0,05 | 0,02 | 3,49 | 0,96 | 0,5016 | −0,0280 | |||
| CUZ / Cousins Properties Incorporated | 0,11 | 0,01 | 3,42 | 1,82 | 0,4920 | −0,0232 | |||
| VRNT / Verint Systems Inc. | 0,17 | 0,01 | 3,37 | 10,20 | 0,4849 | 0,0159 | |||
| ANGO / AngioDynamics, Inc. | 0,34 | 0,01 | 3,36 | 5,67 | 0,4828 | −0,0043 | |||
| QDEL / QuidelOrtho Corporation | 0,11 | 0,01 | 3,29 | −17,58 | 0,4735 | −0,1389 | |||
| ROCK / Gibraltar Industries, Inc. | 0,05 | 3,23 | 0,4644 | 0,4644 | |||||
| MAC / The Macerich Company | 0,20 | 0,01 | 3,22 | −5,73 | 0,4634 | −0,0608 | |||
| CON / Concentra Group Holdings Parent, Inc. | 0,15 | 3,17 | 0,4565 | 0,4565 | |||||
| AAP / Advance Auto Parts, Inc. | 0,07 | −57,01 | 3,17 | −49,04 | 0,4559 | −0,4976 | |||
| EHAB / Enhabit, Inc. | 0,32 | 3,09 | 0,4450 | 0,4450 | |||||
| ELAN / Elanco Animal Health Incorporated | 0,22 | 0,01 | 3,08 | 36,05 | 0,4424 | 0,0957 | |||
| SHC / Sotera Health Company | 0,27 | 0,01 | 3,05 | −4,61 | 0,4380 | −0,0515 | |||
| ELME / Elme Communities | 0,19 | 0,01 | 2,99 | −8,63 | 0,4297 | −0,0715 | |||
| MTRN / Materion Corporation | 0,04 | −47,69 | 2,97 | −49,13 | 0,4271 | −0,4678 | |||
| GDEN / Golden Entertainment, Inc. | 0,10 | 0,01 | 2,81 | 11,53 | 0,4034 | 0,0178 | |||
| KFRC / Kforce Inc. | 0,07 | 0,02 | 2,71 | −15,85 | 0,3895 | −0,1040 | |||
| EPC / Edgewell Personal Care Company | 0,11 | 0,01 | 2,55 | −24,99 | 0,3674 | −0,1547 | |||
| TWO / Two Harbors Investment Corp. | 0,24 | 0,01 | 2,55 | −19,36 | 0,3673 | −0,1184 | |||
| MDXG / MiMedx Group, Inc. | 0,41 | 0,01 | 2,52 | −19,62 | 0,3619 | −0,1179 | |||
| CRGY / Crescent Energy Company | 0,29 | 0,00 | 2,50 | −23,50 | 0,3602 | −0,1417 | |||
| SCHX / Schwab Strategic Trust - Schwab U.S. Large-Cap ETF | 0,10 | −0,47 | 2,49 | 10,16 | 0,3588 | 0,0116 | |||
| ACAD / ACADIA Pharmaceuticals Inc. | 0,10 | 0,01 | 2,20 | 29,89 | 0,3170 | 0,0568 | |||
| NVDA / NVIDIA Corporation | 0,01 | 0,00 | 2,16 | 45,77 | 0,3101 | 0,0833 | |||
| MSFT / Microsoft Corporation | 0,00 | 0,00 | 2,03 | 32,53 | 0,2919 | 0,0570 | |||
| AAPL / Apple Inc. | 0,01 | 0,00 | 1,91 | −7,63 | 0,2751 | −0,0424 | |||
| THRY / Thryv Holdings, Inc. | 0,15 | 0,01 | 1,85 | −5,08 | 0,2661 | −0,0327 | |||
| MIRM / Mirum Pharmaceuticals, Inc. | 0,04 | 0,01 | 1,81 | 12,99 | 0,2603 | 0,0147 | |||
| GOOGL / Alphabet Inc. | 0,01 | 0,00 | 1,55 | 13,99 | 0,2226 | 0,0144 | |||
| CRK / Comstock Resources, Inc. | 0,05 | 0,00 | 1,52 | 36,05 | 0,2182 | 0,0472 | |||
| ETN / Eaton Corporation plc | 0,00 | 0,00 | 1,46 | 31,41 | 0,2100 | 0,0395 | |||
| ARQT / Arcutis Biotherapeutics, Inc. | 0,10 | 0,01 | 1,46 | −10,33 | 0,2097 | −0,0397 | |||
| VCYT / Veracyte, Inc. | 0,05 | 0,01 | 1,33 | −8,82 | 0,1917 | −0,0325 | |||
| APLS / Apellis Pharmaceuticals, Inc. | 0,07 | 1,24 | 0,1782 | 0,1782 | |||||
| BRK.B / Berkshire Hathaway Inc. | 0,00 | 0,00 | 1,17 | −8,80 | 0,1685 | −0,0284 | |||
| JNJ / Johnson & Johnson | 0,01 | 0,00 | 0,87 | −7,95 | 0,1250 | −0,0197 | |||
| SCHB / Schwab Strategic Trust - Schwab U.S. Broad Market ETF | 0,04 | 0,00 | 0,87 | 10,59 | 0,1248 | 0,0046 | |||
| AJG / Arthur J. Gallagher & Co. | 0,00 | 0,00 | 0,74 | −7,30 | 0,1059 | −0,0159 | |||
| DOV / Dover Corporation | 0,00 | 0,00 | 0,66 | 4,25 | 0,0953 | −0,0021 | |||
| CSD / Invesco Exchange-Traded Fund Trust - Invesco S&P Spin-Off ETF | 0,01 | 0,00 | 0,62 | 11,71 | 0,0893 | 0,0042 | |||
| COST / Costco Wholesale Corporation | 0,00 | 0,00 | 0,60 | 4,54 | 0,0863 | −0,0016 | |||
| AMZN / Amazon.com, Inc. | 0,00 | 0,00 | 0,54 | 15,24 | 0,0773 | 0,0058 | |||
| EQIX / Equinix, Inc. | 0,00 | −1,53 | 0,46 | −3,97 | 0,0661 | −0,0073 | |||
| SPG / Simon Property Group, Inc. | 0,00 | −1,62 | 0,42 | −4,78 | 0,0602 | −0,0072 | |||
| PEP / PepsiCo, Inc. | 0,00 | 0,00 | 0,41 | −11,80 | 0,0591 | −0,0124 | |||
| AMT / American Tower Corporation | 0,00 | −1,88 | 0,40 | −0,49 | 0,0581 | −0,0040 | |||
| CI / The Cigna Group | 0,00 | 0,00 | 0,40 | 0,50 | 0,0575 | −0,0035 | |||
| GOOG / Alphabet Inc. | 0,00 | 0,00 | 0,39 | 13,70 | 0,0561 | 0,0034 | |||
| UL / Unilever PLC - Depositary Receipt (Common Stock) | 0,01 | 0,00 | 0,37 | 2,80 | 0,0528 | −0,0020 | |||
| SCHH / Schwab Strategic Trust - Schwab U.S. REIT ETF | 0,02 | 0,00 | 0,35 | −1,70 | 0,0499 | −0,0042 | |||
| PLD / Prologis, Inc. | 0,00 | −1,90 | 0,33 | −7,65 | 0,0469 | −0,0073 | |||
| EFA / iShares Trust - iShares MSCI EAFE ETF | 0,00 | 0,00 | 0,31 | 9,41 | 0,0453 | 0,0011 | |||
| EXR / Extra Space Storage Inc. | 0,00 | −1,67 | 0,27 | −2,18 | 0,0387 | −0,0036 | |||
| INVH / Invitation Homes Inc. | 0,01 | −1,53 | 0,26 | −7,12 | 0,0376 | −0,0056 | |||
| AVGO / Broadcom Inc. | 0,00 | 0,25 | 0,0357 | 0,0357 | |||||
| JPM / JPMorgan Chase & Co. | 0,00 | 0,00 | 0,25 | 18,27 | 0,0355 | 0,0035 | |||
| MAA / Mid-America Apartment Communities, Inc. | 0,00 | −1,75 | 0,24 | −13,00 | 0,0347 | −0,0079 | |||
| PANW / Palo Alto Networks, Inc. | 0,00 | 0,24 | 0,0344 | 0,0344 | |||||
| SUI / Sun Communities, Inc. | 0,00 | −1,21 | 0,24 | −2,87 | 0,0341 | −0,0033 | |||
| FRT / Federal Realty Investment Trust | 0,00 | −1,37 | 0,23 | −4,26 | 0,0324 | −0,0037 | |||
| IYR / iShares Trust - iShares U.S. Real Estate ETF | 0,00 | 0,00 | 0,22 | −1,33 | 0,0320 | −0,0025 | |||
| BAC / Bank of America Corporation | 0,00 | 0,22 | 0,0316 | 0,0316 | |||||
| SPY / SPDR S&P 500 ETF | 0,00 | 0,21 | 0,0307 | 0,0307 | |||||
| PBF / PBF Energy Inc. | 0,01 | 0,21 | 0,0299 | 0,0299 | |||||
| WELL / Welltower Inc. | 0,00 | −1,48 | 0,21 | −0,97 | 0,0295 | −0,0023 | |||
| EXEL / Exelixis, Inc. | 0,00 | −100,00 | 0,00 | 0,0000 | |||||
| AXSM / Axsome Therapeutics, Inc. | 0,00 | −100,00 | 0,00 | 0,0000 | |||||
| AGG / iShares Trust - iShares Core U.S. Aggregate Bond ETF | 0,00 | −100,00 | 0,00 | 0,0000 | |||||
| ARE / Alexandria Real Estate Equities, Inc. | 0,00 | −100,00 | 0,00 | 0,0000 | |||||
| PLUS / ePlus inc. | 0,00 | −100,00 | 0,00 | 0,0000 | |||||
| GMRE / Global Medical REIT Inc. | 0,00 | −100,00 | 0,00 | 0,0000 | |||||
| SUPN / Supernus Pharmaceuticals, Inc. | 0,00 | −100,00 | 0,00 | 0,0000 | |||||
| BTSG / BrightSpring Health Services, Inc. | 0,00 | −100,00 | 0,00 | 0,0000 | |||||
| UNH / UnitedHealth Group Incorporated | 0,00 | −100,00 | 0,00 | 0,0000 | |||||
| SEM / Select Medical Holdings Corporation | 0,00 | −100,00 | 0,00 | 0,0000 | |||||
| SKX / Skechers U.S.A., Inc. | 0,00 | −100,00 | 0,00 | 0,0000 | |||||
| CHX / ChampionX Corporation | 0,00 | −100,00 | 0,00 | 0,0000 | |||||
| PSA / Public Storage | 0,00 | −100,00 | 0,00 | 0,0000 | |||||
| SPB / Spectrum Brands Holdings, Inc. | 0,00 | −100,00 | 0,00 | 0,0000 | |||||
| JACK / Jack in the Box Inc. | 0,00 | −100,00 | 0,00 | 0,0000 |