Grundläggande statistik
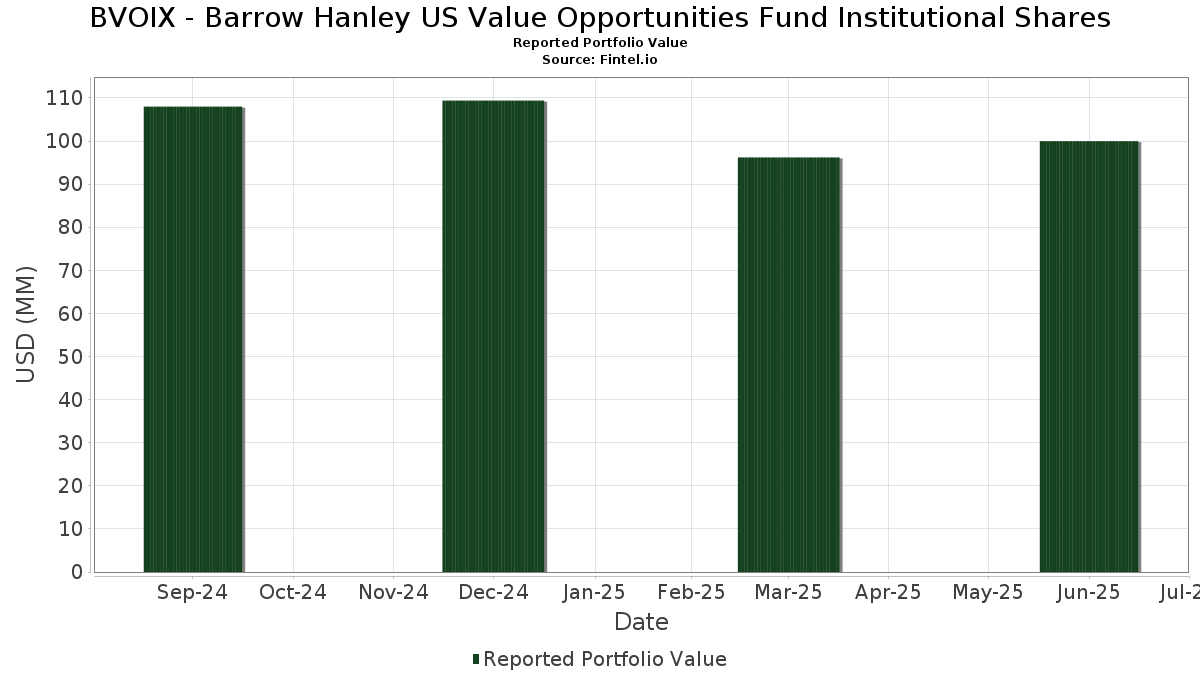
| Portföljvärde | $ 99 971 775 |
| Aktuella positioner | 72 |
Senaste innehav, resultat, förvaltat kapital (från 13F, 13D)
BVOIX - Barrow Hanley US Value Opportunities Fund Institutional Shares har redovisat 72 totala innehav i sina senaste SEC-arkiveringar. Det senaste portföljvärdet beräknas vara $ 99 971 775 USD. Faktiskt förvaltade tillgångar (AUM) är detta värde plus likvida medel (som inte redovisas). BVOIX - Barrow Hanley US Value Opportunities Fund Institutional Sharess största innehav är Carnival Corporation & plc (US:CCL) , Bank of America Corporation (US:BAC) , Johnson Controls International plc (US:JCI) , Wells Fargo & Company (US:WFC) , and CACI International Inc (US:CACI) . BVOIX - Barrow Hanley US Value Opportunities Fund Institutional Sharess nya positioner inkluderar Capital One Financial Corporation (US:COF) , Chevron Corporation (US:CVX) , WESCO International, Inc. (US:WCC) , TopBuild Corp. (US:BLD) , and Ralliant Corporation (US:RAL) .
Största ökningarna detta kvartal
Vi använder förändringen i portföljallokeringen eftersom det är det mest meningsfulla måttet. Förändringar kan bero på transaktioner eller förändringar i aktiekurser.
| Värdepapper | Aktier (MM) |
Värde (MM$) |
Portfölj % av | ΔPortfölj % av |
|---|---|---|---|---|
| 0,01 | 1,84 | 1,8378 | 1,8378 | |
| 0,01 | 1,45 | 1,4461 | 1,4461 | |
| 0,02 | 1,03 | 1,0309 | 1,0309 | |
| 0,01 | 1,02 | 1,0173 | 1,0173 | |
| 0,02 | 1,57 | 1,5734 | 0,8495 | |
| 0,05 | 2,35 | 2,3475 | 0,8249 | |
| 0,00 | 0,80 | 0,7994 | 0,7994 | |
| 0,02 | 1,96 | 1,9543 | 0,7853 | |
| 0,03 | 1,85 | 1,8486 | 0,7005 | |
| 0,02 | 1,33 | 1,3261 | 0,6631 |
Största minskningarna detta kvartal
Vi använder förändringen i portföljallokeringen eftersom det är det mest meningsfulla måttet. Förändringar kan bero på transaktioner eller förändringar i aktiepriser.
| Värdepapper | Aktier (MM) |
Värde (MM$) |
Portfölj % av | ΔPortfölj % av |
|---|---|---|---|---|
| 0,85 | 0,85 | 0,8506 | −1,3380 | |
| 0,00 | 1,33 | 1,3337 | −1,0480 | |
| 0,00 | 0,00 | −0,8280 | ||
| 0,00 | 1,09 | 1,0903 | −0,7901 | |
| 0,08 | 1,04 | 1,0355 | −0,4349 | |
| 0,00 | 0,91 | 0,9075 | −0,4190 | |
| 0,01 | 0,93 | 0,9278 | −0,4052 | |
| 0,02 | 1,95 | 1,9443 | −0,3376 | |
| 0,09 | 1,15 | 1,1526 | −0,3240 | |
| 0,02 | 1,44 | 1,4356 | −0,2961 |
13F- och fond arkiveringar
Denna blankett lämnades in den 2025-08-26 för rapporteringsperioden 2025-06-30. Klicka på länksymbolen för att se hela transaktionshistoriken.
Uppgradera för att låsa upp premiumdata och exportera till Excel![]() .
.
| Värdepapper | Typ | Genomsnittligt aktiepris | Aktier (MM) |
ΔAktier (%) |
ΔAktier (%) |
Värde ($MM) |
Portfölj (%) |
ΔPortfölj (%) |
|
|---|---|---|---|---|---|---|---|---|---|
| CCL / Carnival Corporation & plc | 0,09 | −2,27 | 2,42 | 40,73 | 2,4203 | 0,6321 | |||
| BAC / Bank of America Corporation | 0,05 | 41,35 | 2,35 | 60,34 | 2,3475 | 0,8249 | |||
| JCI / Johnson Controls International plc | 0,02 | −2,27 | 2,07 | 28,82 | 2,0733 | 0,4005 | |||
| WFC / Wells Fargo & Company | 0,03 | −2,27 | 2,03 | 9,09 | 2,0278 | 0,0949 | |||
| CACI / CACI International Inc | 0,00 | −2,26 | 1,96 | 27,01 | 1,9602 | 0,3554 | |||
| VRT / Vertiv Holdings Co | 0,02 | −2,27 | 1,96 | 73,78 | 1,9543 | 0,7853 | |||
| XOM / Exxon Mobil Corporation | 0,02 | −2,27 | 1,95 | −11,43 | 1,9443 | −0,3376 | |||
| ECG / Everus Construction Group, Inc. | 0,03 | −2,27 | 1,85 | 67,33 | 1,8486 | 0,7005 | |||
| COF / Capital One Financial Corporation | 0,01 | 1,84 | 1,8378 | 1,8378 | |||||
| FIS / Fidelity National Information Services, Inc. | 0,02 | −2,27 | 1,77 | 6,57 | 1,7678 | 0,0426 | |||
| SLM / SLM Corporation | 0,05 | −2,27 | 1,76 | 9,13 | 1,7560 | 0,0829 | |||
| ETR / Entergy Corporation | 0,02 | −2,27 | 1,73 | −4,99 | 1,7329 | −0,1632 | |||
| PM / Philip Morris International Inc. | 0,01 | −2,26 | 1,73 | 12,11 | 1,7305 | 0,1262 | |||
| AXP / American Express Company | 0,01 | 26,90 | 1,70 | 50,44 | 1,6964 | 0,5241 | |||
| NICE / NICE Ltd. - Depositary Receipt (Common Stock) | 0,01 | −2,26 | 1,69 | 7,11 | 1,6871 | 0,0492 | |||
| MDT / Medtronic plc | 0,02 | −2,27 | 1,69 | −5,17 | 1,6849 | −0,1628 | |||
| KDP / Keurig Dr Pepper Inc. | 0,05 | −2,27 | 1,68 | −5,61 | 1,6828 | −0,1702 | |||
| ORCL / Oracle Corporation | 0,01 | −18,17 | 1,64 | 27,95 | 1,6388 | 0,3073 | |||
| CNP / CenterPoint Energy, Inc. | 0,04 | −2,27 | 1,63 | −0,85 | 1,6319 | −0,0800 | |||
| ACM / AECOM | 0,01 | 11,30 | 1,61 | 35,52 | 1,6133 | 0,3751 | |||
| XEL / Xcel Energy Inc. | 0,02 | −2,27 | 1,58 | −6,02 | 1,5756 | −0,1668 | |||
| MCHP / Microchip Technology Incorporated | 0,02 | 55,45 | 1,57 | 126,15 | 1,5734 | 0,8495 | |||
| WTW / Willis Towers Watson Public Limited Company | 0,01 | −2,26 | 1,54 | −11,34 | 1,5394 | −0,2660 | |||
| QCOM / QUALCOMM Incorporated | 0,01 | 17,67 | 1,54 | 21,97 | 1,5378 | 0,2273 | |||
| PNW / Pinnacle West Capital Corporation | 0,02 | −2,27 | 1,54 | −8,18 | 1,5360 | −0,2036 | |||
| PLD / Prologis, Inc. | 0,01 | −2,27 | 1,53 | −8,12 | 1,5277 | −0,2006 | |||
| WYNN / Wynn Resorts, Limited | 0,02 | −2,27 | 1,51 | 9,68 | 1,5061 | 0,0778 | |||
| CIEN / Ciena Corporation | 0,02 | −8,00 | 1,50 | 23,79 | 1,5038 | 0,2411 | |||
| MDU / MDU Resources Group, Inc. | 0,09 | −2,27 | 1,49 | −3,69 | 1,4867 | −0,1176 | |||
| APD / Air Products and Chemicals, Inc. | 0,01 | 7,49 | 1,49 | 2,84 | 1,4840 | −0,0167 | |||
| VICI / VICI Properties Inc. | 0,05 | −2,27 | 1,47 | −2,33 | 1,4661 | −0,0945 | |||
| BWXT / BWX Technologies, Inc. | 0,01 | −16,58 | 1,46 | 21,80 | 1,4636 | 0,2145 | |||
| CVX / Chevron Corporation | 0,01 | 1,45 | 1,4461 | 1,4461 | |||||
| MRK / Merck & Co., Inc. | 0,02 | −2,27 | 1,44 | −13,81 | 1,4356 | −0,2961 | |||
| GOOG / Alphabet Inc. | 0,01 | −2,26 | 1,38 | 11,02 | 1,3793 | 0,0871 | |||
| PSX / Phillips 66 | 0,01 | −2,27 | 1,38 | −5,56 | 1,3742 | −0,1389 | |||
| AIG / American International Group, Inc. | 0,02 | −2,27 | 1,37 | −3,80 | 1,3676 | −0,1103 | |||
| WAL / Western Alliance Bancorporation | 0,02 | −2,27 | 1,34 | −0,74 | 1,3421 | −0,0646 | |||
| UNH / UnitedHealth Group Incorporated | 0,00 | −2,26 | 1,33 | −41,80 | 1,3337 | −1,0480 | |||
| ENTG / Entegris, Inc. | 0,02 | 125,55 | 1,33 | 107,99 | 1,3261 | 0,6631 | |||
| CMA / Comerica Incorporated | 0,02 | −2,27 | 1,31 | −1,28 | 1,3068 | −0,0696 | |||
| SNY / Sanofi - Depositary Receipt (Common Stock) | 0,03 | −2,27 | 1,30 | −14,90 | 1,2968 | −0,2869 | |||
| WMG / Warner Music Group Corp. | 0,05 | −2,27 | 1,28 | −15,09 | 1,2766 | −0,2863 | |||
| EA / Electronic Arts Inc. | 0,01 | −2,28 | 1,25 | 7,97 | 1,2467 | 0,0464 | |||
| PSA / Public Storage | 0,00 | −2,26 | 1,24 | −4,24 | 1,2429 | −0,1056 | |||
| ELAN / Elanco Animal Health Incorporated | 0,09 | −2,27 | 1,24 | 32,98 | 1,2377 | 0,2696 | |||
| CB / Chubb Limited | 0,00 | −2,27 | 1,24 | −6,22 | 1,2362 | −0,1345 | |||
| CTSH / Cognizant Technology Solutions Corporation | 0,02 | −2,27 | 1,23 | −0,32 | 1,2276 | −0,0527 | |||
| CRH / CRH plc | 0,01 | −18,18 | 1,23 | −14,62 | 1,2253 | −0,2666 | |||
| APTV / Aptiv PLC | 0,02 | −2,27 | 1,20 | 12,10 | 1,2032 | 0,0868 | |||
| PRKS / United Parks & Resorts Inc. | 0,03 | −2,27 | 1,20 | 1,35 | 1,2027 | −0,0309 | |||
| AXTA / Axalta Coating Systems Ltd. | 0,04 | −2,27 | 1,18 | −12,51 | 1,1817 | −0,2227 | |||
| AVTR / Avantor, Inc. | 0,09 | −2,27 | 1,15 | −18,86 | 1,1526 | −0,3240 | |||
| JEF / Jefferies Financial Group Inc. | 0,02 | −2,27 | 1,14 | −0,26 | 1,1387 | −0,0479 | |||
| ELV / Elevance Health, Inc. | 0,00 | −32,59 | 1,09 | −39,69 | 1,0903 | −0,7901 | |||
| LFUS / Littelfuse, Inc. | 0,00 | 32,20 | 1,09 | 52,38 | 1,0882 | 0,3456 | |||
| SBAC / SBA Communications Corporation | 0,00 | −2,25 | 1,07 | 4,39 | 1,0704 | 0,0038 | |||
| ENB / Enbridge Inc. | 0,02 | −2,27 | 1,05 | −0,09 | 1,0531 | −0,0422 | |||
| PR / Permian Resources Corporation | 0,08 | −25,55 | 1,04 | −26,78 | 1,0355 | −0,4349 | |||
| DD / DuPont de Nemours, Inc. | 0,02 | 1,03 | 1,0309 | 1,0309 | |||||
| LEN / Lennar Corporation | 0,01 | 14,67 | 1,02 | 10,53 | 1,0177 | 0,0602 | |||
| WCC / WESCO International, Inc. | 0,01 | 1,02 | 1,0173 | 1,0173 | |||||
| PAGP / Plains GP Holdings, L.P. - Limited Partnership | 0,05 | −2,27 | 0,99 | −11,11 | 0,9918 | −0,1681 | |||
| MAA / Mid-America Apartment Communities, Inc. | 0,01 | −2,28 | 0,97 | −13,70 | 0,9700 | −0,1984 | |||
| KNF / Knife River Corporation | 0,01 | −20,04 | 0,93 | −27,67 | 0,9278 | −0,4052 | |||
| ALL / The Allstate Corporation | 0,00 | −26,84 | 0,91 | −28,84 | 0,9075 | −0,4190 | |||
| NTPXX / Northern Institutional Funds - Northern Institutional Treasury Portfolio Premier Shares | 0,85 | −59,59 | 0,85 | −59,59 | 0,8506 | −1,3380 | |||
| FTV / Fortive Corporation | 0,02 | 27,03 | 0,83 | −9,47 | 0,8318 | −0,1239 | |||
| BLD / TopBuild Corp. | 0,00 | 0,80 | 0,7994 | 0,7994 | |||||
| HAL / Halliburton Company | 0,04 | −2,27 | 0,80 | −21,50 | 0,7960 | −0,2581 | |||
| JBHT / J.B. Hunt Transport Services, Inc. | 0,01 | −2,29 | 0,75 | −5,20 | 0,7482 | −0,0720 | |||
| RAL / Ralliant Corporation | 0,01 | 0,26 | 0,2579 | 0,2579 | |||||
| DFS / Discover Financial Services | 0,00 | −100,00 | 0,00 | −100,00 | −0,8280 |