Grundläggande statistik
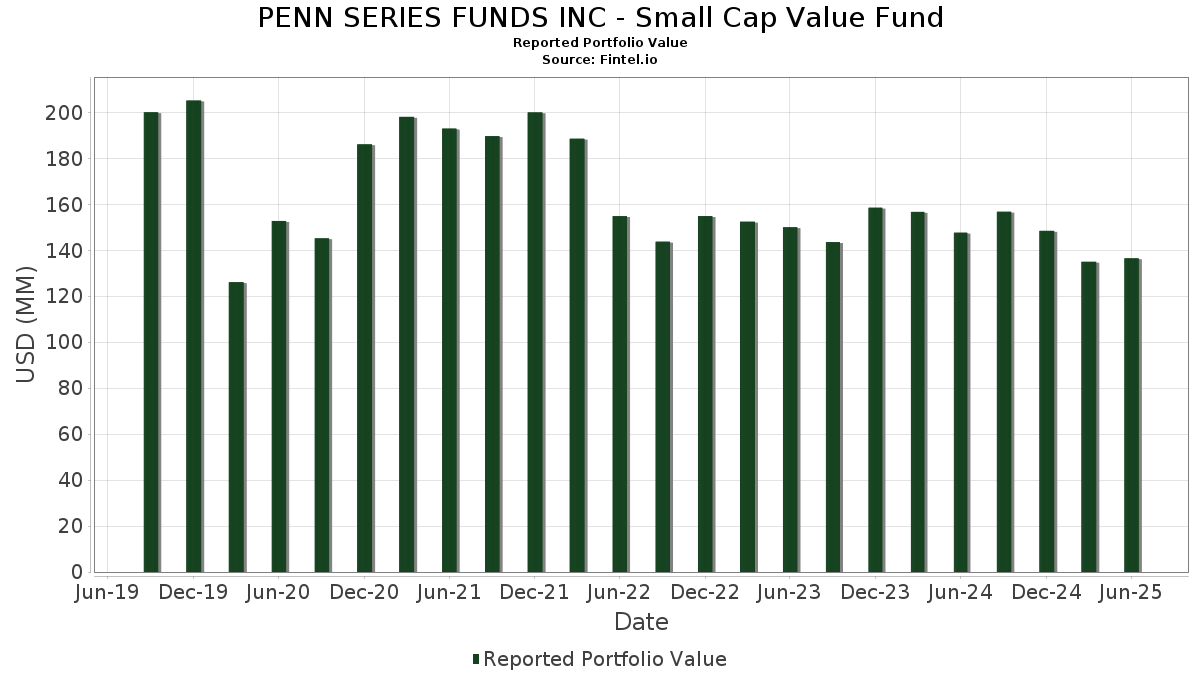
| Portföljvärde | $ 136 485 056 |
| Aktuella positioner | 181 |
Senaste innehav, resultat, förvaltat kapital (från 13F, 13D)
PENN SERIES FUNDS INC - Small Cap Value Fund har redovisat 181 totala innehav i sina senaste SEC-arkiveringar. Det senaste portföljvärdet beräknas vara $ 136 485 056 USD. Faktiskt förvaltade tillgångar (AUM) är detta värde plus likvida medel (som inte redovisas). PENN SERIES FUNDS INC - Small Cap Value Funds största innehav är TXNM Energy, Inc. (US:TXNM) , Ameris Bancorp (US:ABCB) , UMB Financial Corporation (US:UMBF) , Glacier Bancorp, Inc. (US:GBCI) , and Renasant Corporation (US:RNST) . PENN SERIES FUNDS INC - Small Cap Value Funds nya positioner inkluderar Four Corners Property Trust, Inc. (US:FCPT) , Jefferson Capital, Inc. (US:JCAP) , Enova International, Inc. (US:ENVA) , Seacoast Banking Corporation of Florida (US:SBCF) , and Slide Insurance Holdings, Inc. (US:SLDE) .
Största ökningarna detta kvartal
Vi använder förändringen i portföljallokeringen eftersom det är det mest meningsfulla måttet. Förändringar kan bero på transaktioner eller förändringar i aktiekurser.
| Värdepapper | Aktier (MM) |
Värde (MM$) |
Portfölj % av | ΔPortfölj % av |
|---|---|---|---|---|
| 0,05 | 1,67 | 1,2061 | 1,2061 | |
| 0,03 | 0,91 | 0,6576 | 0,6576 | |
| 0,01 | 0,84 | 0,6074 | 0,6074 | |
| 0,04 | 0,77 | 0,5601 | 0,5601 | |
| 0,02 | 1,48 | 1,0691 | 0,5512 | |
| 0,01 | 0,73 | 0,5308 | 0,5308 | |
| 0,03 | 0,73 | 0,5268 | 0,5268 | |
| 0,03 | 0,71 | 0,5157 | 0,5157 | |
| 0,02 | 0,67 | 0,4828 | 0,4828 | |
| 0,01 | 0,63 | 0,4565 | 0,4565 |
Största minskningarna detta kvartal
Vi använder förändringen i portföljallokeringen eftersom det är det mest meningsfulla måttet. Förändringar kan bero på transaktioner eller förändringar i aktiepriser.
| Värdepapper | Aktier (MM) |
Värde (MM$) |
Portfölj % av | ΔPortfölj % av |
|---|---|---|---|---|
| 1,02 | 1,02 | 0,7380 | −0,8057 | |
| 0,02 | 1,42 | 1,0304 | −0,6562 | |
| 0,01 | 1,03 | 0,7476 | −0,6181 | |
| 0,01 | 0,70 | 0,5047 | −0,5172 | |
| 0,00 | 0,59 | 0,4238 | −0,4611 | |
| 0,00 | 0,00 | −0,4583 | ||
| 0,00 | 0,00 | −0,4351 | ||
| 0,00 | 0,44 | 0,3194 | −0,4193 | |
| 0,08 | 1,48 | 1,0695 | −0,3699 | |
| 0,02 | 0,71 | 0,5145 | −0,3580 |
13F- och fond arkiveringar
Denna blankett lämnades in den 2025-08-26 för rapporteringsperioden 2025-06-30. Klicka på länksymbolen för att se hela transaktionshistoriken.
Uppgradera för att låsa upp premiumdata och exportera till Excel![]() .
.
| Värdepapper | Typ | Genomsnittligt aktiepris | Aktier (MM) |
ΔAktier (%) |
ΔAktier (%) |
Värde ($MM) |
Portfölj (%) |
ΔPortfölj (%) |
|
|---|---|---|---|---|---|---|---|---|---|
| TXNM / TXNM Energy, Inc. | 0,04 | −4,66 | 2,34 | 0,43 | 1,6960 | −0,0370 | |||
| ABCB / Ameris Bancorp | 0,03 | −1,49 | 2,12 | 10,69 | 1,5385 | 0,1128 | |||
| UMBF / UMB Financial Corporation | 0,02 | −1,48 | 2,04 | 2,46 | 1,4773 | −0,0018 | |||
| GBCI / Glacier Bancorp, Inc. | 0,04 | 6,66 | 1,77 | 3,93 | 1,2853 | 0,0162 | |||
| RNST / Renasant Corporation | 0,05 | 7,12 | 1,76 | 13,39 | 1,2764 | 0,1219 | |||
| AUB / Atlantic Union Bankshares Corporation | 0,05 | 29,98 | 1,71 | 30,51 | 1,2400 | 0,2656 | |||
| CADE / Cadence Bank | 0,05 | 1,67 | 1,2061 | 1,2061 | |||||
| PFSI / PennyMac Financial Services, Inc. | 0,02 | 16,49 | 1,62 | 15,97 | 1,1730 | 0,1351 | |||
| GTES / Gates Industrial Corporation plc | 0,07 | 5,42 | 1,59 | 31,89 | 1,1510 | 0,2555 | |||
| IRT / Independence Realty Trust, Inc. | 0,08 | −8,52 | 1,48 | −23,76 | 1,0695 | −0,3699 | |||
| TMHC / Taylor Morrison Home Corporation | 0,02 | −27,69 | 1,48 | 44,18 | 1,0691 | 0,5512 | |||
| SPXC / SPX Technologies, Inc. | 0,01 | 40,58 | 1,43 | 83,10 | 1,0360 | 0,4553 | |||
| SSB / SouthState Corporation | 0,02 | −36,78 | 1,42 | −37,33 | 1,0304 | −0,6562 | |||
| TRNO / Terreno Realty Corporation | 0,03 | 21,63 | 1,41 | 7,89 | 1,0203 | 0,0500 | |||
| PWP / Perella Weinberg Partners | 0,07 | 30,50 | 1,38 | 37,78 | 0,9966 | 0,2543 | |||
| IDA / IDACORP, Inc. | 0,01 | 11,45 | 1,34 | 10,73 | 0,9717 | 0,0713 | |||
| GPI / Group 1 Automotive, Inc. | 0,00 | −1,51 | 1,33 | 12,57 | 0,9668 | 0,0859 | |||
| VLY / Valley National Bancorp | 0,15 | 10,54 | 1,32 | 11,05 | 0,9535 | 0,0725 | |||
| KN / Knowles Corporation | 0,07 | 6,02 | 1,30 | 22,94 | 0,9400 | 0,1553 | |||
| MTH / Meritage Homes Corporation | 0,02 | −1,48 | 1,29 | −6,98 | 0,9373 | −0,0958 | |||
| KFY / Korn Ferry | 0,02 | 12,46 | 1,25 | 21,64 | 0,9045 | 0,1412 | |||
| CNOB / ConnectOne Bancorp, Inc. | 0,05 | 39,63 | 1,25 | 33,05 | 0,9042 | 0,2069 | |||
| NMRK / Newmark Group, Inc. | 0,10 | 11,17 | 1,25 | 11,03 | 0,9041 | 0,0684 | |||
| ACA / Arcosa, Inc. | 0,01 | −25,34 | 1,22 | −16,09 | 0,8808 | −0,1957 | |||
| OBK / Origin Bancorp, Inc. | 0,03 | 15,49 | 1,20 | 19,15 | 0,8702 | 0,1203 | |||
| FUL / H.B. Fuller Company | 0,02 | 14,75 | 1,18 | 23,02 | 0,8556 | 0,1419 | |||
| MHO / M/I Homes, Inc. | 0,01 | −1,49 | 1,17 | −3,30 | 0,8489 | −0,0514 | |||
| EPRT / Essential Properties Realty Trust, Inc. | 0,04 | −1,49 | 1,15 | −3,68 | 0,8356 | −0,0545 | |||
| PIPR / Piper Sandler Companies | 0,00 | 20,46 | 1,14 | 35,23 | 0,8261 | 0,1992 | |||
| CBU / Community Financial System, Inc. | 0,02 | −1,49 | 1,13 | −1,48 | 0,8209 | −0,0339 | |||
| FRME / First Merchants Corporation | 0,03 | −1,49 | 1,13 | −6,69 | 0,8187 | −0,0816 | |||
| AZZ / AZZ Inc. | 0,01 | −1,48 | 1,10 | 11,29 | 0,8002 | 0,0627 | |||
| CMC / Commercial Metals Company | 0,02 | −12,75 | 1,09 | −7,26 | 0,7872 | −0,0835 | |||
| SANM / Sanmina Corporation | 0,01 | −1,48 | 1,04 | 26,55 | 0,7527 | 0,1423 | |||
| ESE / ESCO Technologies Inc. | 0,01 | −53,42 | 1,03 | −43,82 | 0,7476 | −0,6181 | |||
| BANC / Banc of California, Inc. | 0,07 | −1,49 | 1,03 | −2,46 | 0,7465 | −0,0387 | |||
| OSBC / Old Second Bancorp, Inc. | 0,06 | 20,77 | 1,03 | 28,75 | 0,7462 | 0,1516 | |||
| TFDXX / Blackrock Liquidity Funds - BlackRock Liquidity Funds FedFund Portfolio Institutional Class | 1,02 | −50,95 | 1,02 | −50,96 | 0,7380 | −0,8057 | |||
| CNO / CNO Financial Group, Inc. | 0,03 | 4,83 | 1,01 | −2,88 | 0,7321 | −0,0414 | |||
| STAG / STAG Industrial, Inc. | 0,03 | −29,30 | 0,99 | −28,98 | 0,7139 | −0,3175 | |||
| FBK / FB Financial Corporation | 0,02 | −1,48 | 0,97 | −3,75 | 0,7061 | −0,0464 | |||
| TEX / Terex Corporation | 0,02 | 34,69 | 0,96 | 66,49 | 0,6984 | 0,2680 | |||
| LADR / Ladder Capital Corp | 0,09 | 11,73 | 0,96 | 5,26 | 0,6969 | 0,0177 | |||
| MOFG / MidWestOne Financial Group, Inc. | 0,03 | 6,90 | 0,94 | 3,86 | 0,6829 | 0,0084 | |||
| MRCY / Mercury Systems, Inc. | 0,02 | 10,81 | 0,93 | 38,51 | 0,6726 | 0,1744 | |||
| FLR / Fluor Corporation | 0,02 | 27,20 | 0,93 | 66,73 | 0,6718 | 0,3192 | |||
| ASGN / ASGN Incorporated | 0,02 | −1,49 | 0,92 | −21,98 | 0,6691 | −0,2104 | |||
| IVT / InvenTrust Properties Corp. | 0,03 | 57,09 | 0,92 | 46,65 | 0,6655 | 0,1996 | |||
| VVV / Valvoline Inc. | 0,02 | −1,49 | 0,91 | 7,18 | 0,6602 | 0,0282 | |||
| FCPT / Four Corners Property Trust, Inc. | 0,03 | 0,91 | 0,6576 | 0,6576 | |||||
| AVNT / Avient Corporation | 0,03 | 10,43 | 0,90 | −3,94 | 0,6537 | −0,0448 | |||
| BV / BrightView Holdings, Inc. | 0,05 | 3,48 | 0,90 | 34,28 | 0,6500 | 0,1530 | |||
| TCBK / TriCo Bancshares | 0,02 | −1,48 | 0,90 | −0,22 | 0,6500 | −0,0182 | |||
| PHIN / PHINIA Inc. | 0,02 | 17,63 | 0,89 | 23,37 | 0,6428 | 0,1081 | |||
| PBH / Prestige Consumer Healthcare Inc. | 0,01 | 20,95 | 0,87 | 12,36 | 0,6328 | 0,0549 | |||
| CNX / CNX Resources Corporation | 0,03 | −1,48 | 0,85 | 5,44 | 0,6183 | 0,0164 | |||
| NE / Noble Corporation plc | 0,03 | 143,73 | 0,85 | 106,07 | 0,6153 | 0,3370 | |||
| PATK / Patrick Industries, Inc. | 0,01 | −18,34 | 0,84 | −10,92 | 0,6088 | −0,0922 | |||
| 2IY / Cushman & Wakefield plc | 0,08 | 48,21 | 0,84 | 60,73 | 0,6079 | 0,2194 | |||
| OGS / ONE Gas, Inc. | 0,01 | 0,84 | 0,6074 | 0,6074 | |||||
| CUZ / Cousins Properties Incorporated | 0,03 | −24,75 | 0,83 | −23,46 | 0,6032 | −0,2047 | |||
| NMIH / NMI Holdings, Inc. | 0,02 | −19,12 | 0,83 | 5,59 | 0,6023 | 0,1004 | |||
| MOGA / Moog, Inc. - Class A | 0,00 | 9,12 | 0,82 | 13,99 | 0,5962 | 0,0592 | |||
| MTDR / Matador Resources Company | 0,02 | −1,48 | 0,82 | −7,97 | 0,5945 | −0,0683 | |||
| MGY / Magnolia Oil & Gas Corporation | 0,04 | 59,48 | 0,81 | 41,83 | 0,5853 | 0,1622 | |||
| CDE / Coeur Mining, Inc. | 0,09 | −32,36 | 0,80 | 1,26 | 0,5804 | −0,0079 | |||
| LZB / La-Z-Boy Incorporated | 0,02 | −1,48 | 0,80 | −6,24 | 0,5775 | −0,0550 | |||
| KGS / Kodiak Gas Services, Inc. | 0,02 | 23,46 | 0,79 | 13,53 | 0,5719 | 0,0546 | |||
| HIW / Highwoods Properties, Inc. | 0,03 | −1,49 | 0,79 | 3,29 | 0,5699 | 0,0041 | |||
| GPOR / Gulfport Energy Corporation | 0,00 | −15,84 | 0,78 | −8,10 | 0,5676 | −0,0658 | |||
| GEF / Greif, Inc. | 0,01 | −1,49 | 0,78 | 16,59 | 0,5651 | 0,0671 | |||
| JCAP / Jefferson Capital, Inc. | 0,04 | 0,77 | 0,5601 | 0,5601 | |||||
| PPBI / Pacific Premier Bancorp, Inc. | 0,04 | −1,49 | 0,76 | −2,56 | 0,5511 | −0,0291 | |||
| ESAB / ESAB Corporation | 0,01 | 27,17 | 0,76 | 31,54 | 0,5502 | 0,1212 | |||
| SXI / Standex International Corporation | 0,00 | −18,97 | 0,76 | −21,43 | 0,5499 | −0,1682 | |||
| ECPG / Encore Capital Group, Inc. | 0,02 | −27,92 | 0,76 | −18,60 | 0,5486 | −0,1429 | |||
| OI / O-I Glass, Inc. | 0,05 | −1,49 | 0,76 | 26,68 | 0,5469 | 0,1037 | |||
| AMTB / Amerant Bancorp Inc. | 0,04 | −1,49 | 0,73 | −13,05 | 0,5316 | −0,0952 | |||
| SKT / Tanger Inc. | 0,02 | −32,02 | 0,73 | −38,54 | 0,5310 | −0,3545 | |||
| ENVA / Enova International, Inc. | 0,01 | 0,73 | 0,5308 | 0,5308 | |||||
| SBCF / Seacoast Banking Corporation of Florida | 0,03 | 0,73 | 0,5268 | 0,5268 | |||||
| CRC / California Resources Corporation | 0,02 | 21,44 | 0,72 | 26,27 | 0,5224 | 0,0975 | |||
| SLDE / Slide Insurance Holdings, Inc. | 0,03 | 0,71 | 0,5157 | 0,5157 | |||||
| MYRG / MYR Group Inc. | 0,00 | −1,51 | 0,71 | 58,13 | 0,5150 | 0,1806 | |||
| TTMI / TTM Technologies, Inc. | 0,02 | −69,60 | 0,71 | −39,47 | 0,5145 | −0,3580 | |||
| CRGY / Crescent Energy Company | 0,08 | 18,07 | 0,71 | −9,72 | 0,5119 | −0,0694 | |||
| SKWD / Skyward Specialty Insurance Group, Inc. | 0,01 | −42,75 | 0,71 | −37,50 | 0,5111 | −0,3277 | |||
| HCI / HCI Group, Inc. | 0,00 | −33,34 | 0,70 | −32,01 | 0,5078 | −0,2586 | |||
| BFH / Bread Financial Holdings, Inc. | 0,01 | 46,15 | 0,70 | 125,81 | 0,5074 | 0,3062 | |||
| KMPR / Kemper Corporation | 0,01 | −47,52 | 0,70 | −49,38 | 0,5047 | −0,5172 | |||
| AEIS / Advanced Energy Industries, Inc. | 0,01 | −21,77 | 0,70 | 8,75 | 0,5045 | 0,0285 | |||
| LIVN / LivaNova PLC | 0,02 | 19,32 | 0,70 | −4,01 | 0,5037 | 0,0425 | |||
| SLGN / Silgan Holdings Inc. | 0,01 | −1,49 | 0,69 | 4,37 | 0,5019 | 0,0087 | |||
| RMBS / Rambus Inc. | 0,01 | 113,81 | 0,68 | 165,10 | 0,4898 | 0,2997 | |||
| AHL / Aspen Insurance Holdings Limited | 0,02 | 0,67 | 0,4828 | 0,4828 | |||||
| OLLI / Ollie's Bargain Outlet Holdings, Inc. | 0,01 | −1,47 | 0,66 | 11,66 | 0,4793 | 0,0386 | |||
| FSS / Federal Signal Corporation | 0,01 | −1,48 | 0,65 | 42,60 | 0,4680 | 0,1312 | |||
| ACLS / Axcelis Technologies, Inc. | 0,01 | 64,88 | 0,64 | 131,88 | 0,4640 | 0,2582 | |||
| BDC / Belden Inc. | 0,01 | 0,63 | 0,4565 | 0,4565 | |||||
| GT / The Goodyear Tire & Rubber Company | 0,06 | −1,49 | 0,63 | 10,62 | 0,4532 | 0,0326 | |||
| MMSI / Merit Medical Systems, Inc. | 0,01 | 29,81 | 0,62 | 14,94 | 0,4514 | 0,0480 | |||
| CPK / Chesapeake Utilities Corporation | 0,01 | −5,91 | 0,62 | −11,84 | 0,4477 | −0,0738 | |||
| SMTC / Semtech Corporation | 0,01 | 12,11 | 0,62 | 47,26 | 0,4475 | 0,1354 | |||
| BL / BlackLine, Inc. | 0,01 | −1,48 | 0,61 | 15,23 | 0,4442 | 0,0486 | |||
| ASO / Academy Sports and Outdoors, Inc. | 0,01 | 40,44 | 0,61 | 18,38 | 0,4433 | 0,0925 | |||
| ITRI / Itron, Inc. | 0,00 | −12,51 | 0,60 | 16,38 | 0,4382 | 0,0860 | |||
| PEB / Pebblebrook Hotel Trust | 0,06 | −1,49 | 0,60 | −2,91 | 0,4360 | −0,0244 | |||
| RWT / Redwood Trust, Inc. | 0,10 | 40,78 | 0,60 | 36,93 | 0,4330 | 0,1089 | |||
| MGEE / MGE Energy, Inc. | 0,01 | 29,32 | 0,60 | 23,14 | 0,4321 | 0,0718 | |||
| DAN / Dana Incorporated | 0,03 | −51,13 | 0,59 | −37,19 | 0,4288 | −0,2710 | |||
| NPB / Northpointe Bancshares, Inc. | 0,04 | −1,49 | 0,59 | −6,54 | 0,4250 | −0,0412 | |||
| THG / The Hanover Insurance Group, Inc. | 0,00 | −49,69 | 0,59 | −50,84 | 0,4238 | −0,4611 | |||
| KNTK / Kinetik Holdings Inc. | 0,01 | 0,58 | 0,4207 | 0,4207 | |||||
| KTB / Kontoor Brands, Inc. | 0,01 | 30,14 | 0,58 | 33,95 | 0,4174 | 0,0975 | |||
| ABL / Abacus Global Management, Inc. | 0,11 | −1,49 | 0,57 | −32,43 | 0,4139 | −0,2142 | |||
| MZTI / The Marzetti Company | 0,00 | −1,50 | 0,57 | −2,74 | 0,4113 | −0,0226 | |||
| QRVO / Qorvo, Inc. | 0,01 | 20,58 | 0,57 | 41,40 | 0,4112 | 0,1128 | |||
| RRR / Red Rock Resorts, Inc. | 0,01 | −1,49 | 0,57 | 18,20 | 0,4097 | 0,0540 | |||
| SAIA / Saia, Inc. | 0,00 | 148,18 | 0,56 | 55,40 | 0,4069 | 0,1777 | |||
| CVLT / Commvault Systems, Inc. | 0,00 | 1,28 | 0,55 | 11,97 | 0,4005 | 0,0333 | |||
| UTZ / Utz Brands, Inc. | 0,04 | −1,49 | 0,55 | −12,10 | 0,3999 | −0,0674 | |||
| CSTM / Constellium SE | 0,04 | −22,37 | 0,54 | 2,28 | 0,3907 | −0,0010 | |||
| ATKR / Atkore Inc. | 0,01 | 0,54 | 0,3907 | 0,3907 | |||||
| PTEN / Patterson-UTI Energy, Inc. | 0,09 | 4,51 | 0,53 | −24,57 | 0,3847 | −0,1388 | |||
| DHT / DHT Holdings, Inc. | 0,05 | −21,88 | 0,53 | −19,66 | 0,3823 | −0,1054 | |||
| CACI / CACI International Inc | 0,00 | 3,67 | 0,53 | 132,30 | 0,3809 | 0,2249 | |||
| KNF / Knife River Corporation | 0,01 | 5,60 | 0,53 | −4,37 | 0,3805 | −0,0280 | |||
| GVA / Granite Construction Incorporated | 0,01 | −24,08 | 0,52 | −5,84 | 0,3743 | −0,0336 | |||
| SLAB / Silicon Laboratories Inc. | 0,00 | −16,60 | 0,52 | −13,01 | 0,3737 | 0,0742 | |||
| TGNA / TEGNA Inc. | 0,03 | −1,49 | 0,50 | −9,45 | 0,3615 | −0,0478 | |||
| MRC / MRC Global Inc. | 0,04 | −15,00 | 0,49 | −8,69 | 0,3579 | −0,0080 | |||
| NEO / NeoGenomics, Inc. | 0,07 | −1,49 | 0,49 | −24,07 | 0,3564 | −0,1255 | |||
| GMED / Globus Medical, Inc. | 0,01 | −5,40 | 0,49 | −23,67 | 0,3529 | −0,1218 | |||
| ALKS / Alkermes plc | 0,02 | 40,38 | 0,48 | 21,46 | 0,3490 | 0,0546 | |||
| URBN / Urban Outfitters, Inc. | 0,01 | 0,48 | 0,3484 | 0,3484 | |||||
| SMA / SmartStop Self Storage REIT, Inc. | 0,01 | 0,47 | 0,3417 | 0,3417 | |||||
| THO / THOR Industries, Inc. | 0,01 | 0,47 | 0,3380 | 0,3380 | |||||
| COHU / Cohu, Inc. | 0,02 | 28,26 | 0,46 | 67,88 | 0,3337 | 0,1296 | |||
| AAP / Advance Auto Parts, Inc. | 0,01 | 0,46 | 0,3331 | 0,3331 | |||||
| UMH / UMH Properties, Inc. | 0,03 | 0,46 | 0,3310 | 0,3310 | |||||
| ESI / Element Solutions Inc | 0,02 | −37,87 | 0,45 | −37,73 | 0,3255 | −0,2110 | |||
| VSEC / VSE Corporation | 0,00 | −59,36 | 0,44 | −55,69 | 0,3194 | −0,4193 | |||
| STNG / Scorpio Tankers Inc. | 0,01 | 36,57 | 0,44 | 42,53 | 0,3181 | 0,0886 | |||
| TENB / Tenable Holdings, Inc. | 0,01 | −1,48 | 0,43 | −4,85 | 0,3134 | −0,0246 | |||
| GRC / The Gorman-Rupp Company | 0,01 | −1,48 | 0,43 | 2,90 | 0,3091 | 0,0014 | |||
| CYTK / Cytokinetics, Incorporated | 0,01 | −1,49 | 0,42 | −19,00 | 0,3058 | −0,0816 | |||
| CROX / Crocs, Inc. | 0,00 | −1,50 | 0,42 | −6,07 | 0,3031 | −0,0279 | |||
| IBP / Installed Building Products, Inc. | 0,00 | 23,60 | 0,42 | 30,22 | 0,3030 | 0,0639 | |||
| CHDN / Churchill Downs Incorporated | 0,00 | 0,42 | 0,3027 | 0,3027 | |||||
| CBZ / CBIZ, Inc. | 0,01 | 45,14 | 0,42 | 161,01 | 0,3008 | 0,1977 | |||
| ADNT / Adient plc | 0,02 | −38,19 | 0,41 | −51,35 | 0,3004 | −0,2768 | |||
| MBC / MasterBrand, Inc. | 0,04 | −19,91 | 0,39 | −32,87 | 0,2826 | −0,1499 | |||
| DGII / Digi International Inc. | 0,01 | −27,30 | 0,39 | −8,92 | 0,2811 | −0,0356 | |||
| SGRY / Surgery Partners, Inc. | 0,02 | −1,49 | 0,38 | −7,77 | 0,2754 | −0,0310 | |||
| DK / Delek US Holdings, Inc. | 0,02 | −41,10 | 0,38 | −17,40 | 0,2723 | −0,0652 | |||
| CDRE / Cadre Holdings, Inc. | 0,01 | −1,48 | 0,37 | 6,09 | 0,2652 | 0,0084 | |||
| LBRT / Liberty Energy Inc. | 0,03 | 4,71 | 0,34 | −42,55 | 0,2490 | −0,1558 | |||
| GO / Grocery Outlet Holding Corp. | 0,03 | 236,19 | 0,34 | 5,94 | 0,2462 | 0,0261 | |||
| ENOV / Enovis Corporation | 0,01 | 61,80 | 0,34 | 33,20 | 0,2442 | 0,0555 | |||
| WD / Walker & Dunlop, Inc. | 0,00 | −42,01 | 0,33 | −64,10 | 0,2367 | −0,3468 | |||
| SDRL / Seadrill Limited | 0,01 | −4,87 | 0,33 | −51,49 | 0,2364 | −0,2196 | |||
| LCII / LCI Industries | 0,00 | 0,32 | 0,2288 | 0,2288 | |||||
| CAKE / The Cheesecake Factory Incorporated | 0,00 | 0,31 | 0,2239 | 0,2239 | |||||
| MDGL / Madrigal Pharmaceuticals, Inc. | 0,00 | 87,48 | 0,31 | 72,07 | 0,2232 | 0,0895 | |||
| RVMD / Revolution Medicines, Inc. | 0,01 | −30,96 | 0,30 | −28,30 | 0,2170 | −0,0929 | |||
| RARE / Ultragenyx Pharmaceutical Inc. | 0,01 | 57,07 | 0,30 | 57,67 | 0,2165 | 0,0757 | |||
| IONS / Ionis Pharmaceuticals, Inc. | 0,01 | 7,13 | 0,28 | 40,31 | 0,1996 | 0,0536 | |||
| RXO / RXO, Inc. | 0,02 | 0,27 | 0,1991 | 0,1991 | |||||
| CGON / CG Oncology, Inc. | 0,01 | 51,92 | 0,24 | 61,49 | 0,1738 | 0,0632 | |||
| ENR / Energizer Holdings, Inc. | 0,01 | 0,24 | 0,1716 | 0,1716 | |||||
| DVAX / Dynavax Technologies Corporation | 0,02 | 95,82 | 0,24 | 72,79 | 0,1705 | 0,0783 | |||
| AMN / AMN Healthcare Services, Inc. | 0,01 | 56,85 | 0,23 | −23,51 | 0,1678 | −0,0268 | |||
| PTGX / Protagonist Therapeutics, Inc. | 0,00 | 0,21 | 0,1535 | 0,1535 | |||||
| SNDX / Syndax Pharmaceuticals, Inc. | 0,02 | 51,30 | 0,21 | 15,47 | 0,1518 | 0,0168 | |||
| VC / Visteon Corporation | 0,00 | −38,87 | 0,21 | −53,36 | 0,1511 | −0,0745 | |||
| IMVT / Immunovant, Inc. | 0,01 | 0,20 | 0,1471 | 0,1471 | |||||
| VSCO / Victoria's Secret & Co. | 0,01 | −1,49 | 0,20 | −1,46 | 0,1465 | −0,0066 | |||
| XENE / Xenon Pharmaceuticals Inc. | 0,01 | 21,58 | 0,20 | 13,48 | 0,1465 | 0,0140 | |||
| BBIO / BridgeBio Pharma, Inc. | 0,00 | 0,20 | 0,1442 | 0,1442 | |||||
| FLS / Flowserve Corporation | 0,00 | −65,30 | 0,20 | −62,93 | 0,1418 | −0,2493 | |||
| ROG / Rogers Corporation | 0,00 | −34,39 | 0,15 | −33,48 | 0,1099 | −0,0596 | |||
| AM / Antero Midstream Corporation | 0,00 | −100,00 | 0,00 | −100,00 | −0,4351 | ||||
| CDNA / CareDx, Inc | 0,00 | −100,00 | 0,00 | −100,00 | −0,2781 | ||||
| CNR / Core Natural Resources, Inc. | 0,00 | −100,00 | 0,00 | −100,00 | −0,2791 | ||||
| KTOS / Kratos Defense & Security Solutions, Inc. | 0,00 | −100,00 | 0,00 | −100,00 | −0,4583 | ||||
| WTTR / Select Water Solutions, Inc. | 0,00 | −100,00 | 0,00 | −100,00 | −0,3065 | ||||
| KRMN / Karman Holdings Inc. | 0,00 | −100,00 | 0,00 | −100,00 | −0,3200 | ||||
| FRSH / Freshworks Inc. | 0,00 | −100,00 | 0,00 | −100,00 | −0,2715 | ||||
| CWH / Camping World Holdings, Inc. | 0,00 | −100,00 | 0,00 | −100,00 | −0,2306 |