Grundläggande statistik
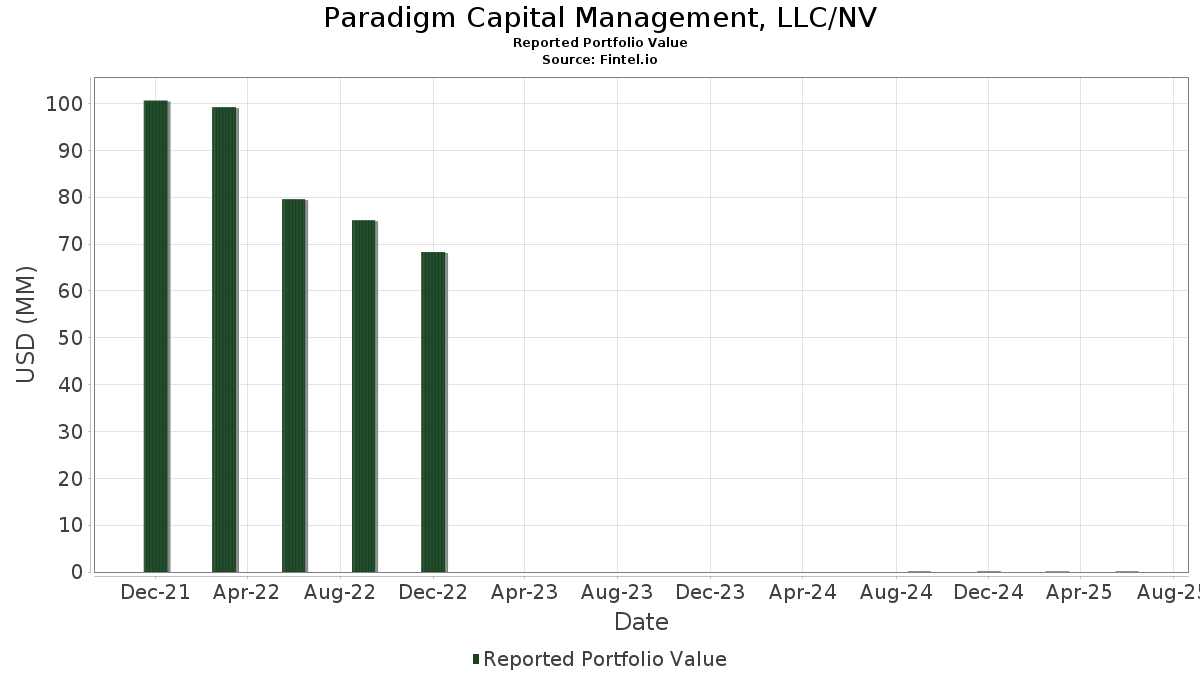
| Portföljvärde | $ 101 172 |
| Aktuella positioner | 60 |
Senaste innehav, resultat, förvaltat kapital (från 13F, 13D)
Paradigm Capital Management, LLC/NV har redovisat 60 totala innehav i sina senaste SEC-arkiveringar. Det senaste portföljvärdet beräknas vara $ 101 172 USD. Faktiskt förvaltade tillgångar (AUM) är detta värde plus likvida medel (som inte redovisas). Paradigm Capital Management, LLC/NVs största innehav är Vanguard Specialized Funds - Vanguard Dividend Appreciation ETF (US:VIG) , J.P. Morgan Exchange-Traded Fund Trust - JPMorgan Ultra-Short Income ETF (US:JPST) , Vanguard Advice Select International Growth Fund (US:VAIGX) , Berkshire Hathaway Inc. (US:BRK.B) , and Schwab Strategic Trust - Schwab U.S. Dividend Equity ETF (US:SCHD) . Paradigm Capital Management, LLC/NVs nya positioner inkluderar Applied Materials, Inc. (US:AMAT) , VICI Properties Inc. (US:VICI) , iShares Trust - iShares Core S&P 500 ETF (US:IVV) , Uber Technologies, Inc. (US:UBER) , and .
Största ökningarna detta kvartal
Vi använder förändringen i portföljallokeringen eftersom det är det mest meningsfulla måttet. Förändringar kan bero på transaktioner eller förändringar i aktiekurser.
| Värdepapper | Aktier (MM) |
Värde (MM$) |
Portfölj % av | ΔPortfölj % av |
|---|---|---|---|---|
| 0,21 | 0,01 | 10,5316 | 1,0500 | |
| 0,01 | 0,00 | 1,0171 | 0,7115 | |
| 0,01 | 0,00 | 2,8031 | 0,6354 | |
| 0,01 | 0,00 | 3,4772 | 0,4060 | |
| 0,00 | 0,00 | 0,3687 | 0,3687 | |
| 0,00 | 0,00 | 0,7383 | 0,3040 | |
| 0,00 | 0,00 | 0,2629 | 0,2629 | |
| 0,01 | 0,00 | 0,2412 | 0,2412 | |
| 0,02 | 0,00 | 0,4586 | 0,2297 | |
| 0,01 | 0,00 | 1,3848 | 0,2155 |
Största minskningarna detta kvartal
Vi använder förändringen i portföljallokeringen eftersom det är det mest meningsfulla måttet. Förändringar kan bero på transaktioner eller förändringar i aktiepriser.
| Värdepapper | Aktier (MM) |
Värde (MM$) |
Portfölj % av | ΔPortfölj % av |
|---|---|---|---|---|
| 0,16 | 0,00 | 4,1879 | −1,5244 | |
| 0,01 | 0,01 | 5,6468 | −0,7993 | |
| 0,04 | 0,00 | 0,9420 | −0,6371 | |
| 0,01 | 0,00 | 3,5524 | −0,6074 | |
| 0,07 | 0,01 | 8,5794 | −0,5077 | |
| 0,06 | 0,01 | 12,9779 | −0,4100 | |
| 0,00 | 0,00 | 1,2810 | −0,3257 | |
| 0,01 | 0,00 | 2,3475 | −0,3017 | |
| 0,01 | 0,00 | 2,0213 | −0,2548 | |
| 0,01 | 0,00 | 1,4500 | −0,2395 |
13F- och fond arkiveringar
Denna blankett lämnades in den 2025-08-14 för rapporteringsperioden 2025-06-30. Klicka på länksymbolen för att se hela transaktionshistoriken.
Uppgradera för att låsa upp premiumdata och exportera till Excel![]() .
.
| Värdepapper | Typ | Genomsnittligt aktiepris | Aktier (MM) |
ΔAktier (%) |
ΔAktier (%) |
Värde ($MM) |
Portfölj (%) |
ΔPortfölj (%) |
|
|---|---|---|---|---|---|---|---|---|---|
| VIG / Vanguard Specialized Funds - Vanguard Dividend Appreciation ETF | 0,06 | −4,99 | 0,01 | 0,00 | 12,9779 | −0,4100 | |||
| JPST / J.P. Morgan Exchange-Traded Fund Trust - JPMorgan Ultra-Short Income ETF | 0,21 | 14,74 | 0,01 | 11,11 | 10,5316 | 1,0500 | |||
| VAIGX / Vanguard Advice Select International Growth Fund | 0,07 | −5,55 | 0,01 | 0,00 | 8,5794 | −0,5077 | |||
| BRK.B / Berkshire Hathaway Inc. | 0,01 | −0,70 | 0,01 | −16,67 | 5,6468 | −0,7993 | |||
| SCHD / Schwab Strategic Trust - Schwab U.S. Dividend Equity ETF | 0,16 | −20,01 | 0,00 | −20,00 | 4,1879 | −1,5244 | |||
| VHCI.X / Vanguard World Fund - Vanguard Health Care ETF | 0,01 | −5,87 | 0,00 | −25,00 | 3,5524 | −0,6074 | |||
| JPM / JPMorgan Chase & Co. | 0,01 | −0,94 | 0,00 | 0,00 | 3,4772 | 0,4060 | |||
| 1VZ / Verizon Communications Inc. | 0,07 | 15,37 | 0,00 | 0,00 | 2,9336 | 0,1771 | |||
| MSFT / Microsoft Corporation | 0,01 | 0,88 | 0,00 | 0,00 | 2,8031 | 0,6354 | |||
| AAPL / Apple Inc. | 0,01 | −0,76 | 0,00 | 0,00 | 2,3475 | −0,3017 | |||
| MRK / Merck & Co., Inc. | 0,03 | 14,60 | 0,00 | 0,00 | 2,2971 | −0,0537 | |||
| GOOGL / Alphabet Inc. | 0,01 | −1,39 | 0,00 | 0,00 | 2,2892 | 0,1756 | |||
| KMI / Kinder Morgan, Inc. | 0,08 | −1,52 | 0,00 | 0,00 | 2,2526 | −0,0419 | |||
| CVX / Chevron Corporation | 0,01 | 7,25 | 0,00 | 0,00 | 2,0213 | −0,2548 | |||
| MO / Altria Group, Inc. | 0,03 | 1,61 | 0,00 | 0,00 | 1,8246 | −0,0754 | |||
| T / AT&T Inc. | 0,06 | 1,97 | 0,00 | 0,00 | 1,7357 | 0,0155 | |||
| BAC / Bank of America Corporation | 0,03 | 2,20 | 0,00 | 0,00 | 1,6289 | 0,1755 | |||
| USB / U.S. Bancorp | 0,03 | 1,32 | 0,00 | 0,00 | 1,5568 | 0,0748 | |||
| XOM / Exxon Mobil Corporation | 0,01 | 1,84 | 0,00 | 0,00 | 1,4510 | −0,1751 | |||
| JNJ / Johnson & Johnson | 0,01 | −3,61 | 0,00 | 0,00 | 1,4500 | −0,2395 | |||
| AMGN / Amgen Inc. | 0,01 | 36,73 | 0,00 | 0,00 | 1,3848 | 0,2155 | |||
| SCHG / Schwab Strategic Trust - Schwab U.S. Large-Cap Growth ETF | 0,05 | 2,79 | 0,00 | 0,00 | 1,3383 | 0,1844 | |||
| WFC.PRL / Wells Fargo & Company - Preferred Stock | 0,00 | −15,66 | 0,00 | 0,00 | 1,2810 | −0,3257 | |||
| PM / Philip Morris International Inc. | 0,01 | −1,06 | 0,00 | 0,00 | 1,2632 | 0,1124 | |||
| V / Visa Inc. | 0,00 | −1,01 | 0,00 | 0,00 | 1,2078 | −0,0380 | |||
| GSCE / GS Connect S&P GSCI Enhanced Commodity Total Return ETN | 0,00 | −1,56 | 0,00 | 1,1011 | 0,2088 | ||||
| MET / MetLife, Inc. | 0,01 | −1,09 | 0,00 | 0,00 | 1,0714 | −0,0467 | |||
| TFC / Truist Financial Corporation | 0,02 | −7,15 | 0,00 | 0,00 | 1,0349 | −0,0679 | |||
| OKE / ONEOK, Inc. | 0,01 | 317,63 | 0,00 | 1,0171 | 0,7115 | ||||
| PFE / Pfizer Inc. | 0,04 | −35,56 | 0,00 | −100,00 | 0,9420 | −0,6371 | |||
| MCD / McDonald's Corporation | 0,00 | 0,00 | 0,00 | 0,8738 | −0,0921 | ||||
| SPY / SPDR S&P 500 ETF | 0,00 | −0,87 | 0,00 | 0,8372 | 0,0471 | ||||
| DUK / Duke Energy Corporation | 0,01 | 0,00 | 0,00 | 0,7967 | −0,0547 | ||||
| AIG / American International Group, Inc. | 0,01 | 0,00 | 0,00 | 0,7611 | −0,0392 | ||||
| META / Meta Platforms, Inc. | 0,00 | 0,00 | 0,00 | 0,7403 | 0,1424 | ||||
| QQQ / Invesco QQQ Trust, Series 1 | 0,00 | 49,28 | 0,00 | 0,7383 | 0,3040 | ||||
| COST / Costco Wholesale Corporation | 0,00 | 0,16 | 0,00 | 0,6118 | 0,0078 | ||||
| VTI / Vanguard Index Funds - Vanguard Total Stock Market ETF | 0,00 | −2,38 | 0,00 | 0,5555 | 0,0240 | ||||
| VTS / Vitesse Energy, Inc. | 0,02 | 12,22 | 0,00 | 0,4586 | −0,0115 | ||||
| HPQ / HP Inc. | 0,02 | 133,95 | 0,00 | 0,4586 | 0,2297 | ||||
| AMZN / Amazon.com, Inc. | 0,00 | 0,00 | 0,00 | 0,4497 | 0,0460 | ||||
| CB / Chubb Limited | 0,00 | 3,40 | 0,00 | 0,4349 | −0,0189 | ||||
| HD / The Home Depot, Inc. | 0,00 | 0,09 | 0,00 | 0,4132 | −0,0141 | ||||
| PEP / PepsiCo, Inc. | 0,00 | 3,16 | 0,00 | 0,3835 | −0,0529 | ||||
| CSCO / Cisco Systems, Inc. | 0,01 | 10,03 | 0,00 | 0,3776 | 0,0618 | ||||
| LLY / Eli Lilly and Company | 0,00 | 0,00 | 0,00 | 0,3697 | −0,0351 | ||||
| AMAT / Applied Materials, Inc. | 0,00 | 0,00 | 0,3687 | 0,3687 | |||||
| NVS / Novartis AG - Depositary Receipt (Common Stock) | 0,00 | 2,78 | 0,00 | 0,3321 | 0,0245 | ||||
| SCHW / The Charles Schwab Corporation | 0,00 | −4,77 | 0,00 | 0,3242 | 0,0217 | ||||
| WFC / Wells Fargo & Company | 0,00 | 0,00 | 0,00 | 0,3104 | 0,0232 | ||||
| TROW / T. Rowe Price Group, Inc. | 0,00 | 42,81 | 0,00 | 0,3054 | 0,0949 | ||||
| TSLA / Tesla, Inc. | 0,00 | 0,00 | 0,2629 | 0,2629 | |||||
| UTX / RTX Corporation | 0,00 | 5,97 | 0,00 | 0,2560 | 0,0291 | ||||
| CEF / Sprott Physical Gold and Silver Trust | 0,01 | 0,00 | 0,00 | 0,2422 | 0,0061 | ||||
| VICI / VICI Properties Inc. | 0,01 | 0,00 | 0,2412 | 0,2412 | |||||
| IVV / iShares Trust - iShares Core S&P 500 ETF | 0,00 | 0,00 | 0,2115 | 0,2115 | |||||
| UBER / Uber Technologies, Inc. | 0,00 | 0,00 | 0,2046 | 0,2046 | |||||
| VXUS / Vanguard STAR Funds - Vanguard Total International Stock ETF | 0,00 | 0,00 | 0,2046 | 0,2046 | |||||
| F / Ford Motor Company | 0,02 | 3,07 | 0,00 | 0,1908 | 0,0139 | ||||
| BLE / BlackRock Municipal Income Trust II | 0,01 | 0,00 | 0,00 | 0,0988 | −0,0075 | ||||
| FNDX / Schwab Strategic Trust - Schwab Fundamental U.S. Large Company ETF | 0,00 | −100,00 | 0,00 | 0,0000 |