Grundläggande statistik
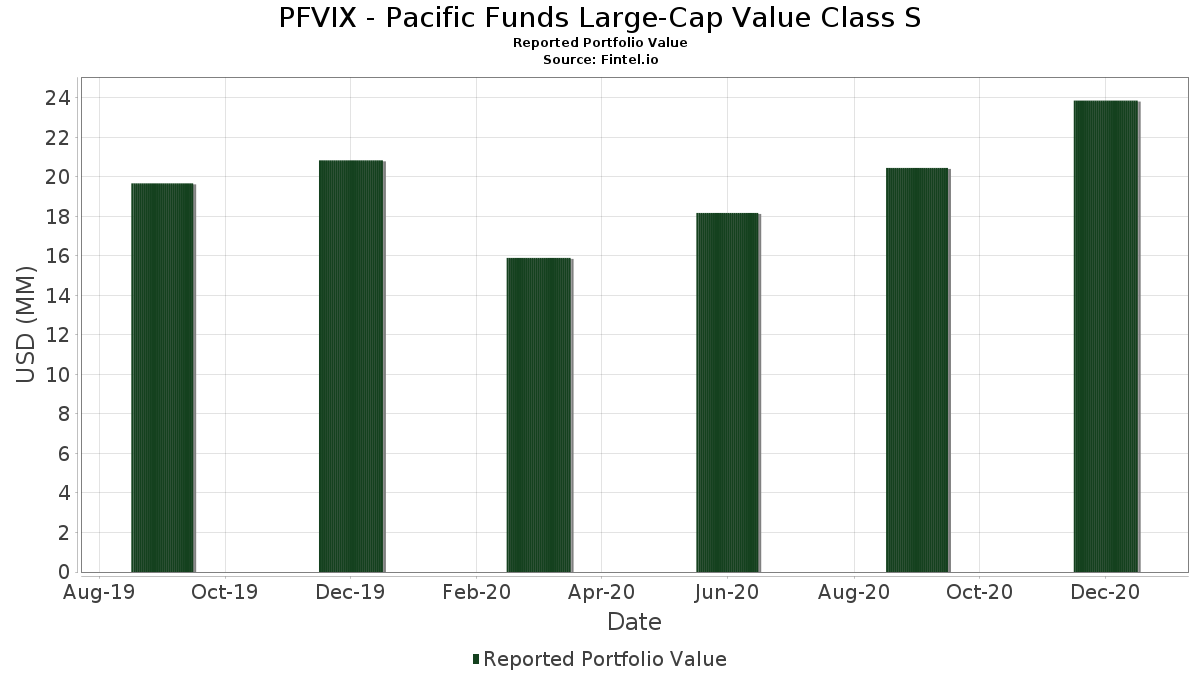
| Portföljvärde | $ 23 857 598 |
| Aktuella positioner | 74 |
Senaste innehav, resultat, förvaltat kapital (från 13F, 13D)
PFVIX - Pacific Funds Large-Cap Value Class S har redovisat 74 totala innehav i sina senaste SEC-arkiveringar. Det senaste portföljvärdet beräknas vara $ 23 857 598 USD. Faktiskt förvaltade tillgångar (AUM) är detta värde plus likvida medel (som inte redovisas). PFVIX - Pacific Funds Large-Cap Value Class Ss största innehav är JPMorgan Chase & Co. (US:JPM) , Bank of America Corporation (US:BAC) , Comcast Corporation (US:CMCSA) , Medtronic plc (US:MDT) , and Johnson & Johnson (US:JNJ) . PFVIX - Pacific Funds Large-Cap Value Class Ss nya positioner inkluderar Global Payments Inc. (US:GPN) , General Motors Company (US:GM) , AutoZone, Inc. (US:AZO) , American Tower Corporation (US:AMT) , and .
Största ökningarna detta kvartal
Vi använder förändringen i portföljallokeringen eftersom det är det mest meningsfulla måttet. Förändringar kan bero på transaktioner eller förändringar i aktiekurser.
| Värdepapper | Aktier (MM) |
Värde (MM$) |
Portfölj % av | ΔPortfölj % av |
|---|---|---|---|---|
| 0,00 | 0,35 | 1,4695 | 1,4695 | |
| 0,01 | 0,30 | 1,2399 | 1,2399 | |
| 0,00 | 0,21 | 0,8721 | 0,8721 | |
| 0,00 | 0,20 | 0,8491 | 0,8491 | |
| 0,01 | 0,29 | 1,2282 | 0,5223 | |
| 0,01 | 0,33 | 1,3705 | 0,5071 | |
| 0,01 | 0,94 | 3,9304 | 0,5059 | |
| 0,00 | 0,37 | 1,5525 | 0,3463 | |
| 0,00 | 0,32 | 1,3251 | 0,3275 | |
| 0,02 | 0,75 | 3,1398 | 0,3076 |
Största minskningarna detta kvartal
Vi använder förändringen i portföljallokeringen eftersom det är det mest meningsfulla måttet. Förändringar kan bero på transaktioner eller förändringar i aktiepriser.
| Värdepapper | Aktier (MM) |
Värde (MM$) |
Portfölj % av | ΔPortfölj % av |
|---|---|---|---|---|
| 0,00 | 0,00 | −1,7054 | ||
| 0,00 | 0,00 | −1,1676 | ||
| 0,00 | 0,00 | −0,9784 | ||
| 0,01 | 0,51 | 2,1509 | −0,9140 | |
| 0,00 | 0,00 | −0,6316 | ||
| 0,00 | 0,00 | −0,6098 | ||
| 0,00 | 0,34 | 1,4184 | −0,3366 | |
| 0,01 | 0,36 | 1,5151 | −0,2648 | |
| 0,00 | 0,57 | 2,3800 | −0,2545 | |
| 0,00 | 0,29 | 1,2214 | −0,2515 |
13F- och fond arkiveringar
Denna blankett lämnades in den 2021-02-24 för rapporteringsperioden 2020-12-31. Klicka på länksymbolen för att se hela transaktionshistoriken.
Uppgradera för att låsa upp premiumdata och exportera till Excel![]() .
.
| Värdepapper | Typ | Genomsnittligt aktiepris | Aktier (MM) |
ΔAktier (%) |
ΔAktier (%) |
Värde ($MM) |
Portfölj (%) |
ΔPortfölj (%) |
|
|---|---|---|---|---|---|---|---|---|---|
| JPM / JPMorgan Chase & Co. | 0,01 | 1,47 | 0,94 | 33,90 | 3,9304 | 0,5059 | |||
| BAC / Bank of America Corporation | 0,02 | 2,82 | 0,75 | 29,48 | 3,1398 | 0,3076 | |||
| CMCSA / Comcast Corporation | 0,01 | 2,82 | 0,58 | 16,43 | 2,4292 | −0,0047 | |||
| MDT / Medtronic plc | 0,00 | 2,82 | 0,57 | 15,79 | 2,3938 | −0,0163 | |||
| JNJ / Johnson & Johnson | 0,00 | −0,28 | 0,57 | 5,37 | 2,3800 | −0,2545 | |||
| GOOGL / Alphabet Inc. | 0,00 | 2,56 | 0,56 | 22,71 | 2,3516 | 0,1141 | |||
| VZ / Verizon Communications Inc. | 0,01 | −17,08 | 0,51 | −18,15 | 2,1509 | −0,9140 | |||
| TMO / Thermo Fisher Scientific Inc. | 0,00 | 2,78 | 0,45 | 8,47 | 1,8729 | −0,1428 | |||
| TGT / Target Corporation | 0,00 | 2,85 | 0,43 | 15,47 | 1,8115 | −0,0213 | |||
| PH / Parker-Hannifin Corporation | 0,00 | 0,06 | 0,43 | 34,58 | 1,8093 | 0,2421 | |||
| C.WSA / Citigroup, Inc. | 0,00 | −2,51 | 0,42 | 24,63 | 1,7583 | 0,1146 | |||
| US09248U7182 / BlackRock Liquidity Funds: T-Fund, Institutional Shares | 0,41 | 12,15 | 0,41 | 12,09 | 1,7067 | −0,0690 | |||
| MDLZ / Mondelez International, Inc. | 0,01 | 1,25 | 0,38 | 3,23 | 1,6010 | −0,2119 | |||
| STT / State Street Corporation | 0,01 | 2,81 | 0,38 | 26,25 | 1,5898 | 0,1189 | |||
| HON / Honeywell International Inc. | 0,00 | 0,28 | 0,38 | 29,66 | 1,5727 | 0,1565 | |||
| DUK / Duke Energy Corporation | 0,00 | 19,36 | 0,37 | 23,26 | 1,5526 | 0,0845 | |||
| DIS / The Walt Disney Company | 0,00 | 2,86 | 0,37 | 50,20 | 1,5525 | 0,3463 | |||
| XEL / Xcel Energy Inc. | 0,01 | 2,82 | 0,36 | −0,55 | 1,5151 | −0,2648 | |||
| PLD / Prologis, Inc. | 0,00 | 2,83 | 0,36 | 1,99 | 1,5009 | −0,2188 | |||
| CVX / Chevron Corporation | 0,00 | 0,19 | 0,36 | 17,82 | 1,4928 | 0,0105 | |||
| BMY / Bristol-Myers Squibb Company | 0,01 | 18,33 | 0,35 | 21,72 | 1,4781 | 0,0613 | |||
| GPN / Global Payments Inc. | 0,00 | 0,35 | 1,4695 | 1,4695 | |||||
| APD / Air Products and Chemicals, Inc. | 0,00 | 2,81 | 0,34 | −5,57 | 1,4184 | −0,3366 | |||
| PEP / PepsiCo, Inc. | 0,00 | 5,34 | 0,34 | 12,62 | 1,4183 | −0,0500 | |||
| PWR / Quanta Services, Inc. | 0,00 | −16,06 | 0,34 | 14,19 | 1,4160 | −0,0288 | |||
| ICE / Intercontinental Exchange, Inc. | 0,00 | −2,55 | 0,34 | 12,29 | 1,4153 | −0,0555 | |||
| TFC / Truist Financial Corporation | 0,01 | 2,83 | 0,34 | 29,73 | 1,4070 | 0,1394 | |||
| DTE / DTE Energy Company | 0,00 | 2,83 | 0,33 | 8,44 | 1,4001 | −0,1053 | |||
| WTW / Willis Towers Watson Public Limited Company | 0,00 | 0,70 | 0,33 | 1,52 | 1,3940 | −0,2071 | |||
| SCHW / The Charles Schwab Corporation | 0,01 | 26,52 | 0,33 | 84,75 | 1,3705 | 0,5071 | |||
| PRU / Prudential Financial, Inc. | 0,00 | 2,84 | 0,33 | 26,25 | 1,3689 | 0,1052 | |||
| KSU / Kansas City Southern | 0,00 | 3,00 | 0,32 | 16,25 | 1,3464 | −0,0048 | |||
| ABBV / AbbVie Inc. | 0,00 | −0,92 | 0,32 | 21,51 | 1,3463 | 0,0501 | |||
| CAT / Caterpillar Inc. | 0,00 | 2,85 | 0,32 | 25,39 | 1,3436 | 0,0945 | |||
| DISCA / Discovery Inc - Class A | 0,01 | 2,83 | 0,32 | 42,41 | 1,3356 | 0,2390 | |||
| UNH / UnitedHealth Group Incorporated | 0,00 | 37,80 | 0,32 | 55,39 | 1,3251 | 0,3275 | |||
| MU / Micron Technology, Inc. | 0,00 | −6,74 | 0,32 | 50,00 | 1,3167 | 0,2876 | |||
| ON / ON Semiconductor Corporation | 0,01 | 1,06 | 0,30 | 52,55 | 1,2518 | 0,2939 | |||
| GM / General Motors Company | 0,01 | 0,30 | 1,2399 | 1,2399 | |||||
| COP / ConocoPhillips | 0,01 | 66,73 | 0,29 | 103,47 | 1,2282 | 0,5223 | |||
| MRK / Merck & Co., Inc. | 0,00 | 2,86 | 0,29 | 1,38 | 1,2281 | −0,1847 | |||
| MLM / Martin Marietta Materials, Inc. | 0,00 | −19,80 | 0,29 | −2,99 | 1,2214 | −0,2515 | |||
| HIG / The Hartford Insurance Group, Inc. | 0,01 | 2,82 | 0,28 | 36,71 | 1,1866 | 0,1732 | |||
| ALL / The Allstate Corporation | 0,00 | 2,81 | 0,28 | 20,09 | 1,1767 | 0,0330 | |||
| LOW / Lowe's Companies, Inc. | 0,00 | −0,41 | 0,27 | −3,53 | 1,1419 | −0,2406 | |||
| COR / Cencora, Inc. | 0,00 | 2,81 | 0,27 | 3,44 | 1,1364 | −0,1423 | |||
| NOC / Northrop Grumman Corporation | 0,00 | 36,84 | 0,27 | 32,51 | 1,1259 | 0,1319 | |||
| BRK.B / Berkshire Hathaway Inc. | 0,00 | −0,52 | 0,27 | 8,57 | 1,1126 | −0,0859 | |||
| AVGO / Broadcom Inc. | 0,00 | 5,24 | 0,26 | 26,92 | 1,1036 | 0,0854 | |||
| CSCO / Cisco Systems, Inc. | 0,01 | −3,60 | 0,26 | 9,40 | 1,0712 | −0,0702 | |||
| CI / The Cigna Group | 0,00 | 2,82 | 0,25 | 26,26 | 1,0468 | 0,0800 | |||
| MSFT / Microsoft Corporation | 0,00 | 5,18 | 0,25 | 11,21 | 1,0384 | −0,0510 | |||
| AEP / American Electric Power Company, Inc. | 0,00 | −3,96 | 0,25 | −1,99 | 1,0292 | −0,1982 | |||
| TXT / Textron Inc. | 0,01 | −2,74 | 0,25 | 30,32 | 1,0250 | 0,1067 | |||
| DRI / Darden Restaurants, Inc. | 0,00 | 2,87 | 0,24 | 21,50 | 1,0187 | 0,0414 | |||
| TT / Trane Technologies plc | 0,00 | 0,74 | 0,24 | 20,92 | 0,9920 | 0,0322 | |||
| LLY / Eli Lilly and Company | 0,00 | 2,82 | 0,23 | 17,59 | 0,9781 | 0,0049 | |||
| HUN / Huntsman Corporation | 0,01 | 2,84 | 0,22 | 16,67 | 0,9365 | −0,0023 | |||
| HRC / Hill-Rom Holdings Inc | 0,00 | 2,84 | 0,22 | 20,54 | 0,9357 | 0,0307 | |||
| PG / The Procter & Gamble Company | 0,00 | 2,85 | 0,22 | 3,27 | 0,9247 | −0,1233 | |||
| PHM / PulteGroup, Inc. | 0,01 | 2,83 | 0,22 | −3,95 | 0,9167 | −0,2000 | |||
| AZO / AutoZone, Inc. | 0,00 | 0,21 | 0,8721 | 0,8721 | |||||
| EOG / EOG Resources, Inc. | 0,00 | 2,83 | 0,21 | 43,06 | 0,8634 | 0,1573 | |||
| OC / Owens Corning | 0,00 | 2,86 | 0,20 | 13,33 | 0,8528 | −0,0259 | |||
| AMT / American Tower Corporation | 0,00 | 0,20 | 0,8491 | 0,8491 | |||||
| BXP / Boston Properties, Inc. | 0,00 | 2,79 | 0,20 | 21,08 | 0,8440 | 0,0301 | |||
| LMT / Lockheed Martin Corporation | 0,00 | 2,71 | 0,20 | −4,74 | 0,8428 | −0,1910 | |||
| TRV / The Travelers Companies, Inc. | 0,00 | −0,57 | 0,19 | 29,33 | 0,8126 | 0,0775 | |||
| AXP / American Express Company | 0,00 | 2,81 | 0,19 | 24,00 | 0,7778 | 0,0458 | |||
| WRK / WestRock Company | 0,00 | 2,84 | 0,17 | 29,32 | 0,7192 | 0,0679 | |||
| INTC / Intel Corporation | 0,00 | −3,59 | 0,17 | −7,22 | 0,6999 | −0,1805 | |||
| AAPL / Apple Inc. | 0,00 | 9,50 | 0,16 | 25,38 | 0,6838 | 0,0478 | |||
| PSX / Phillips 66 | 0,00 | 2,85 | 0,16 | 38,60 | 0,6645 | 0,1057 | |||
| ELS / Equity LifeStyle Properties, Inc. | 0,00 | 13,87 | 0,12 | 18,18 | 0,4913 | 0,0042 | |||
| BBY / Best Buy Co., Inc. | 0,00 | −100,00 | 0,00 | −100,00 | −1,1676 | ||||
| ORCL / Oracle Corporation | 0,00 | −100,00 | 0,00 | −100,00 | −0,9784 | ||||
| T / AT&T Inc. | 0,00 | −100,00 | 0,00 | −100,00 | −0,6098 | ||||
| US20605P1012 / Concho Resources, Inc. | 0,00 | −100,00 | 0,00 | −100,00 | −0,6316 | ||||
| KMB / Kimberly-Clark Corporation | 0,00 | −100,00 | 0,00 | −100,00 | −1,7054 |