Grundläggande statistik
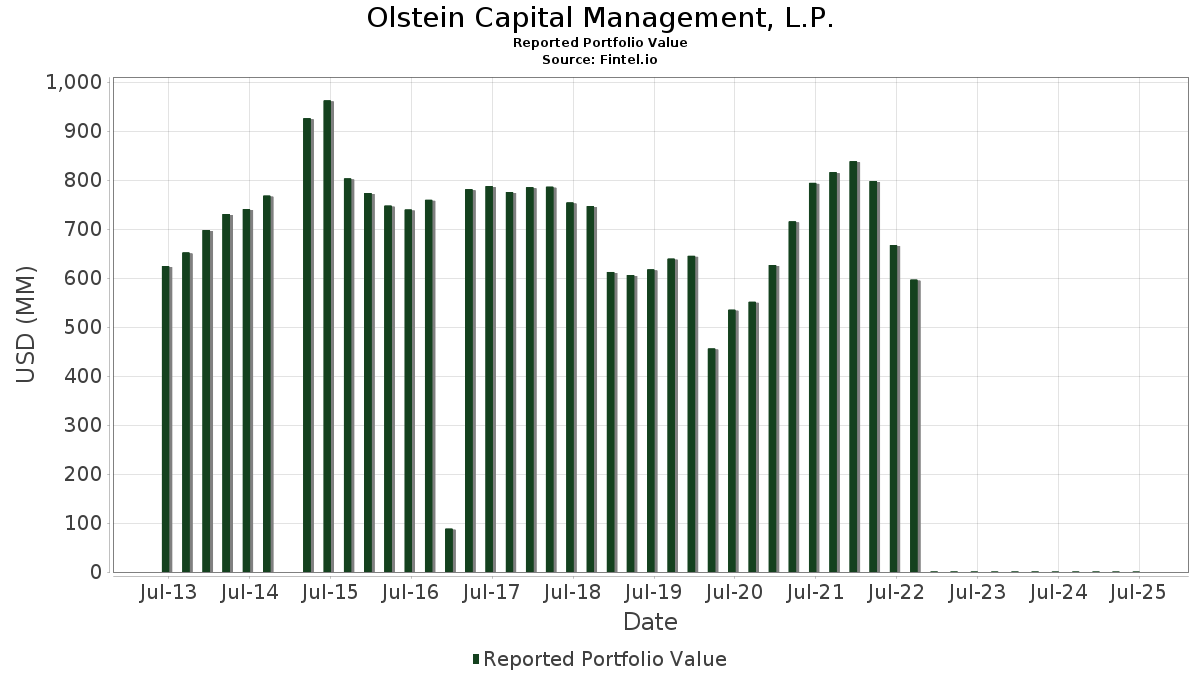
| Portföljvärde | $ 533 442 |
| Aktuella positioner | 101 |
Senaste innehav, resultat, förvaltat kapital (från 13F, 13D)
Olstein Capital Management, L.P. har redovisat 101 totala innehav i sina senaste SEC-arkiveringar. Det senaste portföljvärdet beräknas vara $ 533 442 USD. Faktiskt förvaltade tillgångar (AUM) är detta värde plus likvida medel (som inte redovisas). Olstein Capital Management, L.P.s största innehav är The Walt Disney Company (US:DIS) , Sensata Technologies Holding plc (US:ST) , Vontier Corporation (US:VNT) , ABM Industries Incorporated (US:ABM) , and Johnson & Johnson (US:JNJ) . Olstein Capital Management, L.P.s nya positioner inkluderar Adobe Inc. (US:ADBE) , Ralliant Corporation (US:RAL) , NOV Inc. (US:NOV) , .
Största ökningarna detta kvartal
Vi använder förändringen i portföljallokeringen eftersom det är det mest meningsfulla måttet. Förändringar kan bero på transaktioner eller förändringar i aktiekurser.
| Värdepapper | Aktier (MM) |
Värde (MM$) |
Portfölj % av | ΔPortfölj % av |
|---|---|---|---|---|
| 0,01 | 0,00 | 0,7253 | 0,7253 | |
| 0,01 | 0,00 | 0,6081 | 0,6081 | |
| 0,02 | 0,00 | 0,9232 | 0,4229 | |
| 0,05 | 0,01 | 1,5936 | 0,4215 | |
| 0,03 | 0,01 | 1,3426 | 0,3226 | |
| 0,10 | 0,01 | 1,3450 | 0,2816 | |
| 0,29 | 0,01 | 2,0407 | 0,2750 | |
| 0,03 | 0,01 | 1,0314 | 0,2706 | |
| 0,03 | 0,00 | 0,2469 | 0,2469 | |
| 0,03 | 0,01 | 1,0181 | 0,2457 |
Största minskningarna detta kvartal
Vi använder förändringen i portföljallokeringen eftersom det är det mest meningsfulla måttet. Förändringar kan bero på transaktioner eller förändringar i aktiepriser.
| Värdepapper | Aktier (MM) |
Värde (MM$) |
Portfölj % av | ΔPortfölj % av |
|---|---|---|---|---|
| 0,23 | 0,01 | 1,5749 | −0,4690 | |
| 0,27 | 0,01 | 1,5269 | −0,4329 | |
| 0,06 | 0,01 | 1,1163 | −0,4022 | |
| 0,09 | 0,01 | 1,3134 | −0,4012 | |
| 0,04 | 0,00 | 0,8458 | −0,3846 | |
| 0,08 | 0,01 | 0,9956 | −0,3764 | |
| 0,26 | 0,01 | 1,1675 | −0,3574 | |
| 0,25 | 0,01 | 1,6030 | −0,3362 | |
| 0,08 | 0,01 | 1,3336 | −0,3331 | |
| 0,15 | 0,00 | 0,8944 | −0,2924 |
13F- och fond arkiveringar
Denna blankett lämnades in den 2025-07-22 för rapporteringsperioden 2025-06-30. Klicka på länksymbolen för att se hela transaktionshistoriken.
Uppgradera för att låsa upp premiumdata och exportera till Excel![]() .
.
| Värdepapper | Typ | Genomsnittligt aktiepris | Aktier (MM) |
ΔAktier (%) |
ΔAktier (%) |
Värde ($MM) |
Portfölj (%) |
ΔPortfölj (%) |
|
|---|---|---|---|---|---|---|---|---|---|
| DIS / The Walt Disney Company | 0,11 | −19,71 | 0,01 | 0,00 | 2,6037 | 0,0690 | |||
| ST / Sensata Technologies Holding plc | 0,37 | −17,71 | 0,01 | 10,00 | 2,0715 | 0,0789 | |||
| VNT / Vontier Corporation | 0,29 | 1,03 | 0,01 | 11,11 | 2,0407 | 0,2750 | |||
| ABM / ABM Industries Incorporated | 0,21 | 8,15 | 0,01 | 11,11 | 1,8759 | 0,1671 | |||
| JNJ / Johnson & Johnson | 0,06 | 0,00 | 0,01 | −10,00 | 1,7468 | −0,1154 | |||
| AVTR / Avantor, Inc. | 0,68 | 19,54 | 0,01 | 0,00 | 1,7132 | 0,0183 | |||
| GD / General Dynamics Corporation | 0,03 | −6,06 | 0,01 | 12,50 | 1,6948 | 0,0390 | |||
| APTV / Aptiv PLC | 0,13 | −5,84 | 0,01 | 0,00 | 1,6497 | 0,1490 | |||
| BDX / Becton, Dickinson and Company | 0,05 | 18,60 | 0,01 | −11,11 | 1,6469 | −0,1664 | |||
| SLB / Schlumberger Limited | 0,25 | 0,40 | 0,01 | −20,00 | 1,6030 | −0,3362 | |||
| WCC / WESCO International, Inc. | 0,05 | 11,95 | 0,01 | 33,33 | 1,5936 | 0,4215 | |||
| CFG / Citizens Financial Group, Inc. | 0,19 | 2,10 | 0,01 | 14,29 | 1,5872 | 0,1897 | |||
| LKQ / LKQ Corporation | 0,23 | −13,03 | 0,01 | −27,27 | 1,5749 | −0,4690 | |||
| BAX / Baxter International Inc. | 0,27 | −13,50 | 0,01 | −20,00 | 1,5269 | −0,4329 | |||
| NDAQ / Nasdaq, Inc. | 0,09 | −1,09 | 0,01 | 33,33 | 1,5254 | 0,2407 | |||
| DAL / Delta Air Lines, Inc. | 0,16 | −6,82 | 0,01 | 14,29 | 1,5121 | 0,0994 | |||
| OMC / Omnicom Group Inc. | 0,11 | 11,11 | 0,01 | −12,50 | 1,4834 | −0,0276 | |||
| UNH / UnitedHealth Group Incorporated | 0,03 | 78,57 | 0,01 | 0,00 | 1,4620 | 0,1121 | |||
| TGT / Target Corporation | 0,08 | 5,33 | 0,01 | 0,00 | 1,4609 | 0,0201 | |||
| IFF / International Flavors & Fragrances Inc. | 0,10 | 0,00 | 0,01 | −12,50 | 1,4478 | −0,0523 | |||
| USB / U.S. Bancorp | 0,17 | 0,60 | 0,01 | 0,00 | 1,4335 | 0,1278 | |||
| HOLX / Hologic, Inc. | 0,12 | 0,00 | 0,01 | 0,00 | 1,4047 | 0,0969 | |||
| MHK / Mohawk Industries, Inc. | 0,07 | 0,00 | 0,01 | −12,50 | 1,3872 | −0,0963 | |||
| MDT / Medtronic plc | 0,08 | 0,00 | 0,01 | 0,00 | 1,3726 | −0,0169 | |||
| FDX / FedEx Corporation | 0,03 | 3,23 | 0,01 | 0,00 | 1,3636 | −0,0275 | |||
| DGX / Quest Diagnostics Incorporated | 0,04 | −13,04 | 0,01 | 0,00 | 1,3469 | −0,0858 | |||
| NKE / NIKE, Inc. | 0,10 | 10,99 | 0,01 | 40,00 | 1,3450 | 0,2816 | |||
| FIS / Fidelity National Information Services, Inc. | 0,09 | −24,79 | 0,01 | −12,50 | 1,3430 | −0,2656 | |||
| JLL / Jones Lang LaSalle Incorporated | 0,03 | 25,28 | 0,01 | 40,00 | 1,3426 | 0,3226 | |||
| ZBH / Zimmer Biomet Holdings, Inc. | 0,08 | −2,50 | 0,01 | −22,22 | 1,3336 | −0,3331 | |||
| HSIC / Henry Schein, Inc. | 0,10 | −3,02 | 0,01 | 16,67 | 1,3194 | 0,0668 | |||
| CTVA / Corteva, Inc. | 0,09 | −36,49 | 0,01 | −22,22 | 1,3134 | −0,4012 | |||
| REYN / Reynolds Consumer Products Inc. | 0,32 | 5,63 | 0,01 | −14,29 | 1,2929 | −0,0461 | |||
| CSCO / Cisco Systems, Inc. | 0,10 | −7,55 | 0,01 | 0,00 | 1,2746 | 0,0705 | |||
| CBRE / CBRE Group, Inc. | 0,05 | 4,87 | 0,01 | 20,00 | 1,2395 | 0,1562 | |||
| WFC / Wells Fargo & Company | 0,08 | −4,34 | 0,01 | 0,00 | 1,2316 | 0,0988 | |||
| KLIC / Kulicke and Soffa Industries, Inc. | 0,19 | −22,63 | 0,01 | −14,29 | 1,2065 | −0,2529 | |||
| TRV / The Travelers Companies, Inc. | 0,02 | −20,00 | 0,01 | −14,29 | 1,2037 | −0,2568 | |||
| LHX / L3Harris Technologies, Inc. | 0,03 | −31,51 | 0,01 | −14,29 | 1,1756 | −0,2308 | |||
| DIN / Dine Brands Global, Inc. | 0,26 | −28,09 | 0,01 | −25,00 | 1,1675 | −0,3574 | |||
| FITB / Fifth Third Bancorp | 0,15 | 5,67 | 0,01 | 20,00 | 1,1488 | 0,1313 | |||
| MIDD / The Middleby Corporation | 0,04 | 10,29 | 0,01 | 20,00 | 1,1463 | 0,0693 | |||
| GM / General Motors Company | 0,12 | −13,89 | 0,01 | 0,00 | 1,1439 | −0,1027 | |||
| IVZ / Invesco Ltd. | 0,38 | 0,29 | 0,01 | 20,00 | 1,1266 | 0,0654 | |||
| CMCSA / Comcast Corporation | 0,17 | 0,00 | 0,01 | −16,67 | 1,1173 | −0,0171 | |||
| UPS / United Parcel Service, Inc. | 0,06 | −21,33 | 0,01 | −37,50 | 1,1163 | −0,4022 | |||
| SWK / Stanley Black & Decker, Inc. | 0,09 | 2,38 | 0,01 | −16,67 | 1,0923 | −0,0965 | |||
| SYY / Sysco Corporation | 0,07 | 0,00 | 0,01 | 0,00 | 1,0650 | 0,0289 | |||
| EMN / Eastman Chemical Company | 0,07 | 4,23 | 0,01 | −16,67 | 1,0357 | −0,1159 | |||
| ON / ON Semiconductor Corporation | 0,10 | −31,82 | 0,01 | −16,67 | 1,0316 | −0,1219 | |||
| TXN / Texas Instruments Incorporated | 0,03 | 15,22 | 0,01 | 25,00 | 1,0314 | 0,2706 | |||
| XPRO / Expro Group Holdings N.V. | 0,03 | 65,79 | 0,01 | 25,00 | 1,0181 | 0,2457 | |||
| DOV / Dover Corporation | 0,03 | 11,25 | 0,01 | 25,00 | 1,0132 | 0,1556 | |||
| SSNC / SS&C Technologies Holdings, Inc. | 0,07 | 2,72 | 0,01 | 0,00 | 1,0089 | 0,0358 | |||
| AAPL / Apple Inc. | 0,03 | 13,04 | 0,01 | 0,00 | 0,9999 | 0,0594 | |||
| CVS / CVS Health Corporation | 0,08 | −30,00 | 0,01 | −28,57 | 0,9956 | −0,3764 | |||
| GLW / Corning Incorporated | 0,10 | −7,48 | 0,01 | 25,00 | 0,9759 | 0,0743 | |||
| WTW / Willis Towers Watson Public Limited Company | 0,02 | −5,71 | 0,01 | 0,00 | 0,9480 | −0,1407 | |||
| HON / Honeywell International Inc. | 0,02 | 10,26 | 0,01 | 25,00 | 0,9386 | 0,1785 | |||
| MSFT / Microsoft Corporation | 0,01 | 0,00 | 0,00 | 33,33 | 0,9324 | 0,2414 | |||
| GSCE / GS Connect S&P GSCI Enhanced Commodity Total Return ETN | 0,01 | −12,50 | 0,00 | 0,00 | 0,9287 | 0,1242 | |||
| CB / Chubb Limited | 0,02 | 88,89 | 0,00 | 100,00 | 0,9232 | 0,4229 | |||
| GOOG / Alphabet Inc. | 0,03 | −12,70 | 0,00 | 0,00 | 0,9144 | 0,0086 | |||
| LUV / Southwest Airlines Co. | 0,15 | −23,40 | 0,00 | −33,33 | 0,8944 | −0,2924 | |||
| KFY / Korn Ferry | 0,07 | −8,45 | 0,00 | 0,00 | 0,8934 | 0,0069 | |||
| KMB / Kimberly-Clark Corporation | 0,04 | −25,53 | 0,00 | −33,33 | 0,8458 | −0,3846 | |||
| CMI / Cummins Inc. | 0,01 | 12,50 | 0,00 | 33,33 | 0,8288 | 0,1364 | |||
| FTV / Fortive Corporation | 0,08 | 2,52 | 0,00 | −20,00 | 0,7965 | −0,2745 | |||
| EFX / Equifax Inc. | 0,01 | 0,00 | 0,00 | 0,00 | 0,7294 | 0,0570 | |||
| ADBE / Adobe Inc. | 0,01 | 0,00 | 0,7253 | 0,7253 | |||||
| RTX / RTX Corporation | 0,03 | −19,73 | 0,00 | −25,00 | 0,7118 | −0,0781 | |||
| PEP / PepsiCo, Inc. | 0,03 | 33,33 | 0,00 | 0,00 | 0,6930 | 0,1134 | |||
| BRK.B / Berkshire Hathaway Inc. | 0,01 | −13,14 | 0,00 | −25,00 | 0,6921 | −0,1657 | |||
| DE / Deere & Company | 0,01 | −33,33 | 0,00 | −25,00 | 0,6672 | −0,2400 | |||
| META / Meta Platforms, Inc. | 0,00 | 12,50 | 0,00 | 50,00 | 0,6226 | 0,1982 | |||
| TMO / Thermo Fisher Scientific Inc. | 0,01 | 0,00 | 0,6081 | 0,6081 | |||||
| SPGI / S&P Global Inc. | 0,01 | 0,00 | 0,00 | 0,00 | 0,5337 | 0,0286 | |||
| EBAY / eBay Inc. | 0,04 | −5,00 | 0,00 | 0,00 | 0,5303 | 0,0316 | |||
| SHYF / The Shyft Group, Inc. | 0,19 | −14,53 | 0,00 | 100,00 | 0,4537 | 0,1173 | |||
| BLBD / Blue Bird Corporation | 0,05 | −21,54 | 0,00 | 0,00 | 0,4126 | 0,0253 | |||
| GTES / Gates Industrial Corporation plc | 0,10 | −16,67 | 0,00 | 0,00 | 0,4102 | 0,0238 | |||
| V / Visa Inc. | 0,01 | −14,29 | 0,00 | 0,00 | 0,3993 | −0,0523 | |||
| VSH / Vishay Intertechnology, Inc. | 0,11 | 0,00 | 0,00 | 0,00 | 0,3335 | 0,0056 | |||
| CENTA / Central Garden & Pet Company | 0,06 | −8,33 | 0,00 | 0,00 | 0,3226 | −0,0389 | |||
| IART / Integra LifeSciences Holdings Corporation | 0,14 | 37,76 | 0,00 | −50,00 | 0,3104 | −0,0863 | |||
| CWK / Cushman & Wakefield plc | 0,14 | 0,71 | 0,00 | 0,00 | 0,2926 | 0,0292 | |||
| RAL / Ralliant Corporation | 0,03 | 0,00 | 0,2469 | 0,2469 | |||||
| PLOW / Douglas Dynamics, Inc. | 0,04 | −26,67 | 0,00 | 0,00 | 0,2431 | −0,0135 | |||
| FHB / First Hawaiian, Inc. | 0,05 | −3,92 | 0,00 | 0,00 | 0,2293 | −0,0001 | |||
| HOMB / Home Bancshares, Inc. (Conway, AR) | 0,04 | −15,00 | 0,00 | 0,00 | 0,2268 | −0,0335 | |||
| AGCO / AGCO Corporation | 0,01 | −20,17 | 0,00 | 0,00 | 0,1929 | −0,0201 | |||
| TKR / The Timken Company | 0,01 | 3,85 | 0,00 | 0,1835 | 0,0116 | ||||
| FA / First Advantage Corporation | 0,06 | −7,94 | 0,00 | 0,1805 | 0,0171 | ||||
| PBH / Prestige Consumer Healthcare Inc. | 0,01 | −20,00 | 0,00 | −100,00 | 0,1796 | −0,0579 | |||
| MLR / Miller Industries, Inc. | 0,02 | 0,00 | 0,00 | 0,1792 | 0,0115 | ||||
| PB / Prosperity Bancshares, Inc. | 0,01 | 0,00 | 0,00 | 0,1712 | 0,0003 | ||||
| TNC / Tennant Company | 0,01 | 3,10 | 0,00 | 0,1693 | 0,0034 | ||||
| BRC / Brady Corporation | 0,01 | −13,33 | 0,00 | −100,00 | 0,1657 | −0,0294 | |||
| GHM / Graham Corporation | 0,02 | −18,43 | 0,00 | 0,1578 | 0,0472 | ||||
| PGNY / Progyny, Inc. | 0,02 | 14,29 | 0,00 | 0,0990 | 0,0126 | ||||
| NOV / NOV Inc. | 0,04 | 0,00 | 0,0979 | 0,0979 | |||||
| DENN / Denny's Corporation | 0,00 | −100,00 | 0,00 | 0,0000 |