Grundläggande statistik
| Portföljvärde | $ 186 700 432 |
| Aktuella positioner | 175 |
Senaste innehav, resultat, förvaltat kapital (från 13F, 13D)
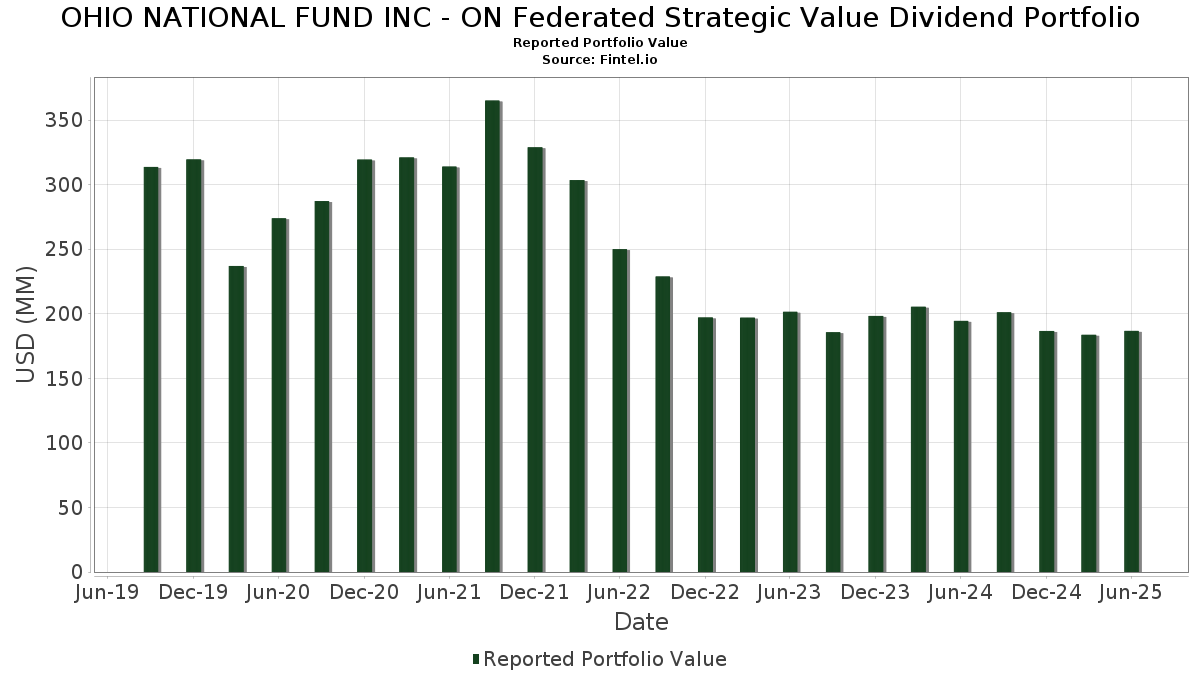
OHIO NATIONAL FUND INC - ON Federated Strategic Value Dividend Portfolio har redovisat 175 totala innehav i sina senaste SEC-arkiveringar. Det senaste portföljvärdet beräknas vara $ 186 700 432 USD. Faktiskt förvaltade tillgångar (AUM) är detta värde plus likvida medel (som inte redovisas). OHIO NATIONAL FUND INC - ON Federated Strategic Value Dividend Portfolios största innehav är JPMorgan Chase & Co. (US:JPM) , Berkshire Hathaway Inc. (US:BRK.B) , Walmart Inc. (US:WMT) , Bank of America Corporation (US:BAC) , and Amazon.com, Inc. (US:AMZN) . OHIO NATIONAL FUND INC - ON Federated Strategic Value Dividend Portfolios nya positioner inkluderar Corning Incorporated (US:GLW) , Elastic N.V. (US:ESTC) , Blackstone Inc. (US:BX) , T-Mobile US, Inc. (US:TMUS) , and AutoZone, Inc. (US:AZO) .
Största ökningarna detta kvartal
Vi använder förändringen i portföljallokeringen eftersom det är det mest meningsfulla måttet. Förändringar kan bero på transaktioner eller förändringar i aktiekurser.
| Värdepapper | Aktier (MM) |
Värde (MM$) |
Portfölj % av | ΔPortfölj % av |
|---|---|---|---|---|
| 0,02 | 3,62 | 1,9124 | 1,9124 | |
| 0,02 | 3,16 | 1,6662 | 1,0745 | |
| 0,01 | 2,00 | 1,0540 | 1,0540 | |
| 0,02 | 2,00 | 1,0551 | 0,8607 | |
| 0,03 | 1,47 | 0,7743 | 0,7743 | |
| 0,00 | 1,82 | 0,9625 | 0,7733 | |
| 0,00 | 1,85 | 0,9762 | 0,7124 | |
| 0,01 | 2,01 | 1,0587 | 0,6892 | |
| 0,00 | 1,78 | 0,9377 | 0,5691 | |
| 0,00 | 1,24 | 0,6542 | 0,5525 |
Största minskningarna detta kvartal
Vi använder förändringen i portföljallokeringen eftersom det är det mest meningsfulla måttet. Förändringar kan bero på transaktioner eller förändringar i aktiepriser.
| Värdepapper | Aktier (MM) |
Värde (MM$) |
Portfölj % av | ΔPortfölj % av |
|---|---|---|---|---|
| 0,00 | 0,32 | 0,1668 | −1,2354 | |
| 0,00 | 0,28 | 0,1499 | −0,8466 | |
| 0,00 | 0,49 | 0,2593 | −0,7639 | |
| 0,01 | 1,31 | 0,6903 | −0,7391 | |
| 0,01 | 0,92 | 0,4839 | −0,6181 | |
| 0,00 | 0,41 | 0,2153 | −0,5781 | |
| 0,00 | 0,00 | −0,4720 | ||
| 0,01 | 1,92 | 1,0134 | −0,4713 | |
| 0,00 | 1,34 | 0,7086 | −0,3961 | |
| 0,00 | 1,70 | 0,8976 | −0,3321 |
13F- och fond arkiveringar
Denna blankett lämnades in den 2025-08-27 för rapporteringsperioden 2025-06-30. Klicka på länksymbolen för att se hela transaktionshistoriken.
Uppgradera för att låsa upp premiumdata och exportera till Excel![]() .
.
| Värdepapper | Typ | Genomsnittligt aktiepris | Aktier (MM) |
ΔAktier (%) |
ΔAktier (%) |
Värde ($MM) |
Portfölj (%) |
ΔPortfölj (%) |
|
|---|---|---|---|---|---|---|---|---|---|
| JPM / JPMorgan Chase & Co. | 0,02 | 0,00 | 5,98 | 18,20 | 3,1560 | 0,4407 | |||
| BRK.B / Berkshire Hathaway Inc. | 0,01 | 0,00 | 4,67 | −8,79 | 2,4632 | −0,2828 | |||
| WMT / Walmart Inc. | 0,05 | −4,96 | 4,58 | 5,85 | 2,4144 | 0,0951 | |||
| BAC / Bank of America Corporation | 0,08 | 0,00 | 3,78 | 13,40 | 1,9917 | 0,2057 | |||
| AMZN / Amazon.com, Inc. | 0,02 | 3,62 | 1,9124 | 1,9124 | |||||
| GOOGL / Alphabet Inc. | 0,02 | 151,24 | 3,16 | 186,31 | 1,6662 | 1,0745 | |||
| MS / Morgan Stanley | 0,02 | 16,16 | 2,81 | 40,28 | 1,4849 | 0,4083 | |||
| MDT / Medtronic plc | 0,03 | 2,02 | 2,79 | −1,03 | 1,4710 | −0,0403 | |||
| PFE / Pfizer Inc. | 0,11 | 31,96 | 2,74 | 26,23 | 1,4448 | 0,2810 | |||
| PM / Philip Morris International Inc. | 0,01 | 0,00 | 2,47 | 14,70 | 1,3010 | 0,1481 | |||
| C / Citigroup Inc. | 0,03 | −2,17 | 2,35 | 17,28 | 1,2393 | 0,1650 | |||
| XOM / Exxon Mobil Corporation | 0,02 | 0,00 | 2,32 | −9,37 | 1,2253 | −0,1493 | |||
| SPG / Simon Property Group, Inc. | 0,01 | 0,00 | 2,22 | −3,22 | 1,1721 | −0,0592 | |||
| PNC / The PNC Financial Services Group, Inc. | 0,01 | −13,90 | 2,15 | −8,67 | 1,1340 | −0,1288 | |||
| PH / Parker-Hannifin Corporation | 0,00 | 0,00 | 2,13 | 14,94 | 1,1243 | 0,1294 | |||
| CTAS / Cintas Corporation | 0,01 | −9,53 | 2,12 | −1,90 | 1,1200 | −0,0408 | |||
| CMCSA / Comcast Corporation | 0,06 | 0,00 | 2,12 | −3,29 | 1,1171 | −0,0573 | |||
| SPGI / S&P Global Inc. | 0,00 | 0,00 | 2,07 | 3,75 | 1,0947 | 0,0221 | |||
| ALL / The Allstate Corporation | 0,01 | 0,00 | 2,04 | −2,77 | 1,0758 | −0,0494 | |||
| SCHW / The Charles Schwab Corporation | 0,02 | 58,09 | 2,03 | 84,24 | 1,0733 | 0,4810 | |||
| CAH / Cardinal Health, Inc. | 0,01 | 138,93 | 2,01 | 191,57 | 1,0587 | 0,6892 | |||
| ETR / Entergy Corporation | 0,02 | 467,72 | 2,00 | 452,21 | 1,0551 | 0,8607 | |||
| GOOG / Alphabet Inc. | 0,01 | 51,94 | 2,00 | 159,35 | 1,0540 | 1,0540 | |||
| ICE / Intercontinental Exchange, Inc. | 0,01 | 0,00 | 1,97 | 6,37 | 1,0395 | 0,0457 | |||
| UNH / UnitedHealth Group Incorporated | 0,01 | 16,52 | 1,92 | −30,61 | 1,0134 | −0,4713 | |||
| TRV / The Travelers Companies, Inc. | 0,01 | 24,65 | 1,91 | 26,07 | 1,0080 | 0,1952 | |||
| CL / Colgate-Palmolive Company | 0,02 | 0,00 | 1,91 | −3,00 | 1,0055 | −0,0484 | |||
| ACN / Accenture plc | 0,01 | 0,00 | 1,90 | −4,20 | 1,0001 | −0,0616 | |||
| HD / The Home Depot, Inc. | 0,01 | 0,00 | 1,87 | 0,05 | 0,9846 | −0,0162 | |||
| OGE / OGE Energy Corp. | 0,04 | −6,37 | 1,86 | −9,61 | 0,9834 | −0,1226 | |||
| UNM / Unum Group | 0,02 | −1,88 | 1,86 | −2,72 | 0,9803 | −0,0444 | |||
| EQIX / Equinix, Inc. | 0,00 | 285,74 | 1,85 | 276,78 | 0,9762 | 0,7124 | |||
| REGN / Regeneron Pharmaceuticals, Inc. | 0,00 | 525,00 | 1,82 | 418,18 | 0,9625 | 0,7733 | |||
| META / Meta Platforms, Inc. | 0,00 | 102,01 | 1,78 | 158,66 | 0,9377 | 0,5691 | |||
| JNJ / Johnson & Johnson | 0,01 | 0,00 | 1,71 | −7,90 | 0,9039 | −0,0940 | |||
| ETN / Eaton Corporation plc | 0,00 | −43,48 | 1,70 | −25,79 | 0,8976 | −0,3321 | |||
| TMO / Thermo Fisher Scientific Inc. | 0,00 | 0,00 | 1,63 | −18,49 | 0,8606 | −0,2133 | |||
| DVN / Devon Energy Corporation | 0,05 | 69,00 | 1,62 | 43,69 | 0,8541 | 0,2499 | |||
| COP / ConocoPhillips | 0,02 | 0,00 | 1,58 | −14,58 | 0,8351 | −0,1586 | |||
| LMT / Lockheed Martin Corporation | 0,00 | 0,00 | 1,58 | 3,62 | 0,8320 | 0,0160 | |||
| QCOM / QUALCOMM Incorporated | 0,01 | −12,55 | 1,54 | −9,33 | 0,8101 | −0,0985 | |||
| MSI / Motorola Solutions, Inc. | 0,00 | 0,00 | 1,53 | −3,97 | 0,8050 | −0,0473 | |||
| T / AT&T Inc. | 0,05 | 0,00 | 1,52 | 2,29 | 0,8025 | 0,0051 | |||
| DIS / The Walt Disney Company | 0,01 | 110,20 | 1,48 | 200,00 | 0,7791 | 0,5330 | |||
| BMY / Bristol-Myers Squibb Company | 0,03 | 1,47 | 0,7743 | 0,7743 | |||||
| BKNG / Booking Holdings Inc. | 0,00 | −48,10 | 1,34 | −34,77 | 0,7086 | −0,3961 | |||
| CVX / Chevron Corporation | 0,01 | −42,63 | 1,31 | −50,90 | 0,6903 | −0,7391 | |||
| TT / Trane Technologies plc | 0,00 | −29,09 | 1,31 | −7,96 | 0,6898 | −0,0721 | |||
| CRM / Salesforce, Inc. | 0,00 | 2,90 | 1,30 | 6,67 | 0,6832 | 0,0794 | |||
| ECL / Ecolab Inc. | 0,00 | 0,00 | 1,28 | 6,31 | 0,6759 | 0,0292 | |||
| CME / CME Group Inc. | 0,00 | −31,81 | 1,27 | −29,14 | 0,6724 | −0,2927 | |||
| IVZ / Invesco Ltd. | 0,08 | −13,57 | 1,26 | −10,12 | 0,6654 | −0,0877 | |||
| ABBV / AbbVie Inc. | 0,01 | 66,64 | 1,25 | 47,70 | 0,6604 | 0,2056 | |||
| RL / Ralph Lauren Corporation | 0,00 | 426,31 | 1,24 | 556,08 | 0,6542 | 0,5525 | |||
| PKG / Packaging Corporation of America | 0,01 | −12,32 | 1,24 | −16,51 | 0,6537 | −0,1429 | |||
| RTX / RTX Corporation | 0,01 | 0,00 | 1,22 | 10,18 | 0,6456 | 0,0501 | |||
| HBAN / Huntington Bancshares Incorporated | 0,07 | 52,37 | 1,20 | 81,21 | 0,6313 | 0,3010 | |||
| TOL / Toll Brothers, Inc. | 0,01 | 0,00 | 1,17 | 8,12 | 0,6186 | 0,0367 | |||
| CAT / Caterpillar Inc. | 0,00 | 0,00 | 1,15 | 17,76 | 0,6091 | 0,0829 | |||
| AME / AMETEK, Inc. | 0,01 | 0,00 | 1,14 | 5,17 | 0,6010 | 0,0197 | |||
| FDX / FedEx Corporation | 0,00 | 129,65 | 1,13 | 114,18 | 0,5982 | 0,3141 | |||
| TXN / Texas Instruments Incorporated | 0,01 | 358,77 | 1,13 | 430,05 | 0,5960 | 0,4817 | |||
| COST / Costco Wholesale Corporation | 0,00 | 0,00 | 1,13 | 4,65 | 0,5944 | 0,0170 | |||
| GD / General Dynamics Corporation | 0,00 | −28,72 | 1,10 | −23,75 | 0,5798 | −0,1932 | |||
| PG / The Procter & Gamble Company | 0,01 | 0,00 | 1,09 | −6,52 | 0,5747 | −0,0504 | |||
| MSFT / Microsoft Corporation | 0,00 | 0,00 | 1,09 | 32,52 | 0,5745 | 0,1336 | |||
| APH / Amphenol Corporation | 0,01 | −42,37 | 1,08 | −13,28 | 0,5724 | −0,0984 | |||
| FOXA / Fox Corporation | 0,02 | 0,00 | 1,08 | −1,01 | 0,5689 | −0,0154 | |||
| NUE / Nucor Corporation | 0,01 | 0,00 | 1,08 | 7,72 | 0,5673 | 0,0314 | |||
| KIM / Kimco Realty Corporation | 0,05 | 0,00 | 1,07 | −1,11 | 0,5650 | −0,0155 | |||
| NDAQ / Nasdaq, Inc. | 0,01 | 0,00 | 1,07 | 17,90 | 0,5631 | 0,0774 | |||
| ADSK / Autodesk, Inc. | 0,00 | 0,00 | 1,03 | 18,19 | 0,5453 | 0,0764 | |||
| AAPL / Apple Inc. | 0,01 | 0,00 | 1,03 | −7,69 | 0,5449 | −0,0550 | |||
| TJX / The TJX Companies, Inc. | 0,01 | 0,00 | 0,99 | 1,33 | 0,5238 | −0,0015 | |||
| EXPD / Expeditors International of Washington, Inc. | 0,01 | 0,00 | 0,98 | −5,02 | 0,5195 | −0,0365 | |||
| ITW / Illinois Tool Works Inc. | 0,00 | 0,00 | 0,97 | −0,31 | 0,5142 | −0,0103 | |||
| PCG / PG&E Corporation | 0,07 | 392,42 | 0,96 | 300,84 | 0,5055 | 0,3769 | |||
| CMS / CMS Energy Corporation | 0,01 | −51,59 | 0,92 | −55,36 | 0,4839 | −0,6181 | |||
| MA / Mastercard Incorporated | 0,00 | 0,00 | 0,91 | 2,58 | 0,4824 | 0,0039 | |||
| OMF / OneMain Holdings, Inc. | 0,02 | 0,00 | 0,90 | 16,69 | 0,4760 | 0,0609 | |||
| CNC / Centene Corporation | 0,02 | 0,00 | 0,87 | −10,57 | 0,4596 | −0,0631 | |||
| CI / The Cigna Group | 0,00 | 0,00 | 0,86 | 0,47 | 0,4519 | −0,0054 | |||
| BIIB / Biogen Inc. | 0,01 | −26,70 | 0,85 | −32,75 | 0,4497 | −0,2300 | |||
| HAL / Halliburton Company | 0,04 | 0,00 | 0,84 | −19,71 | 0,4410 | −0,1172 | |||
| MPC / Marathon Petroleum Corporation | 0,00 | −43,17 | 0,83 | −35,24 | 0,4356 | −0,2480 | |||
| BSX / Boston Scientific Corporation | 0,01 | 0,00 | 0,82 | 6,48 | 0,4341 | 0,0195 | |||
| BWA / BorgWarner Inc. | 0,02 | 0,00 | 0,81 | 16,81 | 0,4256 | 0,0553 | |||
| BMRN / BioMarin Pharmaceutical Inc. | 0,01 | 0,00 | 0,81 | −22,22 | 0,4248 | −0,1307 | |||
| FLS / Flowserve Corporation | 0,02 | 50,67 | 0,80 | 61,57 | 0,4240 | 0,1570 | |||
| VZ / Verizon Communications Inc. | 0,02 | 0,00 | 0,80 | −4,64 | 0,4234 | −0,0279 | |||
| DHI / D.R. Horton, Inc. | 0,01 | −26,89 | 0,79 | −25,87 | 0,4175 | −0,1551 | |||
| FLEX / Flex Ltd. | 0,02 | 65,68 | 0,79 | 150,64 | 0,4154 | 0,2464 | |||
| GLW / Corning Incorporated | 0,01 | 0,76 | 0,3997 | 0,3997 | |||||
| UPS / United Parcel Service, Inc. | 0,01 | 7,05 | 0,75 | −27,27 | 0,3968 | −0,0996 | |||
| NVDA / NVIDIA Corporation | 0,00 | −37,69 | 0,74 | −9,17 | 0,3923 | −0,0469 | |||
| LNG / Cheniere Energy, Inc. | 0,00 | 69,97 | 0,73 | 79,02 | 0,3876 | 0,1673 | |||
| MRVL / Marvell Technology, Inc. | 0,01 | 0,00 | 0,72 | 25,65 | 0,3801 | 0,0727 | |||
| MCD / McDonald's Corporation | 0,00 | 158,39 | 0,71 | 141,84 | 0,3752 | 0,2173 | |||
| WM / Waste Management, Inc. | 0,00 | 0,00 | 0,71 | −1,12 | 0,3741 | −0,0108 | |||
| LRCX / Lam Research Corporation | 0,01 | 0,00 | 0,70 | 33,90 | 0,3714 | 0,0893 | |||
| NI / NiSource Inc. | 0,02 | −69,85 | 0,68 | −55,98 | 0,3614 | −0,1102 | |||
| ADBE / Adobe Inc. | 0,00 | 0,00 | 0,68 | 0,89 | 0,3578 | −0,0029 | |||
| MU / Micron Technology, Inc. | 0,01 | 0,00 | 0,64 | 41,72 | 0,3392 | 0,0961 | |||
| HEIA / Heico Corp. - Class A | 0,00 | 0,00 | 0,64 | 22,50 | 0,3365 | 0,0575 | |||
| NEM / Newmont Corporation | 0,01 | 0,63 | 0,3342 | 0,3342 | |||||
| ESTC / Elastic N.V. | 0,01 | 0,63 | 0,3311 | 0,3311 | |||||
| KNX / Knight-Swift Transportation Holdings Inc. | 0,01 | 273,65 | 0,61 | 297,39 | 0,3210 | 0,2729 | |||
| INTC / Intel Corporation | 0,03 | −16,67 | 0,61 | −17,80 | 0,3196 | −0,0758 | |||
| NEE / NextEra Energy, Inc. | 0,01 | 0,00 | 0,60 | −1,95 | 0,3177 | −0,0122 | |||
| NTRA / Natera, Inc. | 0,00 | 0,00 | 0,60 | 19,48 | 0,3172 | 0,0472 | |||
| GRMN / Garmin Ltd. | 0,00 | 112,10 | 0,60 | 104,11 | 0,3146 | 0,1577 | |||
| DAL / Delta Air Lines, Inc. | 0,01 | 0,00 | 0,59 | 12,74 | 0,3133 | 0,0309 | |||
| EIX / Edison International | 0,01 | 57,36 | 0,57 | 15,03 | 0,3031 | 0,3031 | |||
| DRI / Darden Restaurants, Inc. | 0,00 | −74,45 | 0,57 | −64,14 | 0,3001 | 0,3001 | |||
| PGR / The Progressive Corporation | 0,00 | −40,70 | 0,54 | −44,11 | 0,2858 | −0,2339 | |||
| FTNT / Fortinet, Inc. | 0,01 | −42,68 | 0,54 | −37,03 | 0,2844 | −0,1750 | |||
| GM / General Motors Company | 0,01 | 0,00 | 0,53 | 4,73 | 0,2803 | 0,0079 | |||
| INGR / Ingredion Incorporated | 0,00 | 0,00 | 0,53 | 0,38 | 0,2799 | −0,0038 | |||
| VTR / Ventas, Inc. | 0,01 | 0,00 | 0,53 | −8,22 | 0,2775 | −0,0297 | |||
| UNP / Union Pacific Corporation | 0,00 | 0,52 | 0,2737 | 0,2737 | |||||
| KDP / Keurig Dr Pepper Inc. | 0,02 | 136,90 | 0,51 | 151,23 | 0,2692 | 0,1693 | |||
| DD / DuPont de Nemours, Inc. | 0,01 | 0,00 | 0,51 | −8,29 | 0,2691 | −0,0288 | |||
| LAD / Lithia Motors, Inc. | 0,00 | 158,32 | 0,51 | 197,08 | 0,2684 | 0,1766 | |||
| CSCO / Cisco Systems, Inc. | 0,01 | 0,00 | 0,51 | 12,39 | 0,2683 | 0,0256 | |||
| WMB / The Williams Companies, Inc. | 0,01 | −39,40 | 0,50 | 13,06 | 0,2649 | 0,0301 | |||
| NNN / NNN REIT, Inc. | 0,01 | −63,95 | 0,49 | −56,18 | 0,2606 | −0,1481 | |||
| BX / Blackstone Inc. | 0,00 | 0,49 | 0,2605 | 0,2605 | |||||
| KR / The Kroger Co. | 0,01 | −28,16 | 0,49 | −23,80 | 0,2603 | −0,0873 | |||
| NOC / Northrop Grumman Corporation | 0,00 | −73,61 | 0,49 | −74,25 | 0,2593 | −0,7639 | |||
| MTZ / MasTec, Inc. | 0,00 | 0,00 | 0,48 | 46,06 | 0,2546 | 0,0773 | |||
| YUM / Yum! Brands, Inc. | 0,00 | −49,33 | 0,48 | −33,84 | 0,2528 | −0,0352 | |||
| TTWO / Take-Two Interactive Software, Inc. | 0,00 | 545,82 | 0,47 | 1 200,00 | 0,2474 | 0,2328 | |||
| AXP / American Express Company | 0,00 | 0,00 | 0,46 | 18,70 | 0,2413 | 0,0344 | |||
| CUBE / CubeSmart | 0,01 | 0,00 | 0,46 | −0,44 | 0,2401 | −0,0052 | |||
| AMD / Advanced Micro Devices, Inc. | 0,00 | 0,45 | 0,2367 | 0,2367 | |||||
| TMUS / T-Mobile US, Inc. | 0,00 | 0,44 | 0,2347 | 0,2347 | |||||
| MOS / The Mosaic Company | 0,01 | −63,37 | 0,44 | −50,62 | 0,2326 | −0,2454 | |||
| FIX / Comfort Systems USA, Inc. | 0,00 | −47,37 | 0,42 | −12,40 | 0,2238 | −0,0361 | |||
| CMI / Cummins Inc. | 0,00 | 0,00 | 0,41 | 4,29 | 0,2184 | 0,0059 | |||
| ELV / Elevance Health, Inc. | 0,00 | −69,15 | 0,41 | −72,40 | 0,2153 | −0,5781 | |||
| EW / Edwards Lifesciences Corporation | 0,00 | 0,00 | 0,38 | 7,95 | 0,2007 | 0,0116 | |||
| ACM / AECOM | 0,00 | 0,00 | 0,36 | 21,43 | 0,1888 | 0,0311 | |||
| FICO / Fair Isaac Corporation | 0,00 | 0,00 | 0,35 | −0,85 | 0,1861 | −0,0048 | |||
| KEYS / Keysight Technologies, Inc. | 0,00 | 0,00 | 0,34 | 9,32 | 0,1799 | 0,0127 | |||
| IBKR / Interactive Brokers Group, Inc. | 0,01 | 289,32 | 0,33 | 30,31 | 0,1748 | 0,0384 | |||
| HUN / Huntsman Corporation | 0,03 | 0,00 | 0,33 | −34,07 | 0,1727 | −0,0934 | |||
| HON / Honeywell International Inc. | 0,00 | −89,90 | 0,32 | −88,79 | 0,1668 | −1,2354 | |||
| AZO / AutoZone, Inc. | 0,00 | 0,32 | 0,1665 | 0,1665 | |||||
| PNR / Pentair plc | 0,00 | 0,30 | 0,1605 | 0,1605 | |||||
| KMX / CarMax, Inc. | 0,00 | 0,30 | 0,1576 | 0,1576 | |||||
| STZ / Constellation Brands, Inc. | 0,00 | 0,00 | 0,29 | −11,45 | 0,1555 | −0,0229 | |||
| V / Visa Inc. | 0,00 | −84,91 | 0,28 | −84,71 | 0,1499 | −0,8466 | |||
| KO / The Coca-Cola Company | 0,00 | 0,00 | 0,28 | −1,08 | 0,1459 | −0,0043 | |||
| RELY / Remitly Global, Inc. | 0,01 | 0,28 | 0,1451 | 0,1451 | |||||
| AR / Antero Resources Corporation | 0,01 | 0,26 | 0,1378 | 0,1378 | |||||
| SMG / The Scotts Miracle-Gro Company | 0,00 | 1 147,28 | 0,26 | 446,81 | 0,1359 | 0,1193 | |||
| DHR / Danaher Corporation | 0,00 | 0,00 | 0,25 | −3,45 | 0,1332 | −0,0074 | |||
| ED / Consolidated Edison, Inc. | 0,00 | 0,00 | 0,25 | −9,42 | 0,1324 | −0,0160 | |||
| EME / EMCOR Group, Inc. | 0,00 | −52,97 | 0,24 | −31,92 | 0,1273 | −0,0629 | |||
| BBY / Best Buy Co., Inc. | 0,00 | −49,34 | 0,23 | −58,69 | 0,1234 | −0,1474 | |||
| PINS / Pinterest, Inc. | 0,01 | 0,00 | 0,23 | 15,35 | 0,1233 | 0,0149 | |||
| GAP / The Gap, Inc. | 0,01 | 0,23 | 0,1233 | 0,1233 | |||||
| UBER / Uber Technologies, Inc. | 0,00 | 0,23 | 0,1231 | 0,1231 | |||||
| QRVO / Qorvo, Inc. | 0,00 | 0,23 | 0,1211 | 0,1211 | |||||
| CHYM / Chime Financial, Inc. | 0,01 | 0,22 | 0,1176 | 0,1176 | |||||
| ETOR / eToro Group Ltd. | 0,00 | 0,20 | 0,1047 | 0,1047 | |||||
| MRK / Merck & Co., Inc. | 0,00 | 0,00 | 0,20 | −11,71 | 0,1036 | −0,0158 | |||
| ADI / Analog Devices, Inc. | 0,00 | −94,85 | 0,19 | −93,81 | 0,1016 | 0,1016 | |||
| SLDE / Slide Insurance Holdings, Inc. | 0,01 | 0,16 | 0,0853 | 0,0853 | |||||
| JNPR / Juniper Networks, Inc. | 0,00 | −1,74 | 0,09 | 8,05 | 0,0501 | 0,0031 | |||
| S+P500 EMINI FUT SEP25 XCME 20250919 / DE (000000000) | 0,09 | 0,0462 | 0,0462 | ||||||
| FOX / Fox Corporation | 0,00 | −2,13 | 0,05 | −3,92 | 0,0263 | −0,0016 | |||
| CAI / Caris Life Sciences, Inc. | 0,00 | 0,03 | 0,0134 | 0,0134 | |||||
| VOYG / Voyager Technologies, Inc. | 0,00 | 0,01 | 0,0054 | 0,0054 | |||||
| UA / Under Armour, Inc. | 0,00 | −4,09 | 0,01 | 0,00 | 0,0047 | 0,0001 | |||
| UHS / Universal Health Services, Inc. | 0,00 | −100,00 | 0,00 | −100,00 | −0,1310 | ||||
| FLOC / Flowco Holdings Inc. | 0,00 | −100,00 | 0,00 | −100,00 | −0,0338 | ||||
| SAIL / SailPoint, Inc. | 0,00 | −100,00 | 0,00 | −100,00 | −0,0199 | ||||
| KRMN / Karman Holdings Inc. | 0,00 | −100,00 | 0,00 | −100,00 | −0,0519 | ||||
| BBNX / Beta Bionics, Inc. | 0,00 | −100,00 | 0,00 | −100,00 | −0,0209 | ||||
| MTSR / Metsera, Inc. | 0,00 | −100,00 | 0,00 | −100,00 | −0,0264 | ||||
| IRM / Iron Mountain Incorporated | 0,00 | −100,00 | 0,00 | −100,00 | −0,2293 | ||||
| TSN / Tyson Foods, Inc. | 0,00 | −100,00 | 0,00 | −100,00 | −0,4720 |