Grundläggande statistik
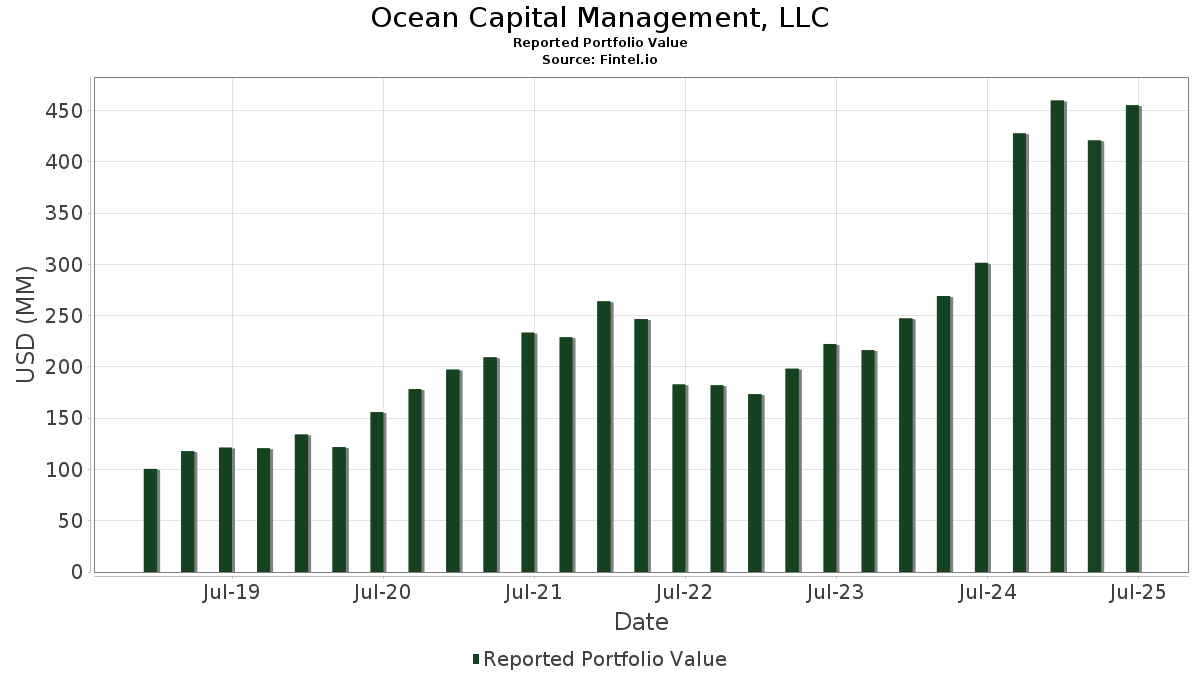
| Portföljvärde | $ 455 115 444 |
| Aktuella positioner | 121 |
Senaste innehav, resultat, förvaltat kapital (från 13F, 13D)
Ocean Capital Management, LLC har redovisat 121 totala innehav i sina senaste SEC-arkiveringar. Det senaste portföljvärdet beräknas vara $ 455 115 444 USD. Faktiskt förvaltade tillgångar (AUM) är detta värde plus likvida medel (som inte redovisas). Ocean Capital Management, LLCs största innehav är Apple Inc. (US:AAPL) , Costco Wholesale Corporation (US:COST) , Amazon.com, Inc. (US:AMZN) , NVIDIA Corporation (US:NVDA) , and Alphabet Inc. (US:GOOGL) . Ocean Capital Management, LLCs nya positioner inkluderar CoreWeave, Inc. (US:CRWV) , Circle Internet Group, Inc. (US:CRCL) , F5, Inc. (US:FFIV) , .
Största ökningarna detta kvartal
Vi använder förändringen i portföljallokeringen eftersom det är det mest meningsfulla måttet. Förändringar kan bero på transaktioner eller förändringar i aktiekurser.
| Värdepapper | Aktier (MM) |
Värde (MM$) |
Portfölj % av | ΔPortfölj % av |
|---|---|---|---|---|
| 0,25 | 39,57 | 8,6935 | 2,0006 | |
| 0,01 | 11,90 | 2,6158 | 0,6561 | |
| 0,02 | 6,78 | 1,4893 | 0,5317 | |
| 0,04 | 18,03 | 3,9608 | 0,5254 | |
| 0,05 | 6,27 | 1,3779 | 0,4653 | |
| 0,01 | 2,28 | 0,5021 | 0,2447 | |
| 0,22 | 49,01 | 10,7688 | 0,2248 | |
| 0,00 | 2,05 | 0,4502 | 0,1725 | |
| 0,02 | 4,26 | 0,9357 | 0,1718 | |
| 0,01 | 1,81 | 0,3984 | 0,1642 |
Största minskningarna detta kvartal
Vi använder förändringen i portföljallokeringen eftersom det är det mest meningsfulla måttet. Förändringar kan bero på transaktioner eller förändringar i aktiepriser.
| Värdepapper | Aktier (MM) |
Värde (MM$) |
Portfölj % av | ΔPortfölj % av |
|---|---|---|---|---|
| 0,30 | 61,30 | 13,4698 | −2,8090 | |
| 0,02 | 5,50 | 1,2074 | −1,0152 | |
| 0,06 | 54,98 | 12,0810 | −0,6502 | |
| 0,09 | 9,09 | 1,9977 | −0,4671 | |
| 0,01 | 2,03 | 0,4453 | −0,2010 | |
| 0,02 | 6,28 | 1,3790 | −0,1686 | |
| 0,01 | 5,02 | 1,1036 | −0,1456 | |
| 0,02 | 0,89 | 0,1946 | −0,1079 | |
| 0,01 | 1,64 | 0,3606 | −0,0795 | |
| 0,01 | 1,17 | 0,2580 | −0,0758 |
13F- och fond arkiveringar
Denna blankett lämnades in den 2025-08-04 för rapporteringsperioden 2025-06-30. Klicka på länksymbolen för att se hela transaktionshistoriken.
Uppgradera för att låsa upp premiumdata och exportera till Excel![]() .
.
| Värdepapper | Typ | Genomsnittligt aktiepris | Aktier (MM) |
ΔAktier (%) |
ΔAktier (%) |
Värde ($MM) |
Portfölj (%) |
ΔPortfölj (%) |
|
|---|---|---|---|---|---|---|---|---|---|
| AAPL / Apple Inc. | 0,30 | −3,10 | 61,30 | −10,50 | 13,4698 | −2,8090 | |||
| COST / Costco Wholesale Corporation | 0,06 | −1,91 | 54,98 | 2,64 | 12,0810 | −0,6502 | |||
| AMZN / Amazon.com, Inc. | 0,22 | −4,20 | 49,01 | 10,47 | 10,7688 | 0,2248 | |||
| NVDA / NVIDIA Corporation | 0,25 | −3,62 | 39,57 | 40,50 | 8,6935 | 2,0006 | |||
| GOOGL / Alphabet Inc. | 0,21 | −3,39 | 36,17 | 10,08 | 7,9465 | 0,1385 | |||
| MSFT / Microsoft Corporation | 0,04 | −5,88 | 18,03 | 24,71 | 3,9608 | 0,5254 | |||
| GOOG / Alphabet Inc. | 0,09 | −2,59 | 15,34 | 10,60 | 3,3708 | 0,0741 | |||
| NFLX / Netflix, Inc. | 0,01 | 0,54 | 11,90 | 44,38 | 2,6158 | 0,6561 | |||
| DECK / Deckers Outdoor Corporation | 0,09 | −4,90 | 9,09 | −12,34 | 1,9977 | −0,4671 | |||
| AVGO / Broadcom Inc. | 0,02 | 2,18 | 6,78 | 68,23 | 1,4893 | 0,5317 | |||
| V / Visa Inc. | 0,02 | −4,87 | 6,28 | −3,61 | 1,3790 | −0,1686 | |||
| PLTR / Palantir Technologies Inc. | 0,05 | 1,11 | 6,27 | 63,32 | 1,3779 | 0,4653 | |||
| WMT / Walmart Inc. | 0,06 | −0,74 | 6,22 | 10,56 | 1,3665 | 0,0296 | |||
| UNH / UnitedHealth Group Incorporated | 0,02 | −1,35 | 5,50 | −41,24 | 1,2074 | −1,0152 | |||
| JPM / JPMorgan Chase & Co. | 0,02 | −1,87 | 5,42 | 15,97 | 1,1903 | 0,0801 | |||
| SYK / Stryker Corporation | 0,01 | −2,33 | 5,28 | 3,81 | 1,1605 | −0,0487 | |||
| NOC / Northrop Grumman Corporation | 0,01 | −2,14 | 5,02 | −4,45 | 1,1036 | −0,1456 | |||
| LMT / Lockheed Martin Corporation | 0,01 | −1,03 | 4,93 | 2,62 | 1,0833 | −0,0587 | |||
| RTX / RTX Corporation | 0,03 | 6,65 | 4,89 | 17,56 | 1,0737 | 0,0859 | |||
| INTU / Intuit Inc. | 0,01 | −2,08 | 4,59 | 25,62 | 1,0086 | 0,1401 | |||
| CRM / Salesforce, Inc. | 0,02 | −0,36 | 4,50 | 1,24 | 0,9893 | −0,0676 | |||
| PANW / Palo Alto Networks, Inc. | 0,02 | 10,47 | 4,26 | 32,48 | 0,9357 | 0,1718 | |||
| LHX / L3Harris Technologies, Inc. | 0,01 | 20,69 | 2,50 | 44,60 | 0,5502 | 0,1387 | |||
| META / Meta Platforms, Inc. | 0,00 | 0,00 | 2,40 | 28,07 | 0,5275 | 0,0820 | |||
| HD / The Home Depot, Inc. | 0,01 | 3,49 | 2,35 | 3,53 | 0,5160 | −0,0231 | |||
| NET / Cloudflare, Inc. | 0,01 | 21,44 | 2,28 | 111,09 | 0,5021 | 0,2447 | |||
| CAT / Caterpillar Inc. | 0,01 | −0,96 | 2,28 | 16,62 | 0,5011 | 0,0363 | |||
| STWD / Starwood Property Trust, Inc. | 0,11 | −1,05 | 2,26 | 0,44 | 0,4967 | −0,0382 | |||
| BAC / Bank of America Corporation | 0,04 | −11,31 | 2,10 | 0,57 | 0,4618 | −0,0349 | |||
| SBUX / Starbucks Corporation | 0,02 | 13,36 | 2,08 | 5,89 | 0,4580 | −0,0098 | |||
| GEV / GE Vernova Inc. | 0,00 | 1,18 | 2,05 | 75,34 | 0,4502 | 0,1725 | |||
| ITW / Illinois Tool Works Inc. | 0,01 | −25,24 | 2,03 | −25,49 | 0,4453 | −0,2010 | |||
| C / Citigroup Inc. | 0,02 | −2,75 | 2,01 | 16,61 | 0,4412 | 0,0319 | |||
| BX / Blackstone Inc. | 0,01 | 0,07 | 1,93 | 7,11 | 0,4239 | −0,0043 | |||
| MCD / McDonald's Corporation | 0,01 | 0,96 | 1,91 | −5,55 | 0,4191 | −0,0610 | |||
| CEG / Constellation Energy Corporation | 0,01 | 14,93 | 1,81 | 84,06 | 0,3984 | 0,1642 | |||
| GD / General Dynamics Corporation | 0,01 | 49,72 | 1,73 | 60,17 | 0,3792 | 0,1232 | |||
| MA / Mastercard Incorporated | 0,00 | 0,03 | 1,70 | 2,60 | 0,3729 | −0,0203 | |||
| QCOM / QUALCOMM Incorporated | 0,01 | −3,49 | 1,68 | 0,06 | 0,3682 | −0,0298 | |||
| ETN / Eaton Corporation plc | 0,00 | 8,59 | 1,67 | 42,63 | 0,3677 | 0,0888 | |||
| AMGN / Amgen Inc. | 0,01 | −1,13 | 1,64 | −11,40 | 0,3606 | −0,0795 | |||
| UBER / Uber Technologies, Inc. | 0,02 | 1,61 | 1,62 | 30,18 | 0,3565 | 0,0601 | |||
| CINF / Cincinnati Financial Corporation | 0,01 | −0,14 | 1,55 | 0,72 | 0,3395 | −0,0253 | |||
| PM / Philip Morris International Inc. | 0,01 | −2,25 | 1,52 | 12,19 | 0,3339 | 0,0119 | |||
| GE / General Electric Company | 0,01 | 1,59 | 1,50 | 30,66 | 0,3289 | 0,0566 | |||
| AMD / Advanced Micro Devices, Inc. | 0,01 | 23,40 | 1,49 | 70,56 | 0,3273 | 0,1196 | |||
| DIS / The Walt Disney Company | 0,01 | −11,58 | 1,37 | 11,12 | 0,3009 | 0,0079 | |||
| PG / The Procter & Gamble Company | 0,01 | −8,05 | 1,32 | −14,02 | 0,2896 | −0,0748 | |||
| XOM / Exxon Mobil Corporation | 0,01 | −5,33 | 1,26 | −14,23 | 0,2770 | −0,0722 | |||
| WFC / Wells Fargo & Company | 0,02 | 8,48 | 1,25 | 21,07 | 0,2742 | 0,0292 | |||
| ORCL / Oracle Corporation | 0,01 | 8,07 | 1,25 | 68,97 | 0,2740 | 0,0986 | |||
| ABBV / AbbVie Inc. | 0,01 | −5,62 | 1,17 | −16,38 | 0,2580 | −0,0758 | |||
| VST / Vistra Corp. | 0,01 | 8,10 | 1,07 | 78,54 | 0,2359 | 0,0929 | |||
| LULU / lululemon athletica inc. | 0,00 | −3,30 | 0,97 | −18,85 | 0,2140 | −0,0712 | |||
| AXP / American Express Company | 0,00 | −6,97 | 0,97 | 10,35 | 0,2132 | 0,0041 | |||
| TMUS / T-Mobile US, Inc. | 0,00 | −2,73 | 0,97 | −13,12 | 0,2126 | −0,0521 | |||
| TSM / Taiwan Semiconductor Manufacturing Company Limited - Depositary Receipt (Common Stock) | 0,00 | 2,39 | 0,95 | 39,65 | 0,2092 | 0,0472 | |||
| LLY / Eli Lilly and Company | 0,00 | 0,08 | 0,95 | −5,47 | 0,2088 | −0,0303 | |||
| CVS / CVS Health Corporation | 0,01 | −1,07 | 0,94 | 0,75 | 0,2066 | −0,0153 | |||
| TRV / The Travelers Companies, Inc. | 0,00 | 0,00 | 0,94 | 1,19 | 0,2063 | −0,0143 | |||
| ELV / Elevance Health, Inc. | 0,00 | −4,00 | 0,90 | −14,15 | 0,1987 | −0,0517 | |||
| BMY / Bristol-Myers Squibb Company | 0,02 | −8,31 | 0,89 | −30,42 | 0,1946 | −0,1079 | |||
| ADBE / Adobe Inc. | 0,00 | −6,08 | 0,87 | −5,21 | 0,1919 | −0,0272 | |||
| PNC / The PNC Financial Services Group, Inc. | 0,00 | 0,50 | 0,85 | 6,62 | 0,1878 | −0,0028 | |||
| INVH / Invitation Homes Inc. | 0,03 | 0,00 | 0,84 | −5,84 | 0,1842 | −0,0275 | |||
| DD / DuPont de Nemours, Inc. | 0,01 | 21,18 | 0,83 | 11,29 | 0,1820 | 0,0051 | |||
| MDB / MongoDB, Inc. | 0,00 | −13,53 | 0,82 | 3,55 | 0,1796 | −0,0081 | |||
| MS / Morgan Stanley | 0,01 | 0,07 | 0,81 | 20,86 | 0,1782 | 0,0187 | |||
| IBM / International Business Machines Corporation | 0,00 | 0,40 | 0,80 | 18,93 | 0,1768 | 0,0161 | |||
| SHW / The Sherwin-Williams Company | 0,00 | 0,00 | 0,80 | −1,60 | 0,1754 | −0,0175 | |||
| STE / STERIS plc | 0,00 | 0,00 | 0,74 | 5,98 | 0,1636 | −0,0034 | |||
| GEHC / GE HealthCare Technologies Inc. | 0,01 | 0,81 | 0,70 | −7,52 | 0,1542 | −0,0261 | |||
| DHR / Danaher Corporation | 0,00 | 8,52 | 0,69 | 4,52 | 0,1527 | −0,0052 | |||
| UNP / Union Pacific Corporation | 0,00 | 0,52 | 0,67 | −2,20 | 0,1465 | −0,0153 | |||
| CMG / Chipotle Mexican Grill, Inc. | 0,01 | 0,00 | 0,66 | 11,95 | 0,1442 | 0,0047 | |||
| RDDT / Reddit, Inc. | 0,00 | 36,01 | 0,62 | 95,60 | 0,1367 | 0,0610 | |||
| CVX / Chevron Corporation | 0,00 | −1,75 | 0,62 | −15,94 | 0,1357 | −0,0389 | |||
| CSCO / Cisco Systems, Inc. | 0,01 | 15,04 | 0,61 | 29,49 | 0,1332 | 0,0218 | |||
| VZ / Verizon Communications Inc. | 0,01 | −0,77 | 0,58 | −5,25 | 0,1269 | −0,0181 | |||
| GILD / Gilead Sciences, Inc. | 0,00 | −15,20 | 0,54 | −16,17 | 0,1186 | −0,0343 | |||
| AMP / Ameriprise Financial, Inc. | 0,00 | 0,20 | 0,52 | 10,57 | 0,1149 | 0,0024 | |||
| JNJ / Johnson & Johnson | 0,00 | −1,79 | 0,52 | −9,60 | 0,1140 | −0,0223 | |||
| WM / Waste Management, Inc. | 0,00 | 0,14 | 0,49 | −1,02 | 0,1068 | −0,0100 | |||
| ABT / Abbott Laboratories | 0,00 | 13,00 | 0,48 | 15,74 | 0,1052 | 0,0070 | |||
| BROS / Dutch Bros Inc. | 0,01 | 30,11 | 0,47 | 43,90 | 0,1039 | 0,0259 | |||
| MRK / Merck & Co., Inc. | 0,01 | −3,14 | 0,47 | −14,70 | 0,1034 | −0,0275 | |||
| MO / Altria Group, Inc. | 0,01 | 0,51 | 0,46 | −1,69 | 0,1020 | −0,0104 | |||
| SCHW / The Charles Schwab Corporation | 0,00 | 0,10 | 0,45 | 16,80 | 0,0979 | 0,0071 | |||
| MDT / Medtronic plc | 0,01 | −0,61 | 0,44 | −3,49 | 0,0971 | −0,0118 | |||
| PEP / PepsiCo, Inc. | 0,00 | 1,28 | 0,41 | −10,94 | 0,0896 | −0,0191 | |||
| SONY / Sony Group Corporation - Depositary Receipt (Common Stock) | 0,02 | 0,00 | 0,41 | 2,53 | 0,0893 | −0,0049 | |||
| MPC / Marathon Petroleum Corporation | 0,00 | −11,88 | 0,40 | 0,50 | 0,0883 | −0,0068 | |||
| PYPL / PayPal Holdings, Inc. | 0,01 | −12,85 | 0,40 | −0,75 | 0,0870 | −0,0078 | |||
| T / AT&T Inc. | 0,01 | −11,05 | 0,39 | −9,01 | 0,0868 | −0,0163 | |||
| PPG / PPG Industries, Inc. | 0,00 | −2,09 | 0,38 | 1,89 | 0,0832 | −0,0052 | |||
| RACE / Ferrari N.V. | 0,00 | 0,00 | 0,37 | 15,00 | 0,0809 | 0,0046 | |||
| INTC / Intel Corporation | 0,02 | −2,80 | 0,36 | −4,03 | 0,0785 | −0,0101 | |||
| BRK.B / Berkshire Hathaway Inc. | 0,00 | −17,97 | 0,34 | −25,22 | 0,0750 | −0,0334 | |||
| NVO / Novo Nordisk A/S - Depositary Receipt (Common Stock) | 0,00 | 0,41 | 0,33 | 0,00 | 0,0734 | −0,0061 | |||
| LVS / Las Vegas Sands Corp. | 0,01 | −2,49 | 0,33 | 9,73 | 0,0720 | 0,0011 | |||
| CRWV / CoreWeave, Inc. | 0,00 | 0,32 | 0,0704 | 0,0704 | |||||
| NEE / NextEra Energy, Inc. | 0,00 | −2,60 | 0,32 | −4,48 | 0,0703 | −0,0094 | |||
| BABA / Alibaba Group Holding Limited - Depositary Receipt (Common Stock) | 0,00 | −4,08 | 0,32 | −17,78 | 0,0703 | −0,0221 | |||
| BIIB / Biogen Inc. | 0,00 | 0,00 | 0,32 | −8,36 | 0,0701 | −0,0125 | |||
| MDLZ / Mondelez International, Inc. | 0,00 | −4,01 | 0,31 | −4,60 | 0,0684 | −0,0091 | |||
| CI / The Cigna Group | 0,00 | 0,11 | 0,29 | 0,68 | 0,0647 | −0,0048 | |||
| MGM / MGM Resorts International | 0,01 | 0,00 | 0,29 | 15,79 | 0,0630 | 0,0043 | |||
| KKR / KKR & Co. Inc. | 0,00 | 0,00 | 0,28 | 14,81 | 0,0615 | 0,0037 | |||
| PSX / Phillips 66 | 0,00 | −1,99 | 0,27 | −5,26 | 0,0594 | −0,0084 | |||
| R / Ryder System, Inc. | 0,00 | 0,18 | 0,26 | 10,68 | 0,0570 | 0,0013 | |||
| CBOE / Cboe Global Markets, Inc. | 0,00 | 0,27 | 0,26 | 3,66 | 0,0561 | −0,0026 | |||
| CRCL / Circle Internet Group, Inc. | 0,00 | 0,25 | 0,0552 | 0,0552 | |||||
| NFG / National Fuel Gas Company | 0,00 | 0,64 | 0,24 | 7,66 | 0,0526 | −0,0002 | |||
| STX / Seagate Technology Holdings plc | 0,00 | 0,24 | 0,0521 | 0,0521 | |||||
| URI / United Rentals, Inc. | 0,00 | 0,22 | 0,0484 | 0,0484 | |||||
| TXN / Texas Instruments Incorporated | 0,00 | 0,21 | 0,0471 | 0,0471 | |||||
| HBAN / Huntington Bancshares Incorporated | 0,01 | 0,21 | 0,21 | 12,11 | 0,0470 | 0,0016 | |||
| FFIV / F5, Inc. | 0,00 | 0,21 | 0,0455 | 0,0455 | |||||
| HON / Honeywell International Inc. | 0,00 | 0,21 | 0,0455 | 0,0455 | |||||
| FEMY / Femasys Inc. | 0,02 | 0,00 | 0,02 | −23,33 | 0,0051 | −0,0021 | |||
| SMRT / SmartRent, Inc. | 0,02 | 0,00 | 0,02 | −21,05 | 0,0034 | −0,0011 | |||
| ZS / Zscaler, Inc. | 0,00 | −100,00 | 0,00 | 0,0000 | |||||
| KO / The Coca-Cola Company | 0,00 | −100,00 | 0,00 | 0,0000 | |||||
| TSLA / Tesla, Inc. | 0,00 | −100,00 | 0,00 | −100,00 | −0,0642 |