Grundläggande statistik
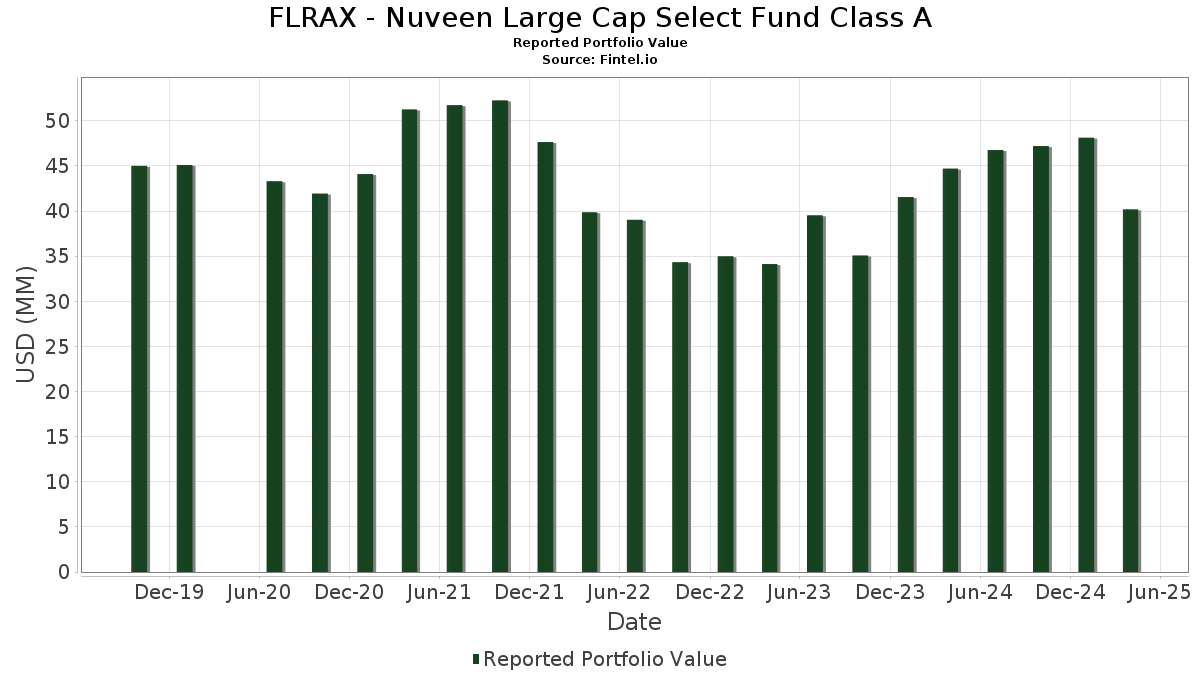
| Portföljvärde | $ 40 168 350 |
| Aktuella positioner | 62 |
Senaste innehav, resultat, förvaltat kapital (från 13F, 13D)
FLRAX - Nuveen Large Cap Select Fund Class A har redovisat 62 totala innehav i sina senaste SEC-arkiveringar. Det senaste portföljvärdet beräknas vara $ 40 168 350 USD. Faktiskt förvaltade tillgångar (AUM) är detta värde plus likvida medel (som inte redovisas). FLRAX - Nuveen Large Cap Select Fund Class As största innehav är Microsoft Corporation (US:MSFT) , NVIDIA Corporation (US:NVDA) , Apple Inc. (US:AAPL) , Amazon.com, Inc. (US:AMZN) , and Alphabet Inc. (US:GOOG) . FLRAX - Nuveen Large Cap Select Fund Class As nya positioner inkluderar Las Vegas Sands Corp. (US:LVS) , Aon plc (US:AON) , Netflix, Inc. (US:NFLX) , Shell plc (MX:SHEL N) , and CMS Energy Corporation (US:CMS) .
Största ökningarna detta kvartal
Vi använder förändringen i portföljallokeringen eftersom det är det mest meningsfulla måttet. Förändringar kan bero på transaktioner eller förändringar i aktiekurser.
| Värdepapper | Aktier (MM) |
Värde (MM$) |
Portfölj % av | ΔPortfölj % av |
|---|---|---|---|---|
| 0,00 | 0,66 | 1,6320 | 1,6320 | |
| 0,02 | 0,61 | 1,5138 | 1,5138 | |
| 0,02 | 0,55 | 1,3783 | 1,3783 | |
| 0,02 | 2,26 | 5,6218 | 1,2897 | |
| 0,01 | 0,51 | 1,2784 | 1,2784 | |
| 0,00 | 0,51 | 1,2664 | 1,2664 | |
| 0,00 | 0,41 | 1,0085 | 1,0085 | |
| 0,01 | 0,37 | 0,9195 | 0,9195 | |
| 0,00 | 0,35 | 0,8804 | 0,8804 | |
| 0,01 | 3,31 | 8,2450 | 0,8086 |
Största minskningarna detta kvartal
Vi använder förändringen i portföljallokeringen eftersom det är det mest meningsfulla måttet. Förändringar kan bero på transaktioner eller förändringar i aktiepriser.
| Värdepapper | Aktier (MM) |
Värde (MM$) |
Portfölj % av | ΔPortfölj % av |
|---|---|---|---|---|
| 0,01 | 1,95 | 4,8659 | −3,1973 | |
| 0,00 | 0,00 | −1,2999 | ||
| 0,00 | 0,00 | −1,1751 | ||
| 0,01 | 0,16 | 0,4073 | −1,1510 | |
| 0,00 | 0,24 | 0,6089 | −1,0231 | |
| 0,01 | 1,90 | 4,7366 | −0,9873 | |
| 0,00 | 0,64 | 1,5967 | −0,8239 | |
| 0,00 | 0,22 | 0,5511 | −0,6504 | |
| 0,01 | 1,75 | 4,3682 | −0,5251 | |
| 0,00 | 0,36 | 0,8975 | −0,5042 |
13F- och fond arkiveringar
Denna blankett lämnades in den 2025-06-26 för rapporteringsperioden 2025-04-30. Klicka på länksymbolen för att se hela transaktionshistoriken.
Uppgradera för att låsa upp premiumdata och exportera till Excel![]() .
.
| Värdepapper | Typ | Genomsnittligt aktiepris | Aktier (MM) |
ΔAktier (%) |
ΔAktier (%) |
Värde ($MM) |
Portfölj (%) |
ΔPortfölj (%) |
|
|---|---|---|---|---|---|---|---|---|---|
| MSFT / Microsoft Corporation | 0,01 | −2,80 | 3,31 | −7,43 | 8,2450 | 0,8086 | |||
| NVDA / NVIDIA Corporation | 0,02 | 19,43 | 2,26 | 8,35 | 5,6218 | 1,2897 | |||
| AAPL / Apple Inc. | 0,01 | −44,05 | 1,95 | −49,63 | 4,8659 | −3,1973 | |||
| AMZN / Amazon.com, Inc. | 0,01 | −10,96 | 1,90 | −30,94 | 4,7366 | −0,9873 | |||
| GOOG / Alphabet Inc. | 0,01 | −4,76 | 1,75 | −25,49 | 4,3682 | −0,5251 | |||
| AVGO / Broadcom Inc. | 0,01 | −4,75 | 1,40 | −17,18 | 3,4936 | −0,0270 | |||
| META / Meta Platforms, Inc. | 0,00 | −4,70 | 1,04 | −24,12 | 2,5788 | −0,2572 | |||
| MA / Mastercard Incorporated | 0,00 | −4,68 | 0,96 | −5,97 | 2,3915 | 0,2687 | |||
| CI / The Cigna Group | 0,00 | −4,76 | 0,92 | 10,06 | 2,2888 | 0,5529 | |||
| PM / Philip Morris International Inc. | 0,00 | −4,77 | 0,82 | 25,23 | 2,0534 | 0,6856 | |||
| WM / Waste Management, Inc. | 0,00 | 16,44 | 0,71 | 23,26 | 1,7694 | 0,5719 | |||
| MMC / Marsh & McLennan Companies, Inc. | 0,00 | −4,80 | 0,67 | −1,04 | 1,6574 | 0,2592 | |||
| COF / Capital One Financial Corporation | 0,00 | 0,66 | 1,6320 | 1,6320 | |||||
| ROP / Roper Technologies, Inc. | 0,00 | −4,69 | 0,65 | −7,15 | 1,6158 | 0,1611 | |||
| ABT / Abbott Laboratories | 0,00 | −4,35 | 0,64 | 10,48 | 1,6019 | 0,2005 | |||
| UNH / UnitedHealth Group Incorporated | 0,00 | −27,39 | 0,64 | −44,93 | 1,5967 | −0,8239 | |||
| T / AT&T Inc. | 0,02 | −21,80 | 0,61 | −8,78 | 1,5283 | 0,1305 | |||
| LVS / Las Vegas Sands Corp. | 0,02 | 0,61 | 1,5138 | 1,5138 | |||||
| FNF / Fidelity National Financial, Inc. | 0,01 | 11,42 | 0,60 | 22,90 | 1,4963 | 0,4780 | |||
| PLD / Prologis, Inc. | 0,01 | −4,76 | 0,59 | −18,41 | 1,4569 | −0,0332 | |||
| C / Citigroup Inc. - Corporate Bond/Note | 0,01 | −4,76 | 0,58 | −20,03 | 1,4318 | −0,0628 | |||
| ZBH / Zimmer Biomet Holdings, Inc. | 0,01 | −17,35 | 0,58 | −22,19 | 1,4314 | −0,1047 | |||
| CRM / Salesforce, Inc. | 0,00 | −4,73 | 0,57 | −25,20 | 1,4287 | −0,1634 | |||
| KDP / Keurig Dr Pepper Inc. | 0,02 | 0,55 | 1,3783 | 1,3783 | |||||
| WAB / Westinghouse Air Brake Technologies Corporation | 0,00 | 27,30 | 0,55 | 13,07 | 1,3575 | 0,3555 | |||
| ETN / Eaton Corporation plc | 0,00 | 56,48 | 0,52 | 38,87 | 1,2911 | 0,4999 | |||
| FIS / Fidelity National Information Services, Inc. | 0,01 | 0,51 | 1,2784 | 1,2784 | |||||
| JCI / Johnson Controls International plc | 0,01 | 18,93 | 0,51 | 27,75 | 1,2740 | 0,4425 | |||
| AON / Aon plc | 0,00 | 0,51 | 1,2664 | 1,2664 | |||||
| ICE / Intercontinental Exchange, Inc. | 0,00 | −15,37 | 0,51 | −11,21 | 1,2644 | 0,0776 | |||
| DHR / Danaher Corporation | 0,00 | 43,69 | 0,50 | 13,80 | 1,2533 | −0,0346 | |||
| THC / Tenet Healthcare Corporation | 0,00 | −4,79 | 0,50 | −3,50 | 1,2369 | 0,1679 | |||
| PH / Parker-Hannifin Corporation | 0,00 | −4,66 | 0,50 | −18,45 | 1,2335 | −0,0287 | |||
| FI / Fiserv, Inc. | 0,00 | −4,76 | 0,50 | −18,59 | 1,2331 | −0,0321 | |||
| BSX / Boston Scientific Corporation | 0,00 | −4,77 | 0,48 | −4,37 | 1,2017 | 0,1534 | |||
| 0HG8 / Elevance Health, Inc. | 0,00 | −37,71 | 0,46 | −33,81 | 1,1516 | −0,3007 | |||
| SNX / TD SYNNEX Corporation | 0,00 | −17,91 | 0,46 | −36,15 | 1,1479 | −0,3537 | |||
| CNC / Centene Corporation | 0,01 | 67,74 | 0,46 | 33,43 | 1,1440 | 0,3142 | |||
| KKR / KKR & Co. Inc. | 0,00 | −4,76 | 0,45 | −34,87 | 1,1267 | −0,3174 | |||
| GEN / Gen Digital Inc. | 0,02 | −4,76 | 0,44 | −8,51 | 1,0998 | 0,0970 | |||
| NEE / NextEra Energy, Inc. | 0,01 | −4,77 | 0,43 | −10,97 | 1,0711 | 0,0664 | |||
| DOV / Dover Corporation | 0,00 | −4,80 | 0,42 | −20,34 | 1,0446 | −0,0488 | |||
| ELAN / Elanco Animal Health Incorporated | 0,04 | −4,75 | 0,41 | −25,09 | 1,0279 | −0,1154 | |||
| LNT / Alliant Energy Corporation | 0,01 | 70,09 | 0,41 | 113,09 | 1,0136 | 0,4660 | |||
| NOW / ServiceNow, Inc. | 0,00 | 105,80 | 0,41 | 93,33 | 1,0127 | 0,5746 | |||
| NFLX / Netflix, Inc. | 0,00 | 0,41 | 1,0085 | 1,0085 | |||||
| VRT / Vertiv Holdings Co | 0,00 | −67,23 | 0,40 | 34,22 | 1,0080 | 0,3739 | |||
| SYF / Synchrony Financial | 0,01 | −4,77 | 0,39 | −28,34 | 0,9780 | −0,1605 | |||
| EXPE / Expedia Group, Inc. | 0,00 | −23,47 | 0,39 | −29,86 | 0,9731 | −0,1833 | |||
| PR / Permian Resources Corporation | 0,03 | −4,75 | 0,37 | −23,40 | 0,9230 | −0,0815 | |||
| SHEL N / Shell plc | 0,01 | 0,37 | 0,9195 | 0,9195 | |||||
| BDX / Becton, Dickinson and Company | 0,00 | −36,09 | 0,36 | −46,59 | 0,8975 | −0,5042 | |||
| CMS / CMS Energy Corporation | 0,00 | 0,35 | 0,8804 | 0,8804 | |||||
| TSM / Taiwan Semiconductor Manufacturing Company Limited - Depositary Receipt (Common Stock) | 0,00 | −22,82 | 0,34 | −38,57 | 0,8577 | −0,3073 | |||
| EMR / Emerson Electric Co. | 0,00 | −4,77 | 0,34 | −22,94 | 0,8365 | −0,0701 | |||
| NVT / nVent Electric plc | 0,01 | 68,25 | 0,30 | 41,83 | 0,7366 | 0,3033 | |||
| TT / Trane Technologies plc | 0,00 | −4,68 | 0,29 | 0,70 | 0,7185 | 0,1229 | |||
| US7587501039 / Regal-Beloit Corp. | 0,00 | −4,78 | 0,28 | −36,61 | 0,7087 | −0,2232 | |||
| SO / The Southern Company | 0,00 | −71,54 | 0,24 | −68,92 | 0,6089 | −1,0231 | |||
| NVO / Novo Nordisk A/S - Depositary Receipt (Common Stock) | 0,00 | −51,33 | 0,22 | −61,76 | 0,5511 | −0,6504 | |||
| INTC / Intel Corporation | 0,01 | −45,83 | 0,16 | −74,81 | 0,4073 | −1,1510 | |||
| US85748R0096 / Dreyfus Institutional Preferred Government Plus Money Market Fund | 0,03 | −88,89 | 0,0622 | −0,4054 | |||||
| MRVL / Marvell Technology, Inc. | 0,00 | −100,00 | 0,00 | −100,00 | −1,1751 | ||||
| ORCL / Oracle Corporation | 0,00 | −100,00 | 0,00 | −100,00 | −1,2999 |