Grundläggande statistik
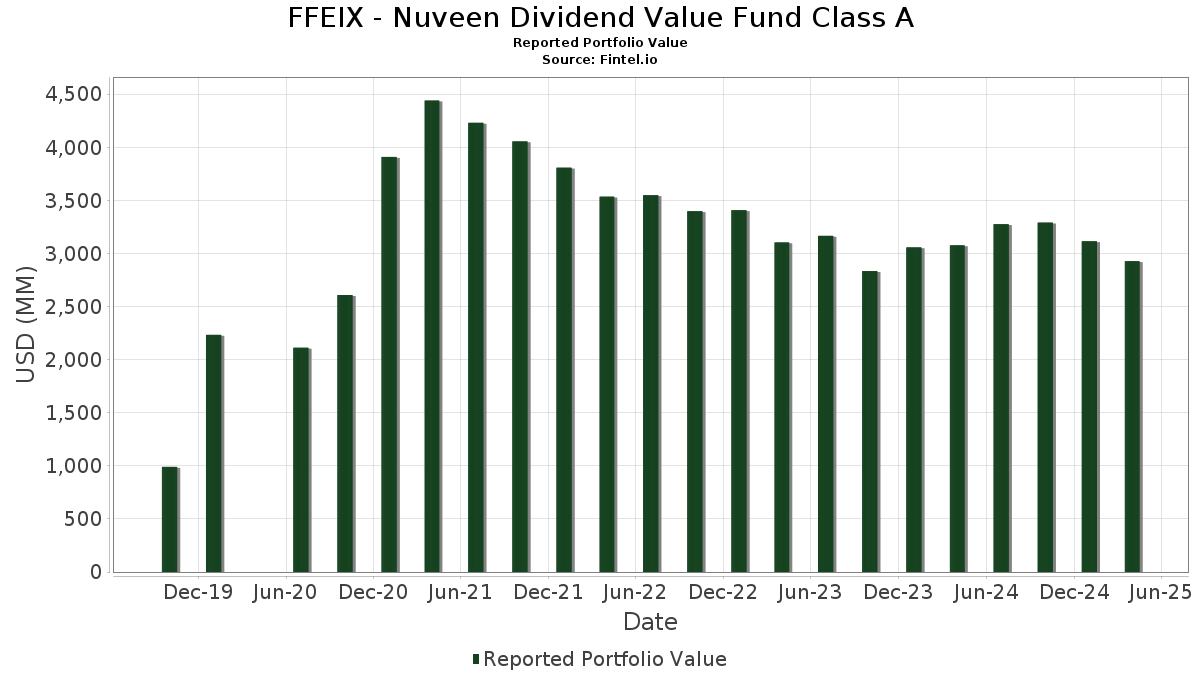
| Portföljvärde | $ 2 927 481 087 |
| Aktuella positioner | 72 |
Senaste innehav, resultat, förvaltat kapital (från 13F, 13D)
FFEIX - Nuveen Dividend Value Fund Class A har redovisat 72 totala innehav i sina senaste SEC-arkiveringar. Det senaste portföljvärdet beräknas vara $ 2 927 481 087 USD. Faktiskt förvaltade tillgångar (AUM) är detta värde plus likvida medel (som inte redovisas). FFEIX - Nuveen Dividend Value Fund Class As största innehav är Philip Morris International Inc. (US:PM) , Wells Fargo & Company (US:WFC) , AT&T Inc. (US:T) , Citigroup Inc. - Corporate Bond/Note (US:C) , and UnitedHealth Group Incorporated (US:UNH) . FFEIX - Nuveen Dividend Value Fund Class As nya positioner inkluderar Aon plc (US:AON) , Centene Corporation (US:CNC) , Ventas, Inc. (US:VTR) , Vertiv Holdings Co (US:VRT) , and CMS Energy Corporation (US:CMS) .
Största ökningarna detta kvartal
Vi använder förändringen i portföljallokeringen eftersom det är det mest meningsfulla måttet. Förändringar kan bero på transaktioner eller förändringar i aktiekurser.
| Värdepapper | Aktier (MM) |
Värde (MM$) |
Portfölj % av | ΔPortfölj % av |
|---|---|---|---|---|
| 0,30 | 53,47 | 1,8240 | 1,8240 | |
| 1,23 | 44,93 | 1,5329 | 1,5329 | |
| 1,30 | 44,83 | 1,5294 | 1,5294 | |
| 0,11 | 39,13 | 1,3348 | 1,3348 | |
| 0,61 | 36,29 | 1,2379 | 1,2379 | |
| 0,22 | 35,05 | 1,1957 | 1,1957 | |
| 0,49 | 34,30 | 1,1700 | 1,1700 | |
| 0,61 | 104,15 | 3,5529 | 1,0812 | |
| 0,26 | 22,29 | 0,7605 | 0,7605 | |
| 0,27 | 20,18 | 0,6884 | 0,6884 |
Största minskningarna detta kvartal
Vi använder förändringen i portföljallokeringen eftersom det är det mest meningsfulla måttet. Förändringar kan bero på transaktioner eller förändringar i aktiepriser.
| Värdepapper | Aktier (MM) |
Värde (MM$) |
Portfölj % av | ΔPortfölj % av |
|---|---|---|---|---|
| 0,51 | 10,32 | 0,3521 | −1,3323 | |
| 0,00 | 0,00 | −1,1119 | ||
| 0,00 | 0,00 | −1,0569 | ||
| 0,00 | 0,00 | −0,8384 | ||
| 0,00 | 0,00 | −0,6781 | ||
| 0,18 | 12,12 | 0,4134 | −0,5566 | |
| 0,18 | 72,23 | 2,4640 | −0,5106 | |
| 2,37 | 22,45 | 0,7659 | −0,5099 | |
| 0,43 | 39,44 | 1,3453 | −0,5025 | |
| 0,09 | 23,22 | 0,7923 | −0,4268 |
13F- och fond arkiveringar
Denna blankett lämnades in den 2025-06-26 för rapporteringsperioden 2025-04-30. Klicka på länksymbolen för att se hela transaktionshistoriken.
Uppgradera för att låsa upp premiumdata och exportera till Excel![]() .
.
| Värdepapper | Typ | Genomsnittligt aktiepris | Aktier (MM) |
ΔAktier (%) |
ΔAktier (%) |
Värde ($MM) |
Portfölj (%) |
ΔPortfölj (%) |
|
|---|---|---|---|---|---|---|---|---|---|
| PM / Philip Morris International Inc. | 0,61 | 2,75 | 104,15 | 35,24 | 3,5529 | 1,0812 | |||
| WFC / Wells Fargo & Company | 1,17 | 2,75 | 82,99 | −7,40 | 2,8313 | −0,0454 | |||
| T / AT&T Inc. | 2,71 | −15,46 | 75,18 | −1,32 | 2,5647 | 0,1196 | |||
| C / Citigroup Inc. - Corporate Bond/Note | 1,07 | 2,75 | 73,40 | −13,71 | 2,5040 | −0,2262 | |||
| UNH / UnitedHealth Group Incorporated | 0,18 | 2,75 | 72,23 | −22,07 | 2,4640 | −0,5106 | |||
| CI / The Cigna Group | 0,21 | 2,75 | 71,54 | 18,76 | 2,4407 | 0,5072 | |||
| ABT / Abbott Laboratories | 0,50 | −14,74 | 65,00 | −1,48 | 2,2176 | 0,0594 | |||
| NEE / NextEra Energy, Inc. | 0,87 | 2,75 | 58,40 | −3,97 | 1,9923 | 0,0405 | |||
| FNF / Fidelity National Financial, Inc. | 0,90 | 2,75 | 57,94 | 13,14 | 1,9767 | 0,3330 | |||
| MSFT / Microsoft Corporation | 0,14 | 42,03 | 56,71 | 35,26 | 1,9347 | 0,5890 | |||
| VICI / VICI Properties Inc. | 1,67 | 2,75 | 53,48 | 10,52 | 1,8243 | 0,2713 | |||
| COF / Capital One Financial Corporation | 0,30 | 53,47 | 1,8240 | 1,8240 | |||||
| PLD / Prologis, Inc. | 0,52 | 2,75 | 52,88 | −11,94 | 1,8040 | −0,1233 | |||
| ZBH / Zimmer Biomet Holdings, Inc. | 0,48 | 2,75 | 49,70 | −3,28 | 1,6955 | 0,0462 | |||
| ETN / Eaton Corporation plc | 0,16 | 23,71 | 48,13 | 9,83 | 1,6418 | 0,3102 | |||
| SHEL / Shell plc | 0,74 | 19,32 | 48,02 | 16,84 | 1,6380 | 0,3190 | |||
| FIS / Fidelity National Information Services, Inc. | 0,61 | 44,92 | 47,84 | 40,32 | 1,6321 | 0,5378 | |||
| LNT / Alliant Energy Corporation | 0,78 | 2,75 | 47,50 | 6,52 | 1,6205 | 0,1893 | |||
| WAB / Westinghouse Air Brake Technologies Corporation | 0,25 | 34,20 | 46,37 | 19,24 | 1,5820 | 0,3338 | |||
| GEN / Gen Digital Inc. | 1,79 | 2,75 | 46,20 | −1,22 | 1,5760 | 0,0750 | |||
| PH / Parker-Hannifin Corporation | 0,08 | 2,75 | 46,08 | −12,07 | 1,5721 | −0,1100 | |||
| JCI / Johnson Controls International plc | 0,54 | 52,03 | 45,66 | 63,53 | 1,5576 | 0,6615 | |||
| WM / Waste Management, Inc. | 0,20 | 28,82 | 45,65 | 36,48 | 1,5574 | 0,4838 | |||
| LVS / Las Vegas Sands Corp. | 1,23 | 44,93 | 1,5329 | 1,5329 | |||||
| KDP / Keurig Dr Pepper Inc. | 1,30 | 44,83 | 1,5294 | 1,5294 | |||||
| SYF / Synchrony Financial | 0,86 | 10,74 | 44,74 | −16,60 | 1,5263 | −0,1954 | |||
| DHR / Danaher Corporation | 0,22 | −1,10 | 44,74 | −21,66 | 1,5263 | −0,1483 | |||
| CCI / Crown Castle Inc. | 0,42 | 33,16 | 44,18 | 57,73 | 1,5071 | 0,6082 | |||
| ELV / Elevance Health, Inc. | 0,10 | −21,75 | 44,00 | −16,83 | 1,5011 | −0,1968 | |||
| WTW / Willis Towers Watson Public Limited Company | 0,14 | 2,75 | 42,88 | −4,03 | 1,4627 | 0,0287 | |||
| THC / Tenet Healthcare Corporation | 0,30 | 14,21 | 42,70 | 15,88 | 1,4568 | 0,2741 | |||
| BDX / Becton, Dickinson and Company | 0,21 | 2,75 | 42,50 | −14,06 | 1,4498 | −0,1373 | |||
| MA / Mastercard Incorporated | 0,08 | 2,75 | 42,39 | 1,39 | 1,4460 | 0,1042 | |||
| COP / ConocoPhillips | 0,45 | 2,75 | 40,03 | −7,34 | 1,3656 | −0,0210 | |||
| EMR / Emerson Electric Co. | 0,38 | 2,75 | 39,88 | −16,89 | 1,3604 | −0,1796 | |||
| SO / The Southern Company | 0,43 | −37,42 | 39,44 | −31,50 | 1,3453 | −0,5025 | |||
| SNX / TD SYNNEX Corporation | 0,35 | 2,75 | 39,18 | −20,11 | 1,3367 | −0,2374 | |||
| AON / Aon plc | 0,11 | 39,13 | 1,3348 | 1,3348 | |||||
| KKR / KKR & Co. Inc. | 0,34 | 11,74 | 39,06 | −23,57 | 1,3323 | −0,3078 | |||
| DUK / Duke Energy Corporation | 0,32 | −2,49 | 38,98 | 6,24 | 1,3297 | 0,1522 | |||
| DOV / Dover Corporation | 0,23 | 2,75 | 38,76 | −13,91 | 1,3223 | −0,1227 | |||
| AVGO / Broadcom Inc. | 0,20 | 2,75 | 37,64 | −10,62 | 1,2839 | −0,0675 | |||
| CNC / Centene Corporation | 0,61 | 36,29 | 1,2379 | 1,2379 | |||||
| ROP / Roper Technologies, Inc. | 0,06 | −24,84 | 36,05 | −26,87 | 1,2298 | −0,3524 | |||
| BAC / Bank of America Corporation | 0,89 | 2,75 | 35,32 | −11,49 | 1,2049 | −0,0759 | |||
| SPG / Simon Property Group, Inc. | 0,22 | 35,05 | 1,1957 | 1,1957 | |||||
| BSX / Boston Scientific Corporation | 0,34 | −16,22 | 35,02 | −15,81 | 1,1948 | −0,1403 | |||
| EXPE / Expedia Group, Inc. | 0,22 | 34,01 | 34,89 | 23,02 | 1,1904 | 0,2800 | |||
| VTR / Ventas, Inc. | 0,49 | 34,30 | 1,1700 | 1,1700 | |||||
| PR / Permian Resources Corporation | 2,74 | 23,79 | 32,35 | −0,29 | 1,1035 | 0,0623 | |||
| ALL / The Allstate Corporation | 0,16 | 2,75 | 31,15 | 5,99 | 1,0627 | 0,1194 | |||
| NVT / nVent Electric plc | 0,57 | 74,30 | 31,06 | 47,04 | 1,0597 | 0,3816 | |||
| GOOG / Alphabet Inc. | 0,19 | 13,77 | 31,02 | −10,97 | 1,0582 | −0,0600 | |||
| EGP / EastGroup Properties, Inc. | 0,19 | 2,75 | 30,32 | −1,00 | 1,0344 | 0,0514 | |||
| DD / DuPont de Nemours, Inc. | 0,45 | −15,98 | 29,64 | −27,80 | 1,0112 | −0,3065 | |||
| ICE / Intercontinental Exchange, Inc. | 0,18 | −31,59 | 29,54 | −28,11 | 1,0076 | −0,3110 | |||
| US7587501039 / Regal-Beloit Corp. | 0,28 | 14,85 | 29,12 | −23,42 | 0,9934 | −0,2271 | |||
| META / Meta Platforms, Inc. | 0,05 | 8,80 | 28,68 | −13,33 | 0,9783 | −0,0836 | |||
| EXR / Extra Space Storage Inc. | 0,18 | 2,75 | 27,03 | −2,24 | 0,9222 | 0,0347 | |||
| FE / FirstEnergy Corp. | 0,59 | 2,75 | 25,13 | 10,70 | 0,8574 | 0,1287 | |||
| TT / Trane Technologies plc | 0,07 | 2,75 | 24,94 | 8,58 | 0,8508 | 0,1136 | |||
| TSM / Taiwan Semiconductor Manufacturing Company Limited - Depositary Receipt (Common Stock) | 0,15 | −12,68 | 24,82 | −30,46 | 0,8467 | −0,2988 | |||
| ITT / ITT Inc. | 0,18 | 2,75 | 24,70 | −6,77 | 0,8427 | −0,0077 | |||
| CRM / Salesforce, Inc. | 0,09 | −22,25 | 23,22 | −38,86 | 0,7923 | −0,4268 | |||
| ELAN / Elanco Animal Health Incorporated | 2,37 | −28,33 | 22,45 | −43,52 | 0,7659 | −0,5099 | |||
| VRT / Vertiv Holdings Co | 0,26 | 22,29 | 0,7605 | 0,7605 | |||||
| CMS / CMS Energy Corporation | 0,27 | 20,18 | 0,6884 | 0,6884 | |||||
| AMAT / Applied Materials, Inc. | 0,11 | 20,19 | 17,23 | 0,43 | 0,5876 | 0,0372 | |||
| SW / Smurfit Westrock Plc | 0,34 | 14,28 | 0,4871 | 0,4871 | |||||
| NVO / Novo Nordisk A/S - Depositary Receipt (Common Stock) | 0,18 | −49,04 | 12,12 | −59,91 | 0,4134 | −0,5566 | |||
| INTC / Intel Corporation | 0,51 | −57,05 | 10,32 | −79,96 | 0,3521 | −1,3323 | |||
| US85748R0096 / Dreyfus Institutional Preferred Government Plus Money Market Fund | 0,43 | −24,74 | 0,0147 | −0,0037 | |||||
| MRVL / Marvell Technology, Inc. | 0,00 | −100,00 | 0,00 | −100,00 | −0,8384 | ||||
| HCA / HCA Healthcare, Inc. | 0,00 | −100,00 | 0,00 | −100,00 | −1,1119 | ||||
| ORCL / Oracle Corporation | 0,00 | −100,00 | 0,00 | −100,00 | −0,6781 | ||||
| PEP / PepsiCo, Inc. | 0,00 | −100,00 | 0,00 | −100,00 | −1,0569 |