Grundläggande statistik
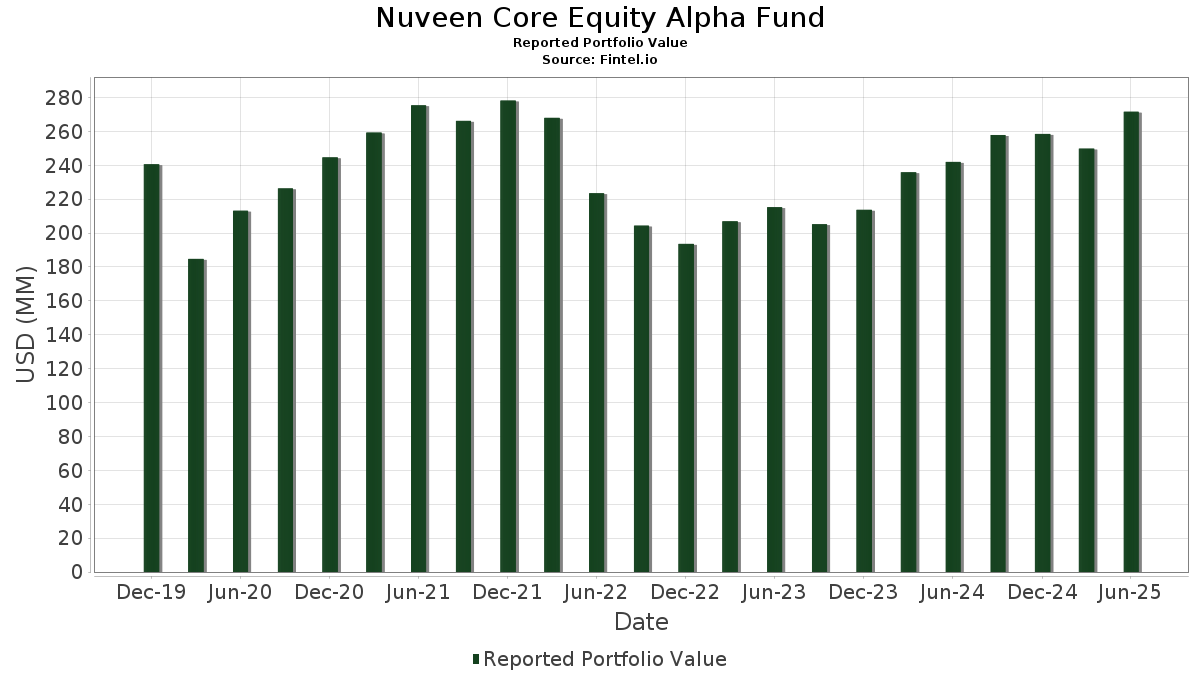
| Portföljvärde | $ 271 610 273 |
| Aktuella positioner | 133 |
Senaste innehav, resultat, förvaltat kapital (från 13F, 13D)
Nuveen Core Equity Alpha Fund har redovisat 133 totala innehav i sina senaste SEC-arkiveringar. Det senaste portföljvärdet beräknas vara $ 271 610 273 USD. Faktiskt förvaltade tillgångar (AUM) är detta värde plus likvida medel (som inte redovisas). Nuveen Core Equity Alpha Funds största innehav är NVIDIA Corporation (US:NVDA) , Microsoft Corporation (US:MSFT) , Apple Inc. (US:AAPL) , Amazon.com, Inc. (US:AMZN) , and Meta Platforms, Inc. (US:META) . Nuveen Core Equity Alpha Funds nya positioner inkluderar Dreyfus Institutional Preferred Government Plus Money Market Fund (US:US85748R0096) , Azenta, Inc. (US:AZTA) , STERIS plc (US:STE) , Lyft, Inc. (US:LYFT) , and StandardAero, Inc. (US:SARO) .
Största ökningarna detta kvartal
Vi använder förändringen i portföljallokeringen eftersom det är det mest meningsfulla måttet. Förändringar kan bero på transaktioner eller förändringar i aktiekurser.
| Värdepapper | Aktier (MM) |
Värde (MM$) |
Portfölj % av | ΔPortfölj % av |
|---|---|---|---|---|
| 0,13 | 21,21 | 7,9672 | 1,9006 | |
| 0,04 | 20,50 | 7,6983 | 1,2497 | |
| 0,02 | 3,03 | 1,1365 | 0,9161 | |
| 0,00 | 2,39 | 0,8993 | 0,8290 | |
| 0,01 | 1,93 | 0,7240 | 0,7240 | |
| 0,02 | 5,15 | 1,9361 | 0,6307 | |
| 0,05 | 1,41 | 0,5308 | 0,5308 | |
| 0,01 | 1,39 | 0,5206 | 0,5206 | |
| 0,02 | 1,38 | 0,5173 | 0,5173 | |
| 0,08 | 1,33 | 0,5003 | 0,5003 |
Största minskningarna detta kvartal
Vi använder förändringen i portföljallokeringen eftersom det är det mest meningsfulla måttet. Förändringar kan bero på transaktioner eller förändringar i aktiepriser.
| Värdepapper | Aktier (MM) |
Värde (MM$) |
Portfölj % av | ΔPortfölj % av |
|---|---|---|---|---|
| 0,08 | 16,91 | 6,3506 | −1,2818 | |
| 0,01 | 1,79 | 0,6721 | −0,8503 | |
| 0,00 | 0,16 | 0,0616 | −0,7432 | |
| 0,00 | 0,10 | 0,0358 | −0,6713 | |
| 0,00 | 0,63 | 0,2361 | −0,5796 | |
| 0,00 | 0,00 | −0,5760 | ||
| 0,02 | 1,30 | 0,4865 | −0,5607 | |
| 0,01 | 0,47 | 0,1771 | −0,5364 | |
| 0,01 | 6,14 | 2,3063 | −0,5259 | |
| 0,00 | 0,18 | 0,0673 | −0,5172 |
13F- och fond arkiveringar
Denna blankett lämnades in den 2025-08-27 för rapporteringsperioden 2025-06-30. Klicka på länksymbolen för att se hela transaktionshistoriken.
Uppgradera för att låsa upp premiumdata och exportera till Excel![]() .
.
| Värdepapper | Typ | Genomsnittligt aktiepris | Aktier (MM) |
ΔAktier (%) |
ΔAktier (%) |
Värde ($MM) |
Portfölj (%) |
ΔPortfölj (%) |
|
|---|---|---|---|---|---|---|---|---|---|
| NVDA / NVIDIA Corporation | 0,13 | −1,89 | 21,21 | 43,03 | 7,9672 | 1,9006 | |||
| MSFT / Microsoft Corporation | 0,04 | −1,88 | 20,50 | 30,01 | 7,6983 | 1,2497 | |||
| AAPL / Apple Inc. | 0,08 | −1,89 | 16,91 | −9,38 | 6,3506 | −1,2818 | |||
| AMZN / Amazon.com, Inc. | 0,06 | −1,88 | 12,13 | 13,14 | 4,5553 | 0,1705 | |||
| META / Meta Platforms, Inc. | 0,01 | −11,68 | 8,76 | 13,10 | 3,2907 | 0,1220 | |||
| BRK.B / Berkshire Hathaway Inc. | 0,01 | −2,77 | 6,14 | −11,31 | 2,3063 | −0,5259 | |||
| GOOG / Alphabet Inc. | 0,03 | −1,89 | 6,07 | 11,39 | 2,2814 | 0,0510 | |||
| AVGO / Broadcom Inc. | 0,02 | −1,89 | 5,15 | 61,52 | 1,9361 | 0,6307 | |||
| GOOGL / Alphabet Inc. | 0,03 | −1,99 | 5,12 | 11,70 | 1,9222 | 0,0479 | |||
| NFLX / Netflix, Inc. | 0,00 | −10,71 | 5,02 | 28,22 | 1,8862 | 0,2841 | |||
| US85748R0096 / Dreyfus Institutional Preferred Government Plus Money Market Fund | 4,96 | −11,68 | 1,8629 | −0,4343 | |||||
| IVV / iShares Trust - iShares Core S&P 500 ETF | 0,01 | 29,70 | 4,88 | 43,32 | 1,8330 | 0,4402 | |||
| WMT / Walmart Inc. | 0,04 | −1,89 | 3,50 | 9,30 | 1,3154 | 0,0044 | |||
| LLY / Eli Lilly and Company | 0,00 | −1,99 | 3,46 | −7,48 | 1,3000 | −0,2304 | |||
| TSLA / Tesla, Inc. | 0,01 | −6,38 | 3,26 | 14,78 | 1,2254 | 0,0624 | |||
| BKNG / Booking Holdings Inc. | 0,00 | −3,64 | 3,07 | 21,12 | 1,1525 | 0,1160 | |||
| HD / The Home Depot, Inc. | 0,01 | 87,98 | 3,04 | 88,06 | 1,1416 | 0,4805 | |||
| JNJ / Johnson & Johnson | 0,02 | 509,70 | 3,03 | 462,27 | 1,1365 | 0,9161 | |||
| CSCO / Cisco Systems, Inc. | 0,04 | −1,89 | 2,96 | 10,33 | 1,1112 | 0,0141 | |||
| DIS / The Walt Disney Company | 0,02 | 4,17 | 2,79 | 30,92 | 1,0480 | 0,1759 | |||
| RTX / RTX Corporation | 0,02 | −1,87 | 2,61 | 8,16 | 0,9806 | −0,0066 | |||
| NOW / ServiceNow, Inc. | 0,00 | 0,00 | 2,58 | 29,13 | 0,9692 | 0,1518 | |||
| CRM / Salesforce, Inc. | 0,01 | 0,32 | 2,55 | 1,96 | 0,9567 | −0,0654 | |||
| JPM / JPMorgan Chase & Co. | 0,01 | −1,92 | 2,52 | 15,95 | 0,9474 | 0,0573 | |||
| BSX / Boston Scientific Corporation | 0,02 | −1,89 | 2,40 | 4,44 | 0,9013 | −0,0383 | |||
| INTU / Intuit Inc. | 0,00 | 985,71 | 2,39 | 1 300,00 | 0,8993 | 0,8290 | |||
| LRCX / Lam Research Corporation | 0,02 | −1,89 | 2,32 | 31,39 | 0,8727 | 0,1492 | |||
| QCOM / QUALCOMM Incorporated | 0,01 | 0,28 | 2,26 | 3,96 | 0,8488 | −0,0403 | |||
| SCHW / The Charles Schwab Corporation | 0,02 | −1,87 | 2,25 | 14,36 | 0,8437 | 0,0403 | |||
| CME / CME Group Inc. | 0,01 | −1,86 | 2,18 | 1,96 | 0,8189 | −0,0558 | |||
| PEP / PepsiCo, Inc. | 0,02 | 1,55 | 2,17 | −10,61 | 0,8138 | −0,1773 | |||
| SPGI / S&P Global Inc. | 0,00 | 109,74 | 2,16 | 114,10 | 0,8100 | 0,4112 | |||
| ICE / Intercontinental Exchange, Inc. | 0,01 | −1,87 | 2,12 | 4,33 | 0,7966 | −0,0346 | |||
| ADBE / Adobe Inc. | 0,01 | 0,37 | 2,11 | 1,25 | 0,7920 | −0,0599 | |||
| HON / Honeywell International Inc. | 0,01 | −3,04 | 2,08 | 5,74 | 0,7820 | −0,0494 | |||
| CPNG / Coupang, Inc. | 0,07 | −1,89 | 2,02 | 33,97 | 0,7587 | 0,1422 | |||
| HOOD / Robinhood Markets, Inc. | 0,02 | −32,70 | 1,97 | 51,46 | 0,7396 | 0,2075 | |||
| C / Citigroup Inc. | 0,02 | −11,76 | 1,95 | 5,80 | 0,7337 | −0,0216 | |||
| GD / General Dynamics Corporation | 0,01 | −1,92 | 1,94 | 4,92 | 0,7285 | −0,0275 | |||
| CAH / Cardinal Health, Inc. | 0,01 | −1,87 | 1,94 | 19,72 | 0,7276 | 0,0654 | |||
| MDT / Medtronic plc | 0,02 | −1,90 | 1,94 | −4,82 | 0,7272 | −0,1050 | |||
| KLAC / KLA Corporation | 0,00 | −20,30 | 1,93 | 4,99 | 0,7267 | −0,0269 | |||
| TMUS / T-Mobile US, Inc. | 0,01 | 1,93 | 0,7240 | 0,7240 | |||||
| DHR / Danaher Corporation | 0,01 | −1,93 | 1,90 | −5,51 | 0,7145 | −0,1090 | |||
| DUK / Duke Energy Corporation | 0,02 | −1,86 | 1,87 | −5,08 | 0,7016 | −0,1032 | |||
| ECL / Ecolab Inc. | 0,01 | −1,91 | 1,80 | 4,23 | 0,6760 | −0,0302 | |||
| WMB / The Williams Companies, Inc. | 0,03 | −1,89 | 1,79 | 3,11 | 0,6738 | −0,0378 | |||
| V / Visa Inc. | 0,01 | −52,54 | 1,79 | −51,92 | 0,6721 | −0,8503 | |||
| MCK / McKesson Corporation | 0,00 | 30,65 | 1,78 | 124,18 | 0,6688 | 0,2950 | |||
| LMT / Lockheed Martin Corporation | 0,00 | 1,59 | 1,77 | 5,29 | 0,6663 | −0,0226 | |||
| EXC / Exelon Corporation | 0,04 | −1,89 | 1,76 | −7,57 | 0,6607 | −0,1176 | |||
| CL / Colgate-Palmolive Company | 0,02 | −1,88 | 1,75 | −4,83 | 0,6583 | −0,0949 | |||
| USB / U.S. Bancorp | 0,04 | 142,13 | 1,69 | 129,00 | 0,6350 | 0,3495 | |||
| MNST / Monster Beverage Corporation | 0,03 | −1,88 | 1,63 | 5,08 | 0,6134 | −0,0227 | |||
| AEP / American Electric Power Company, Inc. | 0,01 | 146,93 | 1,54 | 188,06 | 0,5803 | 0,3874 | |||
| JHG / Janus Henderson Group plc | 0,04 | 11,86 | 1,42 | 20,17 | 0,5351 | 0,0502 | |||
| GRMN / Garmin Ltd. | 0,01 | −1,88 | 1,42 | −5,65 | 0,5331 | −0,0824 | |||
| AZTA / Azenta, Inc. | 0,05 | 1,41 | 0,5308 | 0,5308 | |||||
| WSM / Williams-Sonoma, Inc. | 0,01 | 350,79 | 1,41 | 367,11 | 0,5283 | 0,4048 | |||
| FLS / Flowserve Corporation | 0,03 | 3,61 | 1,40 | 11,04 | 0,5254 | 0,0101 | |||
| CNC / Centene Corporation | 0,03 | −1,88 | 1,39 | −12,33 | 0,5213 | −0,1259 | |||
| STE / STERIS plc | 0,01 | 1,39 | 0,5206 | 0,5206 | |||||
| TSN / Tyson Foods, Inc. | 0,02 | −1,90 | 1,38 | −14,05 | 0,5198 | −0,1385 | |||
| SWKS / Skyworks Solutions, Inc. | 0,02 | 1,38 | 0,5173 | 0,5173 | |||||
| ZM / Zoom Communications Inc. | 0,02 | −1,89 | 1,38 | 3,77 | 0,5173 | −0,0259 | |||
| VOYA / Voya Financial, Inc. | 0,02 | 568,64 | 1,36 | 673,86 | 0,5118 | 0,4455 | |||
| DINO / HF Sinclair Corporation | 0,03 | −13,41 | 1,35 | 8,16 | 0,5079 | −0,0034 | |||
| LYFT / Lyft, Inc. | 0,08 | 1,33 | 0,5003 | 0,5003 | |||||
| PKG / Packaging Corporation of America | 0,01 | 14,47 | 1,33 | −4,19 | 0,4983 | −0,0373 | |||
| KD / Kyndryl Holdings, Inc. | 0,03 | 1 894,27 | 1,31 | 3 547,22 | 0,4935 | 0,4792 | |||
| SARO / StandardAero, Inc. | 0,04 | 1,31 | 0,4913 | 0,4913 | |||||
| HUM / Humana Inc. | 0,01 | 16,85 | 1,31 | −9,81 | 0,4904 | −0,0827 | |||
| MRK / Merck & Co., Inc. | 0,02 | −42,64 | 1,30 | −49,41 | 0,4865 | −0,5607 | |||
| VTR / Ventas, Inc. | 0,02 | −0,88 | 1,27 | −9,00 | 0,4789 | −0,0940 | |||
| HRB / H&R Block, Inc. | 0,02 | 5,09 | 1,27 | −9,23 | 0,4767 | −0,0768 | |||
| BMRN / BioMarin Pharmaceutical Inc. | 0,02 | 8,41 | 1,23 | −15,72 | 0,4633 | −0,1353 | |||
| CRH / CRH plc | 0,01 | −0,30 | 1,23 | 4,05 | 0,4631 | −0,0216 | |||
| INVH / Invitation Homes Inc. | 0,04 | 675,41 | 1,23 | 461,64 | 0,4624 | 0,3834 | |||
| TEAM / Atlassian Corporation | 0,01 | 11,01 | 1,21 | 6,24 | 0,4539 | −0,0114 | |||
| VNT / Vontier Corporation | 0,03 | 1,19 | 0,4481 | 0,4481 | |||||
| BAH / Booz Allen Hamilton Holding Corporation | 0,01 | −0,96 | 1,18 | −1,42 | 0,4420 | −0,0462 | |||
| VLTO / Veralto Corporation | 0,01 | −6,48 | 1,15 | −15,62 | 0,4326 | −0,1076 | |||
| KR / The Kroger Co. | 0,02 | −1,90 | 1,15 | 3,98 | 0,4316 | −0,0206 | |||
| SOFI / SoFi Technologies, Inc. | 0,06 | 151,39 | 1,09 | 293,84 | 0,4085 | 0,2955 | |||
| G / Genpact Limited | 0,02 | −5,35 | 1,06 | 29,50 | 0,3974 | 0,0521 | |||
| IDXX / IDEXX Laboratories, Inc. | 0,00 | −45,22 | 1,05 | −30,10 | 0,3928 | −0,2187 | |||
| XOM / Exxon Mobil Corporation | 0,01 | −8,44 | 1,01 | −17,01 | 0,3778 | −0,1180 | |||
| BIIB / Biogen Inc. | 0,01 | −17,89 | 0,98 | −24,63 | 0,3679 | −0,1638 | |||
| CTAS / Cintas Corporation | 0,00 | 146,59 | 0,97 | 167,87 | 0,3633 | 0,2153 | |||
| SO / The Southern Company | 0,01 | 35,97 | 0,96 | 35,73 | 0,3611 | 0,0715 | |||
| JCI / Johnson Controls International plc | 0,01 | −62,23 | 0,95 | −30,77 | 0,3559 | −0,2848 | |||
| KKR / KKR & Co. Inc. | 0,01 | −1,82 | 0,93 | 12,97 | 0,3503 | 0,0126 | |||
| GE / General Electric Company | 0,00 | −67,95 | 0,92 | −48,14 | 0,3451 | −0,4027 | |||
| MA / Mastercard Incorporated | 0,00 | −1,84 | 0,90 | 0,67 | 0,3379 | −0,0278 | |||
| MSI / Motorola Solutions, Inc. | 0,00 | −50,12 | 0,89 | −40,92 | 0,3348 | −0,3188 | |||
| TPR / Tapestry, Inc. | 0,01 | −70,54 | 0,83 | −45,56 | 0,3113 | −0,3477 | |||
| AYI / Acuity Inc. | 0,00 | −45,70 | 0,73 | −38,51 | 0,2757 | −0,2123 | |||
| PG / The Procter & Gamble Company | 0,00 | −1,99 | 0,71 | −8,42 | 0,2657 | −0,0501 | |||
| WDC / Western Digital Corporation | 0,01 | 0,68 | 0,2569 | 0,2569 | |||||
| UNH / UnitedHealth Group Incorporated | 0,00 | −1,86 | 0,66 | −41,56 | 0,2472 | −0,2134 | |||
| TMO / Thermo Fisher Scientific Inc. | 0,00 | −61,76 | 0,63 | −70,21 | 0,2361 | −0,5796 | |||
| ABBV / AbbVie Inc. | 0,00 | 121,71 | 0,63 | 96,54 | 0,2350 | 0,1047 | |||
| SMG / The Scotts Miracle-Gro Company | 0,01 | 0,60 | 0,2262 | 0,2262 | |||||
| COST / Costco Wholesale Corporation | 0,00 | −1,85 | 0,52 | 2,75 | 0,1971 | −0,0118 | |||
| CHRD / Chord Energy Corporation | 0,01 | −57,53 | 0,52 | −63,51 | 0,1939 | −0,3848 | |||
| BRO / Brown & Brown, Inc. | 0,00 | 0,51 | 0,1916 | 0,1916 | |||||
| RITM / Rithm Capital Corp. | 0,04 | −59,63 | 0,50 | −60,19 | 0,1894 | −0,3288 | |||
| CMCSA / Comcast Corporation | 0,01 | −73,12 | 0,47 | −74,46 | 0,1771 | −0,5364 | |||
| ADSK / Autodesk, Inc. | 0,00 | −16,36 | 0,43 | −0,93 | 0,1605 | −0,0162 | |||
| EW / Edwards Lifesciences Corporation | 0,01 | −75,35 | 0,43 | −73,40 | 0,1604 | −0,4963 | |||
| MAN / ManpowerGroup Inc. | 0,01 | 0,28 | 0,1067 | 0,1067 | |||||
| ESTC / Elastic N.V. | 0,00 | 0,26 | 0,0979 | 0,0979 | |||||
| TRGP / Targa Resources Corp. | 0,00 | −93,69 | 0,18 | −85,59 | 0,0673 | −0,5172 | |||
| WBD / Warner Bros. Discovery, Inc. | 0,02 | −72,62 | 0,18 | −72,73 | 0,0665 | −0,2613 | |||
| GILD / Gilead Sciences, Inc. | 0,00 | −91,57 | 0,16 | −91,66 | 0,0616 | −0,7432 | |||
| PPC / Pilgrim's Pride Corporation | 0,00 | 0,16 | 0,0583 | 0,0583 | |||||
| ORI / Old Republic International Corporation | 0,00 | −5,73 | 0,14 | 85,33 | 0,0523 | 0,0212 | |||
| DTE / DTE Energy Company | 0,00 | 0,13 | 0,0483 | 0,0483 | |||||
| FICO / Fair Isaac Corporation | 0,00 | 250,00 | 0,13 | 252,78 | 0,0481 | 0,0330 | |||
| DELL / Dell Technologies Inc. | 0,00 | 0,11 | 0,0410 | 0,0410 | |||||
| CRI / Carter's, Inc. | 0,00 | 0,11 | 0,0409 | 0,0409 | |||||
| MRVL / Marvell Technology, Inc. | 0,00 | 91,55 | 0,11 | 144,19 | 0,0395 | 0,0217 | |||
| BAC / Bank of America Corporation | 0,00 | −95,14 | 0,10 | −94,50 | 0,0358 | −0,6713 | |||
| VRSN / VeriSign, Inc. | 0,00 | −88,34 | 0,08 | −86,75 | 0,0282 | −0,2034 | |||
| CR / Crane Company | 0,00 | 0,04 | 0,0143 | 0,0143 | |||||
| PEGA / Pegasystems Inc. | 0,00 | 0,03 | 0,0130 | 0,0130 | |||||
| BROS / Dutch Bros Inc. | 0,00 | 0,02 | 0,0056 | 0,0056 | |||||
| MU / Micron Technology, Inc. - Depositary Receipt (Common Stock) | 0,00 | 0,0004 | 0,0004 | ||||||
| BWXT / BWX Technologies, Inc. | 0,00 | −100,00 | 0,00 | −100,00 | −0,0254 | ||||
| ITT / ITT Inc. | 0,00 | −100,00 | 0,00 | −100,00 | −0,4855 | ||||
| CHE / Chemed Corporation | 0,00 | −100,00 | 0,00 | −100,00 | −0,0881 | ||||
| ERIE / Erie Indemnity Company | 0,00 | −100,00 | 0,00 | −100,00 | −0,5760 | ||||
| MORN / Morningstar, Inc. | 0,00 | −100,00 | 0,00 | −100,00 | −0,4931 | ||||
| S&P 500 Index / DE (N/A) | −0,08 | −0,0291 | −0,0291 | ||||||
| S&P 500 Index / DE (N/A) | −0,15 | −0,0549 | −0,0549 | ||||||
| S&P 500 Index / DE (N/A) | −0,21 | −0,0771 | −0,0771 | ||||||
| S&P 500 Index / DE (N/A) | −0,37 | −0,1392 | −0,1392 | ||||||
| S&P 500 Index / DE (N/A) | −0,39 | −0,1461 | −0,1461 |