Grundläggande statistik
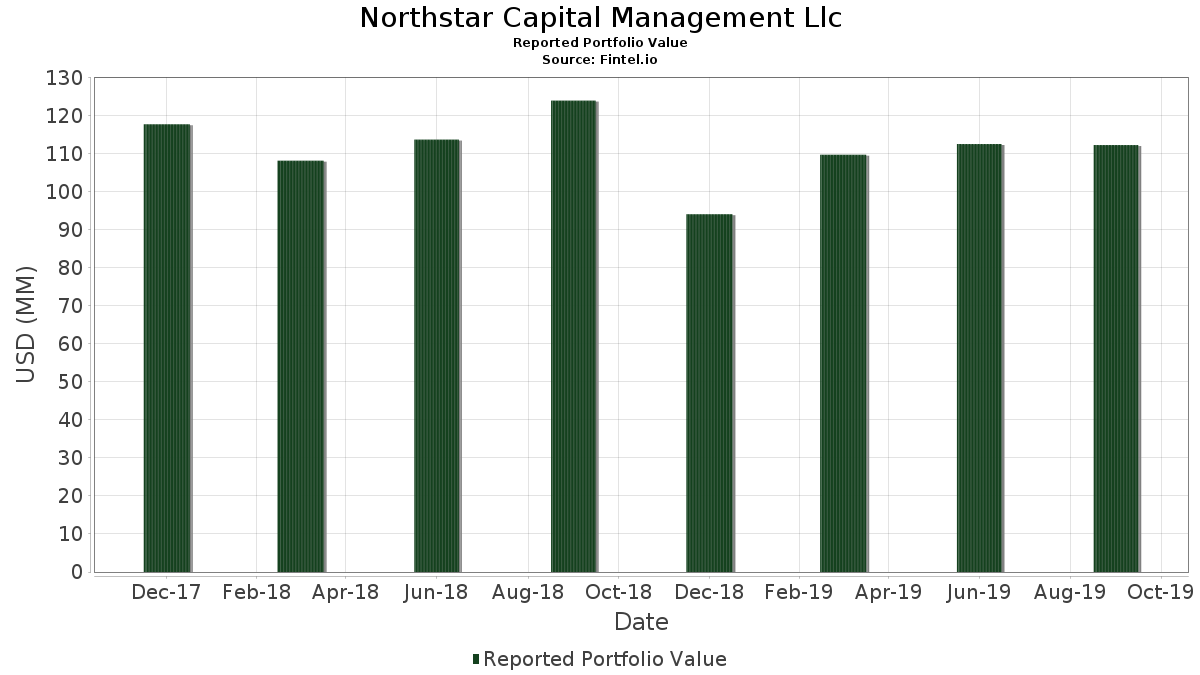
| Portföljvärde | $ 112 192 000 |
| Aktuella positioner | 88 |
Senaste innehav, resultat, förvaltat kapital (från 13F, 13D)
Northstar Capital Management Llc har redovisat 88 totala innehav i sina senaste SEC-arkiveringar. Det senaste portföljvärdet beräknas vara $ 112 192 000 USD. Faktiskt förvaltade tillgångar (AUM) är detta värde plus likvida medel (som inte redovisas). Northstar Capital Management Llcs största innehav är Amazon.com, Inc. (US:AMZN) , Apple Inc. (US:AAPL) , Visa Inc. (US:V) , Costco Wholesale Corporation (US:COST) , and The Home Depot, Inc. (US:HD) . Northstar Capital Management Llcs nya positioner inkluderar PayPal Holdings, Inc. (US:PYPL) , Dow Inc. (US:DOW) , .
Största ökningarna detta kvartal
Vi använder förändringen i portföljallokeringen eftersom det är det mest meningsfulla måttet. Förändringar kan bero på transaktioner eller förändringar i aktiekurser.
| Värdepapper | Aktier (MM) |
Värde (MM$) |
Portfölj % av | ΔPortfölj % av |
|---|---|---|---|---|
| 0,04 | 10,04 | 8,9534 | 0,8742 | |
| 0,02 | 1,93 | 1,7212 | 0,5625 | |
| 0,00 | 4,65 | 4,1447 | 0,4785 | |
| 0,02 | 4,90 | 4,3639 | 0,4702 | |
| 0,01 | 1,79 | 1,5955 | 0,4466 | |
| 0,00 | 1,30 | 1,1623 | 0,3220 | |
| 0,00 | 0,31 | 0,2763 | 0,2763 | |
| 0,02 | 5,38 | 4,7962 | 0,2578 | |
| 0,07 | 3,79 | 3,3799 | 0,1966 | |
| 0,01 | 2,20 | 1,9591 | 0,1914 |
Största minskningarna detta kvartal
Vi använder förändringen i portföljallokeringen eftersom det är det mest meningsfulla måttet. Förändringar kan bero på transaktioner eller förändringar i aktiepriser.
| Värdepapper | Aktier (MM) |
Värde (MM$) |
Portfölj % av | ΔPortfölj % av |
|---|---|---|---|---|
| 0,00 | 0,14 | 0,1248 | −123 598,2782 | |
| 0,01 | 11,16 | 9,9455 | −1,1019 | |
| 0,00 | 0,04 | 0,0357 | −0,9434 | |
| 0,01 | 0,34 | 0,3057 | −0,8582 | |
| 0,08 | 4,72 | 4,2071 | −0,7511 | |
| 0,02 | 3,63 | 3,2346 | −0,3915 | |
| 0,05 | 9,44 | 8,4106 | −0,2458 | |
| 0,03 | 3,65 | 3,2542 | −0,2403 | |
| 0,02 | 4,06 | 3,6161 | −0,1149 | |
| 0,00 | 0,81 | 0,7184 | −0,1103 |
13F- och fond arkiveringar
Denna blankett lämnades in den 2019-11-07 för rapporteringsperioden 2019-09-30. Klicka på länksymbolen för att se hela transaktionshistoriken.
Uppgradera för att låsa upp premiumdata och exportera till Excel![]() .
.
| Värdepapper | Typ | Genomsnittligt aktiepris | Aktier (MM) |
ΔAktier (%) |
ΔAktier (%) |
Värde ($MM) |
Portfölj (%) |
ΔPortfölj (%) |
|
|---|---|---|---|---|---|---|---|---|---|
| AMZN / Amazon.com, Inc. | 0,01 | −2,03 | 11,16 | −10,19 | 9,9455 | −1,1019 | |||
| AAPL / Apple Inc. | 0,04 | −2,30 | 10,04 | 10,55 | 8,9534 | 0,8742 | |||
| V / Visa Inc. | 0,05 | −2,20 | 9,44 | −3,07 | 8,4106 | −0,2458 | |||
| COST / Costco Wholesale Corporation | 0,02 | −3,29 | 5,38 | 5,43 | 4,7962 | 0,2578 | |||
| HD / The Home Depot, Inc. | 0,02 | 0,22 | 4,90 | 11,81 | 4,3639 | 0,4702 | |||
| SQ / Block, Inc. | 0,08 | −0,91 | 4,72 | −15,35 | 4,2071 | −0,7511 | |||
| GOOGL / Alphabet Inc. | 0,00 | 0,00 | 4,65 | 12,78 | 4,1447 | 0,4785 | |||
| APD / Air Products and Chemicals, Inc. | 0,02 | 0,62 | 4,07 | −1,38 | 3,6277 | −0,0420 | |||
| HON / Honeywell International Inc. | 0,02 | −0,23 | 4,06 | −3,31 | 3,6161 | −0,1149 | |||
| AMN / AMN Healthcare Services, Inc. | 0,07 | −0,17 | 3,79 | 5,92 | 3,3799 | 0,1966 | |||
| CRM / Salesforce, Inc. | 0,02 | 0,32 | 3,67 | −1,87 | 3,2739 | −0,0544 | |||
| JNJ / Johnson & Johnson | 0,03 | 0,00 | 3,65 | −7,10 | 3,2542 | −0,2403 | |||
| UNH / UnitedHealth Group Incorporated | 0,02 | −0,06 | 3,63 | −11,01 | 3,2346 | −0,3915 | |||
| GOOG / Alphabet Inc. | 0,00 | −4,95 | 2,69 | 7,17 | 2,3977 | 0,1658 | |||
| STZ / Constellation Brands, Inc. | 0,01 | 0,00 | 2,60 | 5,27 | 2,3139 | 0,1211 | |||
| BKNG / Booking Holdings Inc. | 0,00 | 0,00 | 2,52 | 4,69 | 2,2479 | 0,1059 | |||
| CVX / Chevron Corporation | 0,02 | 0,31 | 2,36 | −4,42 | 2,1026 | −0,0919 | |||
| LMT / Lockheed Martin Corporation | 0,01 | 3,04 | 2,20 | 10,56 | 1,9591 | 0,1914 | |||
| MSFT / Microsoft Corporation | 0,02 | 0,00 | 2,19 | 3,78 | 1,9565 | 0,0758 | |||
| GS / The Goldman Sachs Group, Inc. | 0,01 | 0,00 | 2,02 | 1,25 | 1,8041 | 0,0265 | |||
| DIS / The Walt Disney Company | 0,02 | 10,46 | 2,01 | 3,07 | 1,7951 | 0,0576 | |||
| WM / Waste Management, Inc. | 0,02 | 48,60 | 1,93 | 48,20 | 1,7212 | 0,5625 | |||
| RTX / RTX Corporation | 0,01 | −9,79 | 1,86 | −5,43 | 1,6597 | −0,0912 | |||
| IQV / IQVIA Holdings Inc. | 0,01 | 49,28 | 1,79 | 38,54 | 1,5955 | 0,4466 | |||
| ISRG / Intuitive Surgical, Inc. | 0,00 | 7,04 | 1,73 | 10,18 | 1,5438 | 0,1460 | |||
| PEP / PepsiCo, Inc. | 0,01 | 0,00 | 1,48 | 4,54 | 1,3147 | 0,0601 | |||
| ADBE / Adobe Inc. | 0,00 | 47,19 | 1,30 | 37,99 | 1,1623 | 0,3220 | |||
| TXN / Texas Instruments Incorporated | 0,01 | 0,00 | 0,88 | 12,52 | 0,7853 | 0,0890 | |||
| BRK.B / Berkshire Hathaway Inc. | 0,00 | 0,00 | 0,85 | −2,41 | 0,7585 | −0,0169 | |||
| WDAY / Workday, Inc. | 0,00 | 29,95 | 0,81 | 7,40 | 0,7247 | 0,0515 | |||
| NFLX / Netflix, Inc. | 0,00 | 18,69 | 0,81 | −13,52 | 0,7184 | −0,1103 | |||
| XOM / Exxon Mobil Corporation | 0,01 | −2,44 | 0,72 | −10,14 | 0,6400 | −0,0705 | |||
| PG / The Procter & Gamble Company | 0,01 | −3,68 | 0,65 | 9,23 | 0,5803 | 0,0503 | |||
| MPC / Marathon Petroleum Corporation | 0,01 | 0,00 | 0,63 | 8,68 | 0,5580 | 0,0458 | |||
| TMO / Thermo Fisher Scientific Inc. | 0,00 | 0,00 | 0,48 | −0,82 | 0,4287 | −0,0025 | |||
| SPY / SPDR S&P 500 ETF | 0,00 | −24,21 | 0,40 | −23,27 | 0,3556 | −0,1067 | |||
| BAC / Bank of America Corporation | 0,01 | −73,94 | 0,34 | −73,80 | 0,3057 | −0,8582 | |||
| JPM / JPMorgan Chase & Co. | 0,00 | 0,00 | 0,33 | 5,40 | 0,2959 | 0,0158 | |||
| SHOP / Shopify Inc. | 0,00 | 140,14 | 0,33 | 150,00 | 0,2941 | 0,1768 | |||
| PYPL / PayPal Holdings, Inc. | 0,00 | 0,31 | 0,2763 | 0,2763 | |||||
| MMM / 3M Company | 0,00 | 0,00 | 0,23 | −4,90 | 0,2077 | −0,0102 | |||
| BIIB / Biogen Inc. | 0,00 | 0,00 | 0,19 | −0,51 | 0,1729 | −0,0005 | |||
| INTC / Intel Corporation | 0,00 | 0,00 | 0,17 | 7,55 | 0,1524 | 0,0110 | |||
| CLX / The Clorox Company | 0,00 | −15,22 | 0,16 | −15,90 | 0,1462 | −0,0272 | |||
| AZO / AutoZone, Inc. | 0,00 | 762,50 | 0,15 | 733,33 | 0,1337 | 0,1177 | |||
| VFINX / Vanguard Index Funds - Vanguard Index Trust 500 Index Fund | 0,00 | 0,00 | 0,14 | 0,72 | 0,1248 | −123 598,2782 | |||
| T / AT&T Inc. | 0,00 | −21,48 | 0,14 | −11,54 | 0,1230 | −0,0157 | |||
| ITW / Illinois Tool Works Inc. | 0,00 | −14,89 | 0,12 | −11,76 | 0,1070 | −0,0140 | |||
| ORCL / Oracle Corporation | 0,00 | 0,00 | 0,11 | −3,51 | 0,0980 | −0,0033 | |||
| C.WSA / Citigroup, Inc. | 0,00 | 0,00 | 0,10 | −4,85 | 0,0874 | −0,0042 | |||
| IBM / International Business Machines Corporation | 0,00 | 0,00 | 0,09 | 4,82 | 0,0775 | 0,0037 | |||
| AMGN / Amgen Inc. | 0,00 | 0,00 | 0,08 | 4,05 | 0,0686 | 0,0028 | |||
| RTN / Raytheon Co. | 0,00 | 0,00 | 0,07 | 11,86 | 0,0588 | 0,0064 | |||
| HCC / Warrior Met Coal, Inc. | 0,00 | 0,00 | 0,07 | 10,17 | 0,0579 | 0,0055 | |||
| HSY / The Hershey Company | 0,00 | 0,00 | 0,06 | 14,81 | 0,0553 | 0,0072 | |||
| STT / State Street Corporation | 0,00 | 0,00 | 0,06 | 5,36 | 0,0526 | 0,0028 | |||
| TRV / The Travelers Companies, Inc. | 0,00 | 0,00 | 0,06 | −1,67 | 0,0526 | −0,0008 | |||
| HOG / Harley-Davidson, Inc. | 0,00 | 0,00 | 0,06 | 0,00 | 0,0499 | 0,0001 | |||
| AEP / American Electric Power Company, Inc. | 0,00 | 0,00 | 0,06 | 5,66 | 0,0499 | 0,0028 | |||
| MRK / Merck & Co., Inc. | 0,00 | 0,00 | 0,05 | 2,00 | 0,0455 | 0,0010 | |||
| GILD / Gilead Sciences, Inc. | 0,00 | 0,00 | 0,05 | −5,56 | 0,0455 | −0,0026 | |||
| PM / Philip Morris International Inc. | 0,00 | 0,00 | 0,05 | −3,85 | 0,0446 | −0,0017 | |||
| D / Dominion Energy, Inc. | 0,00 | 0,00 | 0,05 | 6,52 | 0,0437 | 0,0028 | |||
| ED / Consolidated Edison, Inc. | 0,00 | 0,00 | 0,05 | 6,82 | 0,0419 | 0,0028 | |||
| LOW / Lowe's Companies, Inc. | 0,00 | 0,00 | 0,04 | 7,69 | 0,0374 | 0,0028 | |||
| MO / Altria Group, Inc. | 0,00 | 0,00 | 0,04 | −12,77 | 0,0365 | −0,0052 | |||
| USB / U.S. Bancorp | 0,00 | −96,55 | 0,04 | −96,37 | 0,0357 | −0,9434 | |||
| BAX / Baxter International Inc. | 0,00 | 0,00 | 0,04 | 6,06 | 0,0312 | 0,0019 | |||
| MDLZ / Mondelez International, Inc. | 0,00 | 0,00 | 0,03 | 3,13 | 0,0294 | 0,0010 | |||
| CGC / Canopy Growth Corporation | 0,00 | 12,80 | 0,03 | −36,96 | 0,0258 | −0,0151 | |||
| TSLA / Tesla, Inc. | 0,00 | 0,00 | 0,02 | 9,09 | 0,0214 | 0,0018 | |||
| DOW / Dow Inc. | 0,00 | 0,00 | 0,02 | −4,00 | 0,0214 | −0,0008 | |||
| WMB / The Williams Companies, Inc. | 0,00 | 0,00 | 0,02 | −14,29 | 0,0214 | −0,0035 | |||
| META / Meta Platforms, Inc. | 0,00 | 0,00 | 0,02 | −8,00 | 0,0205 | −0,0017 | |||
| XXII / 22nd Century Group, Inc. | 0,01 | 0,00 | 0,02 | 5,26 | 0,0178 | 0,0009 | |||
| DOW / Dow Inc. | 0,00 | 0,02 | 0,0143 | 0,0000 | |||||
| ARNA / Arena Pharmaceuticals Inc | 0,00 | 0,00 | 0,01 | −21,05 | 0,0134 | −0,0035 | |||
| GWP / GW Pharmaceuticals plc | 0,00 | 0,00 | 0,01 | −31,25 | 0,0098 | −0,0044 | |||
| CTVA / Corteva, Inc. | 0,00 | 0,00 | 0,01 | −10,00 | 0,0080 | −0,0009 | |||
| CRON / Cronos Group Inc. | 0,00 | 28,70 | 0,01 | −25,00 | 0,0080 | −0,0026 | |||
| ABT / Abbott Laboratories | 0,00 | −84,89 | 0,01 | −85,71 | 0,0071 | −0,0427 | |||
| ABBV / AbbVie Inc. | 0,00 | 0,01 | 0,0071 | 0,0071 | |||||
| SWIR / Sierra Wireless Inc | 0,00 | 0,00 | 0,01 | −11,11 | 0,0071 | −0,0009 | |||
| ACB / Aurora Cannabis Inc. | 0,00 | 0,00 | 0,01 | −42,86 | 0,0071 | −0,0053 | |||
| CARA / Cara Therapeutics, Inc. | 0,00 | 0,00 | 0,01 | −14,29 | 0,0053 | −0,0009 | |||
| TLRY / Tilray Brands, Inc. | 0,00 | 0,00 | 0,01 | −50,00 | 0,0053 | −0,0053 | |||
| 03765K104 / Aphria Inc. | 0,00 | 71,00 | 0,01 | 25,00 | 0,0045 | 0,0009 | |||
| CRBP / Corbus Pharmaceuticals Holdings, Inc. | 0,00 | 0,00 | 0,00 | −33,33 | 0,0036 | −0,0018 | |||
| BDX / Becton, Dickinson and Company | 0,00 | −100,00 | 0,00 | −100,00 | −0,0116 | ||||
| DVY / iShares Trust - iShares Select Dividend ETF | 0,00 | −100,00 | 0,00 | −100,00 | −0,0285 |