Grundläggande statistik
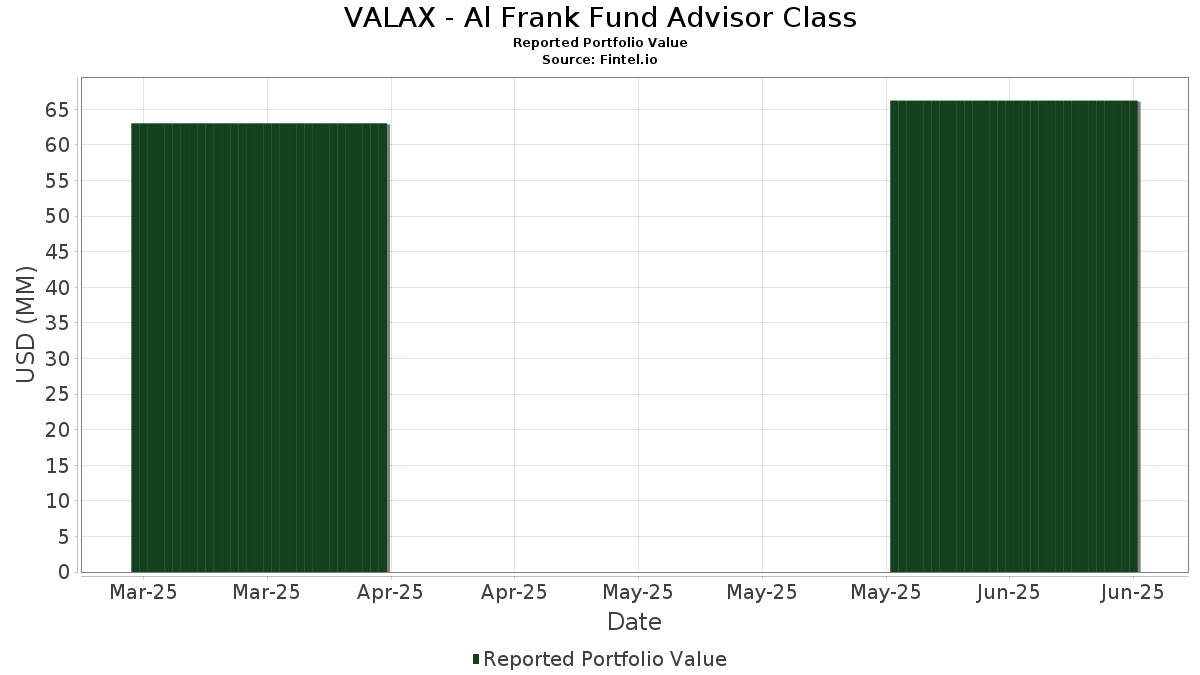
| Portföljvärde | $ 66 241 070 |
| Aktuella positioner | 68 |
Senaste innehav, resultat, förvaltat kapital (från 13F, 13D)
VALAX - Al Frank Fund Advisor Class har redovisat 68 totala innehav i sina senaste SEC-arkiveringar. Det senaste portföljvärdet beräknas vara $ 66 241 070 USD. Faktiskt förvaltade tillgångar (AUM) är detta värde plus likvida medel (som inte redovisas). VALAX - Al Frank Fund Advisor Classs största innehav är JPMorgan Chase & Co. (US:JPM) , Capital One Financial Corporation (US:COF) , Seagate Technology Holdings plc (US:STX) , Microsoft Corporation (US:MSFT) , and Fidelity Colchester Street Trust - Fidelity Institutional Money Market Funds Government Portfolio Class I (US:FIGXX) . VALAX - Al Frank Fund Advisor Classs nya positioner inkluderar Fidelity Colchester Street Trust - Fidelity Institutional Money Market Funds Government Portfolio Class I (US:FIGXX) , Abercrombie & Fitch Co. (US:ANF) , American Eagle Outfitters, Inc. (US:AEO) , .
Största ökningarna detta kvartal
Vi använder förändringen i portföljallokeringen eftersom det är det mest meningsfulla måttet. Förändringar kan bero på transaktioner eller förändringar i aktiekurser.
| Värdepapper | Aktier (MM) |
Värde (MM$) |
Portfölj % av | ΔPortfölj % av |
|---|---|---|---|---|
| 0,01 | 1,88 | 2,8317 | 1,0815 | |
| 0,00 | 1,87 | 2,8151 | 0,5842 | |
| 0,01 | 1,09 | 1,6498 | 0,5419 | |
| 0,00 | 1,65 | 2,4834 | 0,4705 | |
| 0,01 | 1,36 | 2,0567 | 0,4437 | |
| 0,00 | 0,29 | 0,4376 | 0,4376 | |
| 0,00 | 1,42 | 2,1443 | 0,3860 | |
| 0,00 | 1,25 | 1,8857 | 0,3779 | |
| 0,01 | 2,20 | 3,3252 | 0,3708 | |
| 0,01 | 2,02 | 3,0504 | 0,3510 |
Största minskningarna detta kvartal
Vi använder förändringen i portföljallokeringen eftersom det är det mest meningsfulla måttet. Förändringar kan bero på transaktioner eller förändringar i aktiepriser.
| Värdepapper | Aktier (MM) |
Värde (MM$) |
Portfölj % av | ΔPortfölj % av |
|---|---|---|---|---|
| 1,70 | 2,5624 | −2,2701 | ||
| 0,00 | 0,74 | 1,1143 | −0,5965 | |
| 0,02 | 0,86 | 1,2921 | −0,4956 | |
| 0,00 | 0,00 | −0,4469 | ||
| 0,01 | 0,48 | 0,7317 | −0,3691 | |
| 0,01 | 1,46 | 2,1984 | −0,3009 | |
| 0,02 | 0,96 | 1,4488 | −0,2844 | |
| 0,01 | 1,19 | 1,7896 | −0,2836 | |
| 0,01 | 1,38 | 2,0759 | −0,2612 | |
| 0,01 | 0,51 | 0,7673 | −0,2590 |
13F- och fond arkiveringar
Denna blankett lämnades in den 2025-08-28 för rapporteringsperioden 2025-06-30. Klicka på länksymbolen för att se hela transaktionshistoriken.
Uppgradera för att låsa upp premiumdata och exportera till Excel![]() .
.
| Värdepapper | Typ | Genomsnittligt aktiepris | Aktier (MM) |
ΔAktier (%) |
ΔAktier (%) |
Värde ($MM) |
Portfölj (%) |
ΔPortfölj (%) |
|
|---|---|---|---|---|---|---|---|---|---|
| JPM / JPMorgan Chase & Co. | 0,01 | 0,00 | 2,20 | 18,19 | 3,3252 | 0,3708 | |||
| COF / Capital One Financial Corporation | 0,01 | 0,00 | 2,02 | 18,67 | 3,0504 | 0,3510 | |||
| STX / Seagate Technology Holdings plc | 0,01 | 0,00 | 1,88 | 69,93 | 2,8317 | 1,0815 | |||
| MSFT / Microsoft Corporation | 0,00 | 0,00 | 1,87 | 32,55 | 2,8151 | 0,5842 | |||
| FIGXX / Fidelity Colchester Street Trust - Fidelity Institutional Money Market Funds Government Portfolio Class I | 1,70 | −44,34 | 2,5624 | −2,2701 | |||||
| GS / The Goldman Sachs Group, Inc. | 0,00 | 0,00 | 1,65 | 29,53 | 2,4834 | 0,4705 | |||
| IBM / International Business Machines Corporation | 0,01 | 0,00 | 1,62 | 18,58 | 2,4468 | 0,2795 | |||
| GOOG / Alphabet Inc. | 0,01 | 0,00 | 1,51 | 13,56 | 2,2756 | 0,1711 | |||
| AAPL / Apple Inc. | 0,01 | 0,00 | 1,46 | −7,67 | 2,1984 | −0,3009 | |||
| META / Meta Platforms, Inc. | 0,00 | 0,00 | 1,42 | 28,04 | 2,1443 | 0,3860 | |||
| GLW / Corning Incorporated | 0,03 | 0,00 | 1,42 | 14,81 | 2,1429 | 0,1841 | |||
| EOG / EOG Resources, Inc. | 0,01 | 0,00 | 1,38 | −6,72 | 2,0759 | −0,2612 | |||
| LRCX / Lam Research Corporation | 0,01 | 0,00 | 1,36 | 33,92 | 2,0567 | 0,4437 | |||
| BAC / Bank of America Corporation | 0,03 | 0,00 | 1,32 | 13,36 | 1,9996 | 0,1479 | |||
| FITB / Fifth Third Bancorp | 0,03 | 0,00 | 1,32 | 4,94 | 1,9863 | −0,0016 | |||
| ETN / Eaton Corporation plc | 0,00 | 0,00 | 1,25 | 31,34 | 1,8857 | 0,3779 | |||
| CSCO / Cisco Systems, Inc. | 0,02 | 0,00 | 1,25 | 12,43 | 1,8847 | 0,1244 | |||
| MET / MetLife, Inc. | 0,02 | 0,00 | 1,25 | 0,16 | 1,8812 | −0,0910 | |||
| PRU / Prudential Financial, Inc. | 0,01 | 0,00 | 1,24 | −3,82 | 1,8647 | −0,1707 | |||
| JNPR / Juniper Networks, Inc. | 0,03 | 0,00 | 1,20 | 10,32 | 1,8079 | 0,0873 | |||
| XOM / Exxon Mobil Corporation | 0,01 | 0,00 | 1,19 | −9,40 | 1,7896 | −0,2836 | |||
| CMI / Cummins Inc. | 0,00 | 0,00 | 1,15 | 4,47 | 1,7299 | −0,0086 | |||
| PNC / The PNC Financial Services Group, Inc. | 0,01 | 0,00 | 1,12 | 6,07 | 1,6881 | 0,0167 | |||
| DIS / The Walt Disney Company | 0,01 | 0,00 | 1,12 | 25,68 | 1,6844 | 0,2766 | |||
| GM / General Motors Company | 0,02 | 0,00 | 1,11 | 4,63 | 1,6710 | −0,0060 | |||
| ORCL / Oracle Corporation | 0,01 | 0,00 | 1,09 | 56,37 | 1,6498 | 0,5419 | |||
| NSC / Norfolk Southern Corporation | 0,00 | 0,00 | 1,09 | 8,05 | 1,6418 | 0,0466 | |||
| WMT / Walmart Inc. | 0,01 | 0,00 | 1,08 | 11,40 | 1,6232 | 0,0929 | |||
| NTAP / NetApp, Inc. | 0,01 | 0,00 | 1,07 | 21,30 | 1,6080 | 0,2160 | |||
| LMT / Lockheed Martin Corporation | 0,00 | 0,00 | 1,07 | 3,70 | 1,6076 | −0,0206 | |||
| ABT / Abbott Laboratories | 0,01 | 0,00 | 1,05 | 2,53 | 1,5908 | −0,0384 | |||
| CAT / Caterpillar Inc. | 0,00 | 0,00 | 1,05 | 17,75 | 1,5819 | 0,1707 | |||
| CAH / Cardinal Health, Inc. | 0,01 | 0,00 | 1,01 | 22,03 | 1,5213 | 0,2113 | |||
| TTE / TotalEnergies SE - Depositary Receipt (Common Stock) | 0,02 | 0,00 | 0,98 | −5,12 | 1,4824 | −0,1579 | |||
| IP / International Paper Company | 0,02 | 0,00 | 0,96 | −12,17 | 1,4488 | −0,2844 | |||
| DLR / Digital Realty Trust, Inc. | 0,01 | 0,00 | 0,96 | 21,57 | 1,4470 | 0,1981 | |||
| QCOM / QUALCOMM Incorporated | 0,01 | 0,00 | 0,96 | 3,69 | 1,4421 | −0,0185 | |||
| TFC / Truist Financial Corporation | 0,02 | 0,00 | 0,95 | 4,42 | 1,4274 | −0,0073 | |||
| GEN / Gen Digital Inc. | 0,03 | 0,00 | 0,88 | 10,80 | 1,3311 | 0,0693 | |||
| BMY / Bristol-Myers Squibb Company | 0,02 | 0,00 | 0,86 | −24,11 | 1,2921 | −0,4956 | |||
| JNJ / Johnson & Johnson | 0,01 | 0,00 | 0,86 | −7,87 | 1,2910 | −0,1808 | |||
| KIM / Kimco Realty Corporation | 0,04 | 0,00 | 0,84 | −1,06 | 1,2689 | −0,0775 | |||
| AMGN / Amgen Inc. | 0,00 | 0,00 | 0,84 | −10,39 | 1,2641 | −0,2171 | |||
| CVS / CVS Health Corporation | 0,01 | 0,00 | 0,76 | 1,74 | 1,1451 | −0,0359 | |||
| DE / Deere & Company | 0,00 | −36,87 | 0,74 | −31,60 | 1,1143 | −0,5965 | |||
| CMCSA / Comcast Corporation | 0,02 | 0,00 | 0,71 | −3,39 | 1,0773 | −0,0923 | |||
| FDX / FedEx Corporation | 0,00 | 0,00 | 0,68 | −6,84 | 1,0292 | −0,1298 | |||
| INTC / Intel Corporation | 0,03 | 0,00 | 0,62 | −1,28 | 0,9302 | −0,0601 | |||
| MDT / Medtronic plc | 0,01 | 0,00 | 0,61 | −3,02 | 0,9209 | −0,0760 | |||
| BHE / Benchmark Electronics, Inc. | 0,02 | 0,00 | 0,60 | 2,04 | 0,9083 | −0,0258 | |||
| NEM / Newmont Corporation | 0,01 | 0,00 | 0,58 | 20,75 | 0,8793 | 0,1141 | |||
| ADM / Archer-Daniels-Midland Company | 0,01 | 0,00 | 0,57 | 9,88 | 0,8563 | 0,0384 | |||
| WHR / Whirlpool Corporation | 0,01 | 0,00 | 0,56 | 12,53 | 0,8418 | 0,0562 | |||
| ENS / EnerSys | 0,01 | 0,00 | 0,56 | −6,39 | 0,8414 | −0,1020 | |||
| MRK / Merck & Co., Inc. | 0,01 | 0,00 | 0,55 | −11,78 | 0,8363 | −0,1595 | |||
| TSN / Tyson Foods, Inc. | 0,01 | 0,00 | 0,54 | −12,36 | 0,8147 | −0,1612 | |||
| ARE / Alexandria Real Estate Equities, Inc. | 0,01 | 0,00 | 0,51 | −21,48 | 0,7673 | −0,2590 | |||
| TGT / Target Corporation | 0,01 | 0,00 | 0,49 | −5,37 | 0,7444 | −0,0825 | |||
| MAN / ManpowerGroup Inc. | 0,01 | 0,00 | 0,48 | −30,26 | 0,7317 | −0,3691 | |||
| PFE / Pfizer Inc. | 0,02 | 0,00 | 0,48 | −4,35 | 0,7317 | −0,0715 | |||
| COHU / Cohu, Inc. | 0,03 | 0,00 | 0,48 | 31,06 | 0,7259 | 0,1431 | |||
| VZ / Verizon Communications Inc. | 0,01 | 0,00 | 0,48 | −4,62 | 0,7183 | −0,0724 | |||
| ZBH / Zimmer Biomet Holdings, Inc. | 0,01 | 0,00 | 0,46 | −19,29 | 0,6883 | −0,2086 | |||
| CE / Celanese Corporation | 0,01 | 0,00 | 0,41 | −2,59 | 0,6263 | −0,0485 | |||
| ALB / Albemarle Corporation | 0,00 | 0,00 | 0,30 | −13,04 | 0,4540 | −0,0939 | |||
| ANF / Abercrombie & Fitch Co. | 0,00 | 0,29 | 0,4376 | 0,4376 | |||||
| AEO / American Eagle Outfitters, Inc. | 0,02 | 0,23 | 0,3484 | 0,3484 | |||||
| EHC / Encompass Health Corporation | 0,00 | 0,00 | 0,00 | 0,0002 | 0,0000 | ||||
| FL / Foot Locker, Inc. | 0,00 | −100,00 | 0,00 | −100,00 | −0,4469 |